

Abstract
Objective:
Compared with men, women are disproportionately affected by alcohol, including greater risks of behavioral impairment and relapse from abstinence-based treatments. One potential mechanism underlying this disparity is ovarian hormone fluctuations across menstrual cycle phases, particularly estradiol (E2). Pre-clinical and clinical studies have shown that E2 levels positively correlate with alcohol consumption, suggesting E2 modulates drinking. Rewarding properties of alcohol are thought to mediate this relationship. The present study tested the degree to which women report increased rewarding effects from alcohol and heightened attention to alcohol-related cues when E2 was elevated during the late follicular phase of the menstrual cycle.
Method:
Fifty women aged 21–29 participated in a within-subjects placebo-controlled study examining how menstrual cycle phase alters the rewarding properties of alcohol and alcohol-associated cues when sober and intoxicated, as measured by their attentional bias towards alcohol-associated cues and subjective reports. Measures were obtained following 0.60 g/kg alcohol and placebo during the early follicular phase when E2 was low and the late follicular phase (i.e., ovulation) when E2 was elevated.
Results:
Attentional bias to alcohol-associated cues was greater during the late follicular phase in both sober and intoxicated states. Women reported rewarding effects from alcohol, but no effects of phase were observed.
Conclusions:
The findings suggest that the rewarding properties of alcohol-associated cues might be enhanced during the late follicular phase of the menstrual cycle when E2 is elevated, possibly increasing the risk for excessive drinking in women during this phase.
Keywords: Alcohol, Menstrual Cycle, Follicular Phase, Estradiol, Attentional Bias
Introduction
Significant health problems can arise from alcohol consumption, particularly among populations who engage in heavy drinking, such as binge drinking. For example, alcohol use disorders (AUDs) frequently co-occur with cardiovascular disease, liver cirrhosis, and cancers among both male and female populations. However, some adverse outcomes associated with alcohol consumption, such as greater chance of organ damage (Mumenthaler et al., 1999; Nolen-Hoeksema, 2004; Witt, 2007) and greater risk of neurotoxic effects (Hashimoto & Wiren, 2008; Satta et al., 2018; Wilhelm et al., 2016), are exacerbated in women. Women also exhibit patterns of substance abuse that differ from those seen in men, with faster acquisition, a higher frequency of relapse (Anker & Carroll, 2011; Hudson & Stamp, 2011), and a greater sensitivity to acute impairing effects of alcohol (Miller et al., 2009; Weafer et al., 2010). Furthermore, recent studies have indicated that alcohol consumption is on the rise among women (White et al., 2015), consequently making the negative outcomes of drinking of greater concern as they increase in frequency.
Menstrual cycle fluctuations in estradiol (E2) and other ovarian hormones have been linked to excessive alcohol consumption. E2 is the primary active form of estrogen in pre-menopausal women (Stillwell, 2016), and follows a consistent pattern during each menstrual cycle. E2 levels remain low in the early follicular phase immediately after menstruation, rise over the next week or two to peak during the late follicular phase around ovulation, and then decrease. E2 has a second, smaller peak during the luteal phase, then diminishes to its original level at the start of the follicular phase as the cycle repeats (Stillwell, 2016). Despite differences in their mechanisms of action, E2 and alcohol have common neurotransmission targets, including dopaminergic receptors in the mesolimbic pathway. Alcohol increases dopamine levels in this pathway, contributing to its rewarding properties. E2 modulates dopaminergic transmission in the same pathway (Barth et al., 2015; Yoest et al., 2014) which could enhance the rewarding effects of alcohol, leading to increased consumption of the drug (Di Chiara, 1997; Trantham-Davidson & Chandler, 2015).
Indeed, several pre-clinical and clinical studies have shown a positive association between E2 levels and alcohol consumption. Preclinical research has demonstrated a correlation between E2 levels throughout the estrous cycles of female rats and the quantity of ethanol consumed ad lib (Lancaster et al., 1996; Roberts et al., 1998). Specifically, studies in freely cycling rats observed greatest ethanol consumption at onset of the estrous cycle, when E2 is elevated (e.g., Lancaster et al., 1996). Additional evidence for the relationship between E2 and ethanol consumption is provided by studies that tested the effects of ovariectomization, which reduces ethanol consumption levels in female rats to those typically observed in males (Ford et al., 2002). However, injection of E2 into ovariectomized females restores ethanol consumption in a dose-dependent manner (Ford et al., 2002, 2004; Satta et al., 2018).
Clinical studies examining several phases of women’s menstrual cycles also have shown that higher E2 levels are associated with increased drinking, suggesting that E2 may play a significant role in modulating women’s alcohol consumption (Erol et al., 2019; Martel et al., 2017; Martin et al., 1999; Muti et al., 1998). Additionally, some clinical studies have demonstrated that alcohol consumption can elevate E2 levels (Reichman et al., 1993), indicating that the relationship between drinking and E2 levels may be bidirectional.
Although the association between elevated E2 and increased alcohol consumption might be due to an E2-induced increase in the rewarding effect of alcohol, no clinical research has tested the degree to which elevated E2 can increase the acute rewarding properties of a dose of alcohol in women. The current clinical study was designed to test this working hypothesis by measuring the rewarding properties of alcohol and alcohol-associated cues in relation to women’s E2 levels. The acute rewarding effects of alcohol were assessed with self-report scales of alcohol’s acute subjective effects, including positive (i.e., rewarding) effects, such as liking the effect and desiring more alcohol. These subject-rated scales have been widely used to assess the rewarding properties as indications of abuse potential of alcohol and several other drugs (de Wit & Griffiths, 1991; Fischman & Foltin, 1991). The scales are highly sensitive to alcohol, including the changes in blood alcohol concentration (BAC) as well as the differences in subjective states that drinkers experience on ascending versus descending limbs of the BAC curve (de Wit & Griffiths, 1991; deWit, 1996; Martin et al., 1993; Portans et al., 1989).
The current study also tested the degree to which the cues associated with drinking might take on the rewarding properties of alcohol. The rewarding properties of alcohol-related cues, such as images of beer or liquor bottles, are commonly measured by the visual attention an individual allocates to these cues compared with nonalcohol neutral cues. Rewarding properties of alcohol cues are indicated by an “attentional bias” towards such cues over neutral cues. Attentional bias is thought to result from a conditioning history wherein these cues become associated with the rewarding effects of alcohol (Field & Cox, 2008; Robinson & Berridge, 1993; Ryan, 2002). As the associative pairing between the alcohol effects and alcohol cues develops, these cues begin to acquire incentive salience, acting as anticipatory reward signals of alcohol itself, thus increasing the likelihood that such cues initiate alcohol consumption (Wiers et al., 2010).
Several studies have utilized attentional bias to examine the relationship between the anticipated rewarding effects of alcohol and alcohol consumption. Generally, it has been found that in the sober state, heavy drinkers exhibit greater attentional bias to alcohol than moderate or social drinkers (Fadardi & Cox, 2009; Field et al., 2004; Monem & Fillmore, 2017; Townshend & Duka, 2001; Weafer & Fillmore, 2013). Furthermore, there is some evidence that in inpatient AUD populations, greater attentional bias is correlated with an increased incidence of relapse (Cox et al., 2002). Other studies have examined how the acute administration of alcohol can affect attentional bias to its cues. Social and heavy drinkers display attentional bias when sober and under low doses (0.3 g/kg) of alcohol, and there are some reports that such doses can increase the drinker’s attentional bias (Duka & Townshend, 2004; Fernie et al., 2012; Schoenmakers et al., 2008; Weafer & Fillmore, 2013). However, drinkers’ attentional bias can diminish following high doses of alcohol (Monem & Fillmore, 2019; Weafer & Fillmore, 2013) possibly indicating a temporary satiety to alcohol because attentional bias returns again when BAC declines (Roberts & Fillmore, 2015). Taken together, the findings provide some validity for attentional bias as a measure of the rewarding properties of cues associated with drinking, possibly indicating patterns of excessive consumption. In combination with self-reports of the acute rewarding effects of alcohol, attentional bias expands the assessment of alcohol-related reward to include the anticipatory reward of drinking by assessing the rewarding properties of the cues that typically proceed consumption.
The present study tested the degree to which women report increased rewarding effects from alcohol and heightened attentional bias to alcohol-related cues when E2 was elevated during the late follicular phase of the menstrual cycle. Subjective reports of the rewarding effect of alcohol and attentional bias to alcohol-related cues were assessed in a group of premenopausal adult women following consumption of a controlled dose of 0.60 g/kg alcohol and following a placebo during two distinct phases of the menstrual cycle: the early follicular phase when E2 is low, and the late follicular phase (i.e., ovulation) when E2 is elevated. The study tested the hypothesis that subjective rewarding effects of alcohol and attentional bias to alcohol-associated cues would be greater during the late follicular phase of the menstrual cycle when E2 was highest compared with the early phase when E2 was lowest.
Methods
Participants
Fifty premenopausal adult women ages 21–29 were participants in this study. All women reported alcohol consumption at least four times per month, had regular menstrual cycles with an average duration of 21–35 days, and reported no use of hormone-based medication, including oral contraceptives, during the three months prior to participation. Women completed questionnaires on their demographics, drinking habits, and the status of their physical and mental health. Those with head trauma, other CNS injury, or a psychiatric disorder were excluded from participation. Women with a diagnosed substance use disorder as indicated by the Structured Clinical Interview for the DSM (SCID) were also excluded. In addition, women with a possible risk of AUD as indicated by an AUDIT score higher than 10 were excluded. Women taking medication contraindicated by alcohol use, or psychoactive medication, also were excluded. Recruitment continued until 50 eligible participants were acquired. Data on the acute effects of alcohol on indicators of reward served as a basis for power calculations to determine sample size.
Prior to test sessions, urine analysis was used to assess participant engagement in recent use of tetrahydrocannabinol (THC), cocaine, amphetamine, benzodiazepines, barbiturates, and opiates. Any participant who tested positive for any of these drugs, except for THC, was rescheduled or excluded from participation. Those whose urine analysis indicated the presence of THC were permitted to participate provided there was no self-reported THC use within 48 hours of the test session (n = 5). Six participants reported regular nicotine use but refrained from use during test sessions. Self-report and a urine test for human chorionic gonadotrophin (HCG) were used to screen out participants who were breast-feeding or pregnant. Participants were recruited via notices posted on community bulletin boards and by social media advertisements. All study volunteers provided informed consent prior to participation and received up to $440 for their participation. The University of Kentucky Medical Institutional Review Board approved the study (IRB Protocol 52637, Estradiol Effects on Behavioral and Reward Sensitivity to Alcohol Across the Menstrual Cycle).
Apparatus and Materials
Visual Dot Probe Task.
The visual dot probe task was used to measure participants’ attentional bias toward alcohol-associated images. During this task, participants viewed a series of presentations of image pairs comprised of a neutral image and alcohol-associated image presented side by side on a computer monitor. Ten images depicting an alcoholic beverage were matched with 10 images depicting a neutral, nonalcoholic beverage (e.g., a bottle of soda matched with a bottle of beer). A plain background was used for all images. The alcoholic beverages were comprised of two subcategories of alcohol type: liquor/wine and beer.
During each trial, a fixation point was presented for 500 ms in the center of the screen, followed by presentation of an image pair for 1,000 ms. Upon image offset, women responded to the appearance of a visual probe (“X”) by pressing one of two keys to indicate whether the probe appeared on the left or right. Eye-tracking software continuously monitored where participants’ gazes were focused.
Each of the 10 image pairs containing an alcoholic and neutral beverage appeared four times to enable presentation of all possible image-probe combinations (i.e., right and left image locations and right and left probe locations), yielding 40 test trials. Ten neutral image pairs (e.g. a keychain and calculator) were also presented four times each to produce 40 “filler” trials, which intended to prevent participants from habituating to the alcohol stimuli. Test trials were randomly intermixed with filler trials, yielding a total of 80 trials included in the task.
This task was operated using E-Prime experiment generation software (Psychology Software Tools, Pittsburgh, PA) and was performed on a PC connected to a Tobii Pro Fusion screen-based eye-tracker (Tobii Technology, Sweden). During the task, participants retained free control of neck and head motion while maintaining an approximate 60 cm distance from the computer monitor. Stimuli were presented on the PC, and dual embedded cameras in the Tobii Pro Fusion measured participants’ gaze locations, which were sampled at 120 Hz. Gazes with standard deviations less than 0.5 degrees of visual angle for durations of 50 ms or longer were defined as gaze fixations. The mean duration of gaze fixation directed towards each image type, either alcohol or neutral, was calculated by averaging fixation values across trials. In addition to calculating gaze fixations for alcohol and neutral images as a whole, gaze fixations towards the two subcategories of alcohol image type, liquor/wine and beer, along with neutral images corresponding to each alcohol image type were calculated. Liquor/wine and beer were analyzed separately due to a general preference for liquor and wine over beer among women as beverages of choice (Klatsky et al., 1990).
E-Prime also provided a measure of the reaction time to the visual probe. Faster reaction time to probes that replace alcohol versus neutral images indicates attention bias to alcohol images. Reaction times were only analyzed for trials in which there was a correct response, and values were averaged across trials to produce a mean reaction time for each image type: alcohol, liquor/wine, and beer, as well as neutral images corresponding to each alcohol image type.
Subjective Effects.
Visual analog scales (VAS) were used to assess the acute subjective effects of alcohol consumption. Participants rated their experience of four subjective effects: liking the effects, desire for more alcohol, stimulation, and intoxication. Women responded to each prompt on an electronic questionnaire by sliding a vertical mark on a 100 mm line, with the left side, 0, indicating not at all and the right side, 100, indicating very much.
Timeline Follow Back (TLFB).
The TLFB (Sobell & Sobell, 1992) assessed participants’ alcohol consumption during the 30 days before the intake session using a calendar. On each day, women estimated the quantity of standard drinks consumed, as well as the duration of the drinking episode. Binge days were designated by a level of consumption that yielded an 80 mg/100 ml BAC or higher based on the body weight of the participant. The TLFB provided four measures of drinking habits: (a) drinking days (total number of days alcohol was consumed), (b) binge days (total number of binges), (c) drunk days (total number of days women reported feeling drunk), and (d) total drinks (total drinks consumed throughout the 30 days).
Blood Alcohol Concentrations.
Blood alcohol concentrations (BACs) were determined from breath samples measured by an Intoxilyzer, Model 400 (CMI, Inc., Owensboro, KY).
Hormone Assessment.
Hormone levels were assessed using saliva samples, which women collected each morning via passive drool. Prior to collection, women were instructed not to brush their teeth, smoke, drink, or eat. Collection occurred within 30 min after waking, and samples were frozen immediately following collection. Salivary E2 (pg/mL), progesterone (P4, pg/mL), and luteinizing hormone (LH, mcg/ml) were assayed through the University of Kentucky Center for Clinical and Translational Science using enzyme immunoassay kits available through Salimetrics (State College, PA).
Procedure
Individuals who responded to the advertisements completed an online screening survey to assess their eligibility. Each year, thousands of women and men respond to our advertisements seeking participants for studies on alcohol by filling out brief “prescreen” inventories online. Each inventory is assessed to determine eligibility for participation, and eligible participants were contacted for this particular study via text and email. Approximately 5–10% of respondents to the prescreen were eligible. Of the women who were contacted as eligible, roughly 50% expressed interest in the study, and of those approximately 50% were successfully enrolled. Volunteers were told that the purpose of study was to examine the influence of the menstrual cycle on the behavioral effects of alcohol. All sessions were conducted in the Human Behavioral Pharmacology Laboratory of the Department of Psychology at the University of Kentucky and began between 10:00 a.m. and 6:00 p.m. Research assistants tested each participant individually. Participants were instructed to abstain from food for four hours and alcohol for 24 hours before test sessions. Prior to commencement of each test session, participants’ BACs were verified as zero, and their urine was analyzed for drug metabolites (On Trak TesTstiks, Roche Diagnostics Corporation, Indianapolis, IN) and pregnancy (Mainline Confirms HGL, Mainline Technology, Ann Arbor, MI). Test sessions were conducted in a small room containing a chair and a desk with a computer that operated the visual dot probe task.
Intake Session.
Intake sessions took place during the week that women anticipated the start of their menstrual cycle, occurring no more than 3 days following or 7 days prior to the onset of menstruation. During intake, women gave informed consent, become accustomed to the testing environment, filled out questionnaires, and practiced the visual dot probe task. Salivary test kits, as well as instructions for sample collection, were supplied to participants. When their periods began, each woman contacted the lab to schedule the test sessions. Women’s menstrual cycles were used to schedule two test sessions, anchored by start of menstruation as day zero. The first of two test sessions was scheduled on days 4–6, coinciding with onset of the follicular phase when E2 was lowest. The second session was scheduled on days 11–14, coinciding with the late follicular phase when ovulation was expected to occur and E2 levels would be highest. E2 levels were confirmed during these sessions with hormone assays. Test session order was counterbalanced across participants.
Test Sessions.
Identical protocols were utilized for the two test sessions. During each session, participants completed the visual dot probe task twice, first following 0.0 g/kg alcohol (placebo) and then later following 0.60 g/kg absolute alcohol. The active dose targeted a peak BAC of 80 mg/100 ml, occurring 60–75 mins following consumption. This dose was selected based on previous findings demonstrating that attentional bias is reliably affected at this BAC (Monem & Fillmore, 2019; Roberts & Fillmore, 2015; Weafer & Fillmore, 2013).
The active dose contained a ratio of one part 95% grain alcohol and three parts carbonated soda, and was separated equally into two glasses. Women were given six minutes to consume both glasses, which results in a 1.0 mg/100 ml/minute mean rate rise in BAC (Fillmore & Vogel-Sprott, 1998). An identical consumption protocol was implemented for the placebo. To provide taste cues of alcohol, the placebo beverage contained 3 ml of alcohol floating on the surface. Additionally, an alcohol mist was sprayed on the glasses to mimic condensation, which produced a potent alcoholic odor during consumption. Prior research has demonstrated that participants report alcoholic contents in this beverage (Fillmore et al., 1998).
Behavioral Testing.
The placebo was administered to participants at the beginning of each test session. Forty minutes later, women completed the visual dot probe task and ratings of subjective effects. Women then consumed 0.60 g/kg alcohol and completed the visual dot probe task 50 minutes following consumption. The elapsed time allowed for sufficient rise in BAC. Subjective effects were measured nine times following alcohol: 30, 50, 60, 90, 120, 150, 180, 210, and 240 mins. BAC was measured at regular 20-30-minute intervals throughout the session and coincided with completion of subjective effects measures.
Criterion Measures and Data Analyses
Attentional Bias.
Attentional bias toward alcohol was assessed using multiple measures. Eye-tracking data was used to calculate dwell, or the average fixation time on each cue type: “alcohol,” “liquor/wine,” and “beer,” with “liquor/wine” and “beer” being subsets of the “alcohol” cue category. Dwell was also calculated for “neutral” images. Attentional bias toward alcohol was indicated by the magnitude of difference by which dwell was greater to the alcohol versus neutral cues.
Reaction time to the visual probe was used as an auxiliary assessment of attentional bias to demonstrate convergent validity. Reaction times to the appearance of the visual probe following an “alcohol” or “neutral” cue were assessed separately. Attentional bias toward alcohol was indicated by the magnitude of difference by which reaction time to probes replacing alcohol cues was faster than to probes replacing neutral cues.
Data Analyses.
Cycle phase and alcohol dose effects on dwell and reaction time scores on the visual dot probe task were analyzed using a 2 Phase (early vs. late follicular) x 2 Dose (0.0 g/kg vs. 0.60 g/kg) x 2 Cue (alcohol vs. neutral) repeated measures analysis of variance (ANOVA). For dwell data, the primary measure of attentional bias, this analysis was conducted for alcohol cues versus neutral cues and for each type of alcohol cue (“liquor/wine,” and “beer”) versus their associated neutral cue.
To assess the effects of alcohol on subjective reward, paired t test comparisons were conducted for each subjective effect (“intoxication,” “like,” “desire,” “stimulation”) under placebo and 50 mins following alcohol consumption during both phases. These times are temporally coincident with completion of the visual dot probe task. Phase effects on the subjective reward of alcohol were assessed using a 2 Phase (early vs. late follicular) X 9 Time Interval ANOVA for ratings of each subjective effect completed under alcohol. The time intervals were: 30, 50, 60, 90, 120, 150, 180, 210, and 240 mins post alcohol administration.
Hormone levels were compared between the two test sessions using t tests to confirm that levels, particularly E2, were higher during the test session in the late versus early follicular phase. For each hormone (E2, P4, and LH) a three-day average level was calculated for each test session that consisted of the level observed on the test day averaged with the level observed on the day prior to and day following the test session. No assumptions of any statistical analyses were violated.
Transparency and Openness.
We report how we determined our sample size, all data exclusions (if any), all manipulations, and all measures in the study. This manuscript reports on one component of a larger clinical trial, which is registered as a Phase 1 clinical trial on https://clinicaltrials.gov NCT04595682. Deidentified study data – including subject demographic data and study results – will be submitted to the National Institute of Mental Health Data Archive (NDA) for all subjects who consent to have their data shared. Researchers can submit a request to access the data saved in the NDA database under Collection ID #3664. Data were analyzed using Systat 13. This study was not preregistered.
Results
Demographics and Drinking Habits
Participants’ mean drinking and demographic data are reported in Table 1, which shows that women reported consuming alcohol on an average of 9 days during a 30-day period. Average total consumption during that time frame equated to 25 standard drinks. Participants also reported, on average, feeling intoxicated twice and engaging in one binge. These data reflect alcohol consumption levels that are typically observed in this population (Fillmore & Jude, 2011). Of the 50 participants in the sample, the majority (n = 34) reported a preference for wine or liquor and 16 preferred beer. The sample had a racial makeup of White (n = 36), multiracial (n = 7), Black (n = 5), and Hispanic (n = 2).
Table 1.
Demographics and Drinking History
| Mean | SD | |
|---|---|---|
| Age | 23.52 | 2.54 |
| BMI | 24.52 | 3.58 |
| Education | 15.58 | 1.72 |
| TLFB Drinking Days | 9.40 | 4.57 |
| TLFB Drunk Days | 2.12 | 1.66 |
| TLFB Binge Days | 1.27 | 1.63 |
| TLFB Total Drinks | 25.14 | 15.29 |
| PDHQ Drinks | 2.69 | 0.95 |
| PDHQ Duration | 2.89 | 0.94 |
| PDHQ Frequency | 1.85 | 0.87 |
Composite demographic data for all participants (N=50). Age = years of age; BMI = body mass index; Education = years of education (e.g., high school degree = 12 years); TLFB drinking days = total number of drinking days in the past 30 days; TLFB drunk days = total number of days in which the participant drank to a level that they felt drunk in the past 30 days; TLFB binge days = number of days that met binge drinking criteria in the past 30 days, defined as drinking to or in excess of 80 mg/100 ml; TLFB total drinks = total number of drinks consumed in the past 30 days; PDHQ Drinks = average number of drinks consumed during a single typical drinking occasion; PDHQ Duration = length of a typical drinking occasion; PDHQ Frequency = typical number of drinking occasions in one week.
Hormones
During the early and late follicular phase, mean levels of E2 (pg/ml) were 1.15 (SD = 0.43) and 1.40 (SD = 0.47), respectively. During early and late follicular phase respective E2 levels ranged from [0.41 – 2.69] and [0.49 – 2.86]. Values were normally distributed and only one value was detected as an outlier. During early and late follicular phase respective levels of P4 (pg/ml) were 84.43 (SD = 60.33) and 101.69 (SD = 51.43), and respective levels of LH (mcg/ml) were 20.86 (SD = 19.28) and 64.55 (SD = 88.65). Due to missing data, 3 cases were excluded from analyses of differences in hormonal levels between the early and late follicular phases. Significantly higher late follicular phase levels for E2, t(46) = −4.203, p < 0.001, P4, t(46) = −2.50, p = 0.016, and LH, t(46) = −4.04, p < 0.001, were confirmed by paired t tests.
Blood Alcohol Concentration (BAC)
Women’s mean BACs over time following alcohol are found in Table 2, which shows that mean BACs throughout each session were nearly identical during the early and late follicular phase. Peak BAC occurred 60 mins following consumption, with a mean value of 76.5 mg/100 ml (SD = 10.67) during the early follicular phase, and a mean value of 77.72 mg/100 ml (SD = 9.6) during the late follicular phase. A 2 (Phase) x 9 (Time) ANOVA revealed a significant main effect of time, F(1, 49) = 235.0, p < 0.001, ηp2 = 0.83. As seen in Table 2, this effect is due to the rise and descent over time of participants’ BACs following alcohol during the session. No significant main effect of phase, F(1, 49) = 0.21, p = 0.647, or interaction, F(1, 49) = 1.30, p = 0.240, was observed. Paired t tests indicated no significant difference in BAC between the two test sessions at 50 mins post alcohol administration when participants began the visual dot probe task, t(49) = −1.379, p = 0.174. No detectable BACs were observed following placebo administration.
Table 2.
BAC and Subjective Effects
| Phase |
Placebo (0.0 g/kg)
M (SD) |
Alcohol (0.60 g/kg)
M (SD) |
|||||||||
|---|---|---|---|---|---|---|---|---|---|---|---|
| 30 mins | 30 mins | 50 mins | 60 mins | 90 mins | 120 mins | 150 mins | 180 mins | 210 mins | 240 mins | ||
| BAC | Early | -- | 67.70 (13.60) | 74.96 (11.33) | 76.50 (10.67) | 70.50 (10.43) | 63.22 (10.98) | 57.06 (9.36) | 51.52 (10.15) | 43.60 (9.77) | 36.56 (10.05) |
| Late | -- | 69.28 (15.42) | 77.12 (10.88) | 77.72 (9.59) | 71.36 (9.62) | 63.10 (9.45) | 57.04 (8.80) | 50.66 (8.24) | 43.30 (9.36) | 35.78 (9.13) | |
| Intoxication | Early | 27.16 (23.48) | 73.84 (16.32) | 76.79 (14.33) | 72.76 (18.12) | 68.38 (18.11) | 55.32 (23.19) | 43.21 (24.09) | 36.54 (24.04) | 23.92 (21.31) | 13.7 (18.79) |
| Late | 26.84 (24.38) | 74.16 (16.55) | 76.94 (14.85) | 73.9 (15.60) | 65.61 (19.28) | 55.78 (22.34) | 46.42 (23.06) | 37.42 (25.58) | 28.90 (24.70) | 18.32 (21.58) | |
| Like | Early | 39.02 (24.23) | 69.07 (23.29) | 61.31 (26.04) | 60.48 (24.38) | 55.66 (23.86) | 52.62 (22.13) | 46.14 (23.93) | 40.26 (21.90) | 38.92 (22.73) | 33.00 (21.08) |
| Late | 40.64 (24.28) | 70.52 (19.06) | 68.36 (18.04) | 64.64 (18.65) | 58.31 (23.44) | 54.06 (21.77) | 45.24 (22.91) | 42.52 (21.27) | 43.2 (20.11) | 37.1 (21.11) | |
| Desire | Early | 29.18 (21.84) | 31.85 (27.27) | 35.04 (30.07) | 31.92 (29.21) | 27.16 (26.95) | 23.58 (26.72) | 17.53 (22.43) | 14.51 (20.75) | 11.18 (17.22) | 9.4 (15.69) |
| Late | 34.08 (25.08) | 30.96 (28.84) | 34.7 (28.56) | 32.8 (28.06) | 29.18 (28.60) | 21.12 (22.73) | 18.62 (21.58) | 15.16 (19.21) | 12.8 (17.96) | 9.14 (16.88) | |
| Stimulation | Early | 30.20 (22.85) | 65.28 (18.72) | 65.18 (21.94) | 63.22 (23.32) | 55.64 (22.23) | 48.38 (20.66) | 42.70 (23.00) | 33.77 (22.77) | 28.80 (22.92) | 21.80 (21.96) |
| Late | 31.12 (24.10) | 65.78 (19.61) | 63.76 (21.81) | 61.18 (21.86) | 55.67 (19.44) | 49.34 (22.30) | 41.06 (21.37) | 36.90 (24.67) | 31.52 (23.47) | 24.36 (21.34) | |
Composite BAC and subjective effects data for all participants (N=50). Each column indicates the number of minutes post-consumption that measurements were completed. All subjective effects ratings were given on a scale of 1–100. Intoxication = participant’s subjective level of intoxication; Like = how much participant likes the effects she is feeling; Desire = participant’s desire to consume alcohol; Stimulation = participant’s subjective level of stimulation.
Attentional Bias
Alcohol Dwell.
Figures 1a and 1b show the mean dwell time on alcohol and neutral images in the visual dot probe task following placebo and alcohol administration during the early and late follicular phase. The figures show a greater dwell time for alcohol cues relative to neutral cues. Indeed, a 2 (Cue) x 2 (Dose) x 2 (Phase) ANOVA obtained a significant main effect of cue, F(1, 49) = 8.13, p = 0.006, ηp2 = 0.14. The figure also depicts a reduction in dwell time to both cues following alcohol consumption relative to placebo. This observation was confirmed by a significant main effect of dose, F(1, 49) = 4.25, p = 0.045, ηp2 = 0.08. No significant main effect of phase, F(1, 49) = 2.44, p = 0.125, or interactions were observed, ps > 0.141. To test the hypothesis that attentional bias would be greater during the late versus early phase, specific simple effect t test comparisons between alcohol and neutral cues were conducted at each phase following placebo and alcohol. The tests revealed significantly greater dwell to alcohol versus neutral cues following alcohol and placebo in the late phase, ps < 0.013, but no significant differences in dwell to alcohol versus neutral cues in the early phase following either dose, ps > 0.271. Cronbach’s alpha analyses confirmed a high degree of internal consistency of the participants’ dwell scores to the alcohol and to the neutral cues during each phase. In the early phase, coefficients for dwell times to the alcohol and neutral cues were 0.825 and 0.762 respectively. At late phase the coefficients of dwell times to the alcohol and neutral cues were 0.816 and 0.821 respectively.
Figure 1.
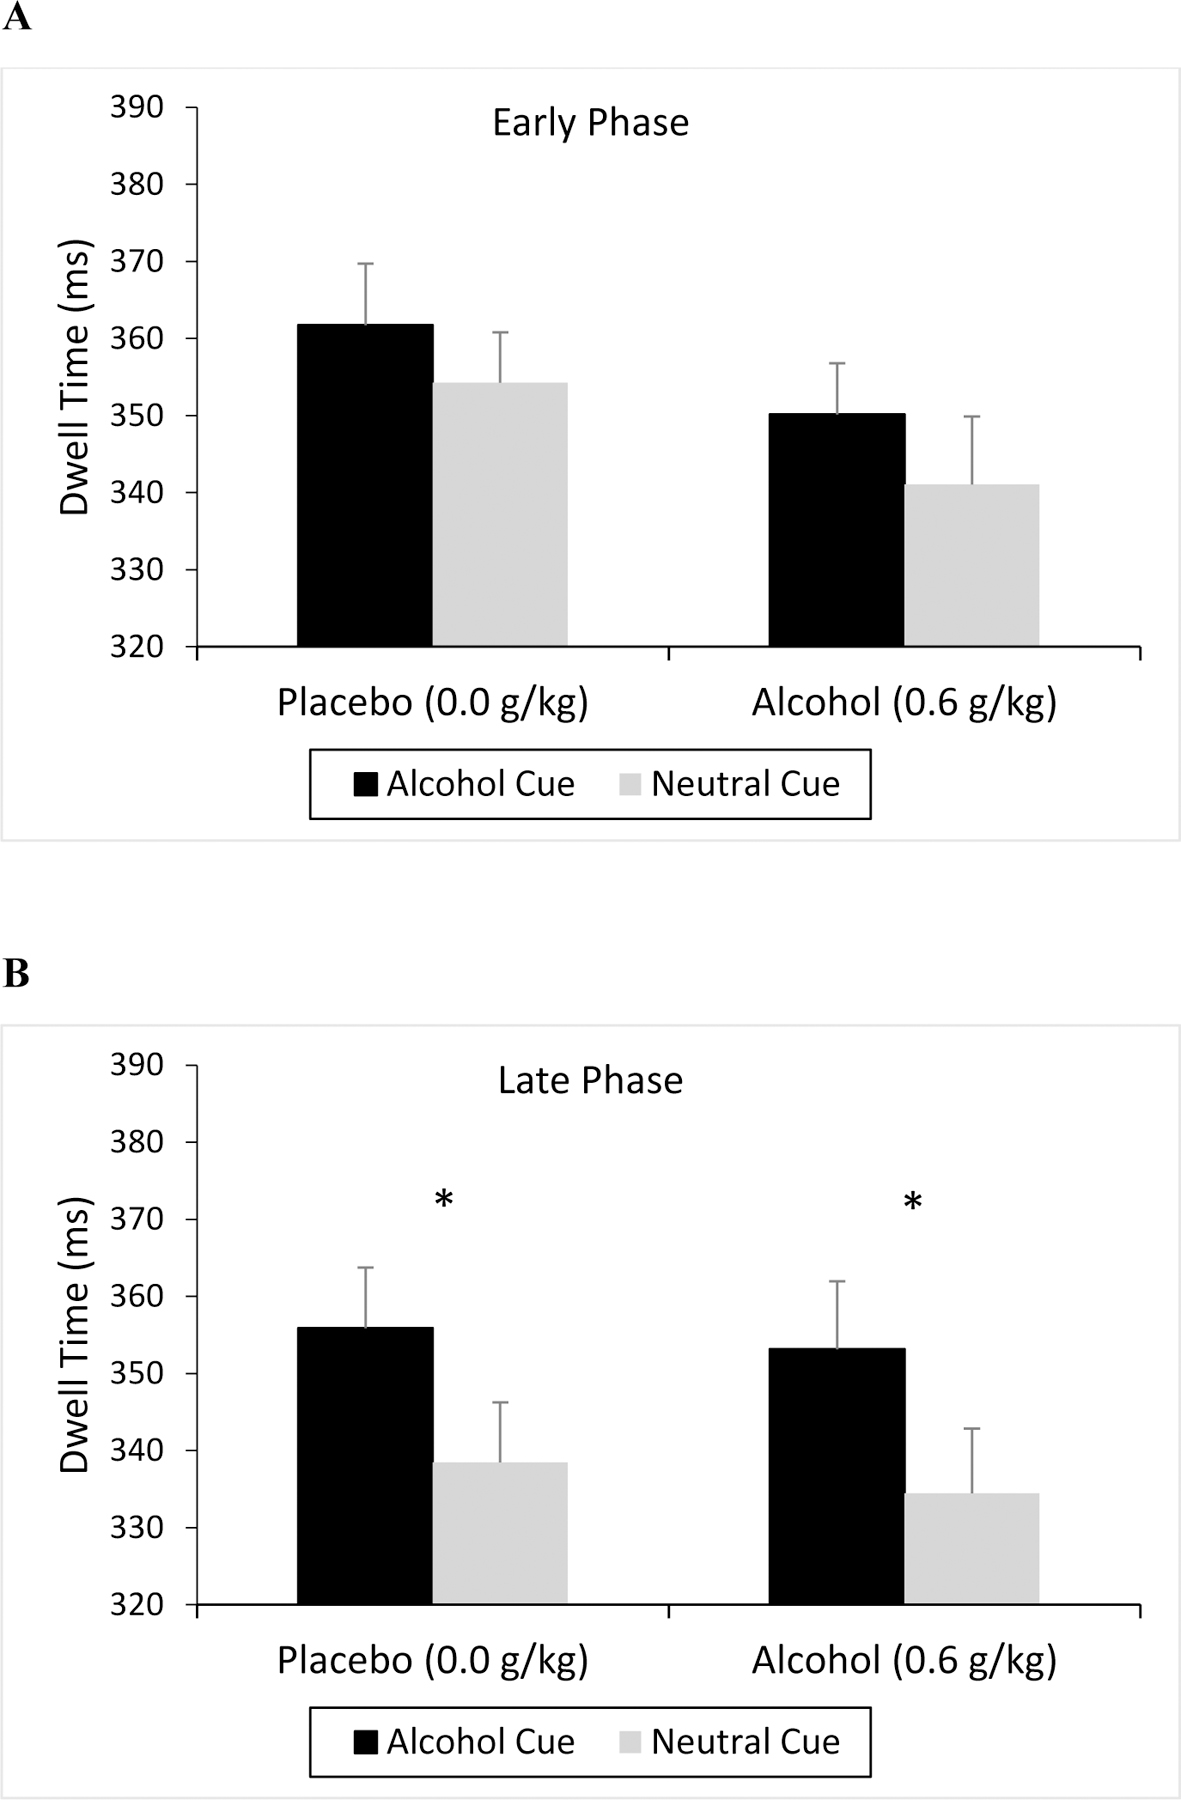
Dwell Time Toward Alcohol and Neutral Cues
Mean dwell time (ms) toward alcohol and corresponding neutral cues on the visual dot probe task under placebo and alcohol during the early (A) and late (B) follicular phases of the menstrual cycle. Vertical capped lines indicate standard error of the mean; * indicates p < 0.05.
Liquor/Wine Dwell.
Because over two thirds (34 of 50) of the sample reported a preference for either liquor or wine as their beverage of choice, dwell data for liquor/wine cues (Figures 2a and 2b) were analyzed separately from beer cues (Figures 3a and 3b). As shown in Figures 2a and 2b, the mean dwell time for liquor/wine cues was greater than for neutral cues. This difference in dwell time between cues appeared to be much greater in the late follicular phase. Indeed, a 2 (Cue) X 2 (Dose) X (2 Phase) ANOVA obtained a significant main effect of cue, F(1, 49) = 9.80, p = 0.003, ηp2 = 0.17, and a cue X phase interaction, F(1, 49) = 5.07, p = 0.029, ηp2 = 0.09. Figures 2a and 2b illustrate the interaction. Simple effect t test comparisons demonstrated that the interaction was driven by significantly greater dwell to liquor/wine versus neutral cues following placebo and alcohol during the late phase, ps < 0.035, but neither dose in the early phase, ps > 0.195. This finding supports the hypothesis that greater attentional bias to alcohol would be observed during the late versus early phase. No other significant main effects or interactions were observed, ps > 0.061. Figures 2a and 2b show similar magnitudes of attentional bias following placebo and alcohol.
Figure 2.

Dwell Time Toward Liquor/Wine and Neutral Cues
Mean dwell time (ms) toward liquor/wine and corresponding neutral cues on the visual dot probe task under placebo and alcohol during the early (A) and late (B) follicular phases of the menstrual cycle. Vertical capped lines indicate standard error of the mean; * indicates p < 0.05.
Figure 3.
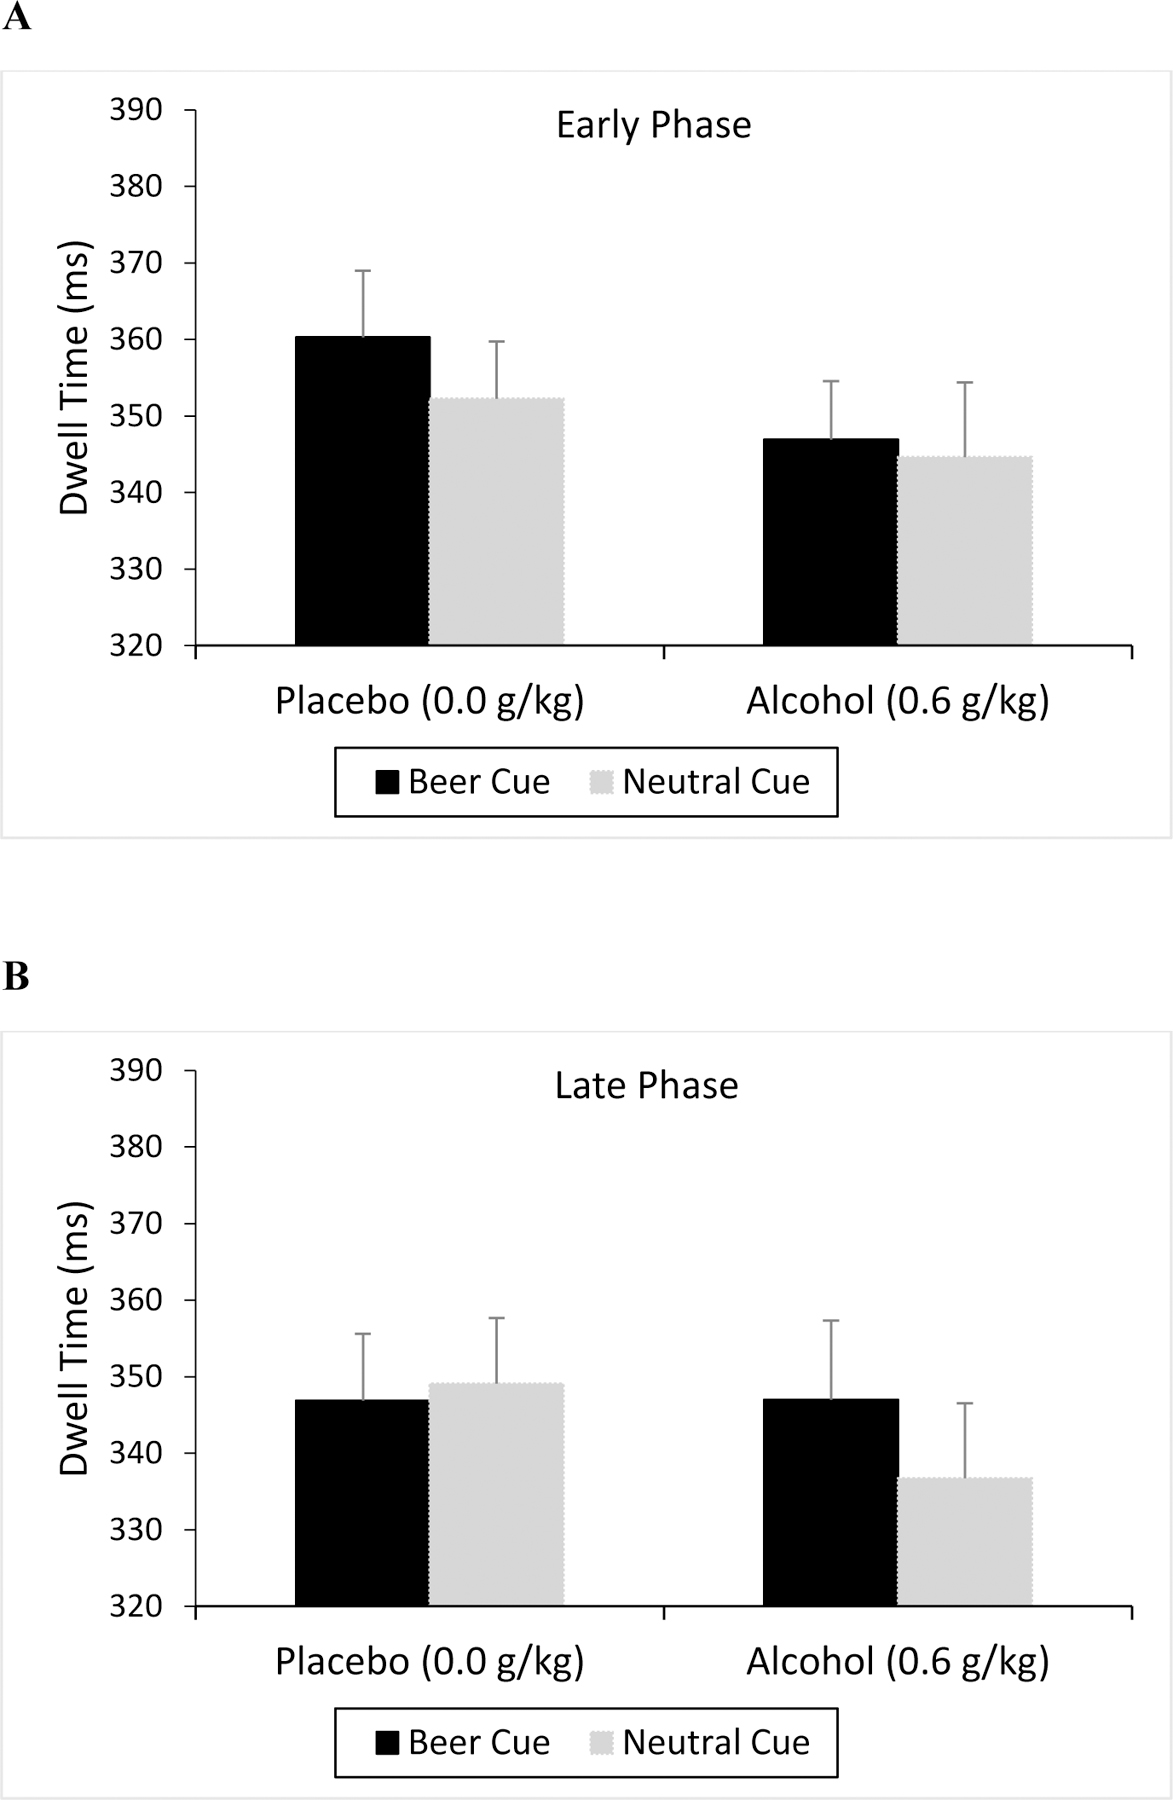
Dwell Time Toward Beer and Neutral Cues
Mean dwell time (ms) toward beer and corresponding neutral cues on the visual dot probe task under placebo and alcohol during the early (A) and late (B) follicular phases of the menstrual cycle. Vertical capped lines indicate standard error of the mean.
Beer Dwell.
Dwell time to beer and neutral cues is shown in Figures 3a and 3b. In general, dwell time was diminished following alcohol relative to placebo, but no other consistent differences were observed across cue and phase. Indeed, a 2 (Cue) X 2 (Dose) X 2 (Phase) ANOVA revealed only a significant main effect of dose, F(1, 49) = 4.47, p = 0.040, ηp2 = 0.08. No other significant main effects or interactions were observed, ps > 0.162.
Reaction Time.
Figures 4a and 4b show the reaction time to alcohol and neutral cues on the visual dot probe task. Lower reaction time values indicate a faster response and thus greater attentional bias. One case was excluded due to missing data. As seen in the figures, participants showed attentional bias to alcohol as demonstrated by their faster reaction time to alcohol cues versus neutral cues. A 2 (Cue) x 2 (Dose) x 2 (Phase) ANOVA obtained a significant main effect of cue, F(1, 48) = 4.90, p = 0.032, ηp2 = 0.09. The figures also show that participants had slower reaction times to both alcohol and neutral cues following alcohol administration relative to placebo, and this was evident in both the early and the late follicular phase. This observation was confirmed by a significant main effect of dose, F(1, 48) = 23.16, p < 0.001, ηp2 = 0.33. No significant main effect of phase, F(1, 48) = 2.10, p = 0.154, or interactions were observed, ps > 0.361.
Figure 4.

Reaction Time to Alcohol and Neutral Cues
Mean reaction time (ms) in response to visual probes following alcohol and corresponding neutral cues on the visual dot probe task under placebo and alcohol during the early (A) and late (B) follicular phases of the menstrual cycle. Vertical capped lines indicate standard error of the mean.
Subjective Effects
Table 2 shows the mean ratings throughout both sessions for each subjective effect: “intoxication,” “like,” “desire,” and “stimulation”. Due to a coding error, eight out of 1,100 ratings were lost; to determine values for these lost ratings, values of ratings completed immediately before and after each lost rating were averaged. A common pattern emerged across the subjective effects, with higher ratings following alcohol relative to placebo. Following alcohol, ratings generally increased and then declined over time as a function of the rise and descent of participants’ BAC during the session. To determine whether subjective ratings were greater under alcohol compared to placebo, paired t test comparisons were conducted for each subjective effect under placebo and 50 mins following alcohol consumption during both phases. These times are temporally coincident with completion of the visual dot probe task. The tests revealed a significantly higher rating under alcohol during both phases for ratings of “intoxication,” “like,” and “stimulation,” ps < 0.001, but no significant difference during either phase for ratings of “desire,” ps > 0.165. These findings are reflected in Table 2. A 9 (Time) X 2 (Phase) ANOVA of ratings completed under alcohol was conducted for each subjective effect to assess whether subjective ratings of the rewarding effects of alcohol were significantly greater during the late follicular phase. A significant main effect of time was obtained for all subjective effects, ps < 0.001, ηp2 > 0.47. No significant main effect of phase or phase X time interaction was observed for any item, ps > 0.143.
Discussion
This study tested the hypothesis that menstrual cycle phase can alter the rewarding properties of alcohol and alcohol-associated cues in premenopausal women. Results showed that in general, women exhibited significantly greater attentional bias to alcohol cues relative to neutral cues, suggesting that the alcohol cues possess a greater incentive salience. This attentional bias toward alcohol cues was apparent in both dwell and reaction time data from the visual dot probe task, demonstrating convergent validity to both measures of attentional bias. Analyses of dwell data also revealed that women’s attentional bias was most pronounced to liquor/wine cues compared with beer cues. Furthermore, women displayed greater attentional bias to the liquor/wine cues during the late compared with the early follicular phase, indicating an increase in the rewarding properties of the liquor/wine cues as a function of phase and perhaps more specifically an increase in E2 level. Salivary hormone data did confirm that E2 levels, as well as P4 and LH levels, were significantly higher during the late follicular compared with the early follicular test session. These findings support the original hypothesis that women would have greater attentional bias to alcohol-associated cues during the late follicular phase, perhaps increasing the abuse potential of alcohol during this phase. These results cannot be explained by phase or hormonal effects on the women’s BAC as cycle phase had no significant effect on BAC.
The observation that women displayed pronounced attentional bias to liquor/wine cues, but not beer cues, is an important and novel finding from the present study. Of the 50 participants in this study, only 16 reported a preference for consuming beer, whereas the remaining 34 preferred either liquor or wine. The visual dot probe task is meant to assess which cues participants find rewarding. Given the vast preference for liquor and wine among the sample, the significant main effect of cue for liquor/wine but not beer images for dwell data would seem to suggest that participants do indeed find their drinks of choice more rewarding than other alcoholic beverages, rather than being indiscriminate in their preference for alcohol. Women tend not to prefer beer (Klatsky et al., 1990), so it is quite possible that these data are representative of trends in attentional bias towards alcohol among women generally. This is the first study to report and possibly assess differential preferences towards various alcohol cue types (Maurage et al., 2020); further research is needed to better characterize the efficacy of different alcohol cues in eliciting attentional bias.
Women also displayed an overall reduction in dwell time under alcohol compared with placebo regardless of cue type. This finding is consistent with observations from previous studies (Fernie et al., 2012; Miller & Fillmore, 2011; Monem & Fillmore, 2019) and is likely due to a direct impairing effect of alcohol on ocular movement, including the ability to maintain gaze fixation (Katoh, 1988; Rohrbaugh et al., 1988). Despite some ocular function impairment from alcohol at this dose, prior research has confirmed the validity of eye-tracking as an attentional bias measure even in the presence of alcohol-induced oculomotor impairment (Miller & Fillmore, 2011). Indeed, the present study showed significant attentional bias to alcohol cues following the active dose of alcohol despite its overall impairing (i.e., reducing) effect on dwell time.
Regarding the subjective effects of alcohol, no significant phase effects were observed for any of the subjective measures, which contrasts with the demonstrated phase effects on attentional bias as well as the initial hypothesis. However, ratings of “intoxication,” “like,” and “stimulation” were significantly higher under alcohol compared to placebo during both phases, indicating that participants were sensitive to increases in the rewarding properties of alcohol compared to the sober state. In addition, a significant main effect of time was observed for each measure, demonstrating that participants were sensitive to changes in the acute rewarding effects of alcohol as BAC diminished with alcohol metabolism.
When considering the findings from attentional bias and subjective effects measures in tandem, the data suggests that while women’s experience of the acute rewarding effects of alcohol appears to be consistent across cycle phase, women have exhibited greater anticipatory reward from alcohol-related cues during the late follicular phase compared to the early phase. Given that several studies have demonstrated a significant positive relationship between attentional bias in the lab and chronic alcohol consumption levels (Fadardi & Cox, 2009; Field et al., 2004; Monem & Fillmore, 2017; Townshend & Duka, 2001; Weafer & Fillmore, 2013), the current evidence suggests that women may be at a greater risk of engaging in hazardous drinking during the late follicular phase due to their display of heighted attentional bias.
Interestingly, prior research has shown that among drinkers with heightened attentional bias, greater disinhibition is associated with heavier drinking (Roberts et al., 2014). Women exhibit elevated disinhibition under alcohol during the late follicular phase of the menstrual cycle (Griffith et al., 2022); this finding, in tandem with the present data demonstrating heightened attentional bias during the late phase, further suggests that women are more likely to engage in heavy drinking during the late follicular phase. Specifically, elevated attentional bias could make women more likely to initiate a drinking episode in the late follicular phase. Once the drinking episode has begun, continued attentional bias to alcohol cues and the onset of alcohol-induced disinhibition could increase women’s likelihood of binge drinking, ultimately increasing their risk of long-term negative outcomes from heavy drinking.
These risks may be especially relevant to women seeking to limit or abstain from alcohol consumption. In pursuit of generalizability, as well as ethical considerations surrounding the administration of alcohol to heavy drinkers, only social drinkers were recruited. However, findings from the present study suggest that women with an AUD could be at a greater risk of exceeding their consumption limits or relapsing when E2 is elevated during the late follicular phase, which is an important consideration for treatment efficacy. Compounding this concern, women may not be aware of an increased risk during a particular phase of their cycle, as evidenced by the lack of a phase effect on their explicit ratings of the rewarding effects they experienced from alcohol.
To our knowledge, this is the first study to systematically assess the effects of menstrual cycle phase and ovarian hormone levels on the acute rewarding properties of a controlled dose of alcohol in women. This study highlights the potential role of cycle phase and possibly E2 in sensitizing women to the rewarding properties of alcohol-related cues during a critical phase of the menstrual cycle. Previous pre-clinical and clinical research has demonstrated that higher E2 levels are associated with greater alcohol consumption (Erol et al., 2019; Lancaster et al., 1996; Martel et al., 2017; Martin et al., 1999; Muti et al., 1998; Roberts et al., 1998). This relationship was thought to be facilitated by an E2-induced enhancement of the rewarding properties of alcohol, mediated through dopamine, GABA, and glutamate, which in turn promoted a desire to drink. However, this proposed mechanism remained untested. The present findings support elevated rewarding properties of alcohol-related “anticipatory” cues for drinking as a possible mechanism underlying the relationship between E2 and alcohol consumption. Of course, it is worth noting that the ovarian hormones P4 and LH fluctuate throughout the menstrual cycle as well. Further research into their relationship with alcohol consumption and the rewarding effects of alcohol and its associated cues is needed. Additionally, further research is needed to assess how individual variations in E2, and possibly P4 and LH, may be indicative of the degree of the rewarding properties of alcohol and its cues.
The exclusive participation of women whose menstrual cycles were unaffected by contraceptives is another important limitation concerning generalizability. About one quarter (26.1%) of women ages 15–49 use hormonal contraceptives (Daniels & Abma, 2018). However, the proportion of women who use hormonal contraceptives likely varies with age and may be greater among younger adult women who fit the age demographic of the present study (21–29). Thus, studies involving women who use contraceptives are of vital importance as this demographic represents a substantial component of the population, and variations in sensitivity to the rewarding properties of alcohol could be significantly impacted by hormonal contraception.
The present study focused specifically on the rewarding properties of alcohol and its cues in women, which is important to our understanding of how alcohol affects women and contributes to their unique risks for engaging in hazardous drinking. However, further research is necessary to expand our understanding, including studies on the rewarding properties of alcohol among women on contraceptives, as well as research on sex differences in the incentive salience of alcohol.
Public Health Significance:
The findings of this study demonstrate that around ovulation, women find cues associated with alcohol more rewarding. This enhanced reward can lead to increased alcohol consumption. Thus, women may be at a greater risk for excessive alcohol use during the late follicular phase of the menstrual cycle around ovulation.
Acknowledgments
This research was supported by the NIAAA grants R01AA027990 and T32 AA027488. This funding source has no role other than financial support. Some data in this manuscript has been presented at the University of Kentucky Substance Use Research Event. The study is registered as a phase one clinical trial in clinicaltrials.gov NCT04595682. Deidentified study data will be submitted to the National Institute of Mental Health Data Archive (NDA) for all subjects who consent to have their data shared. Researchers can submit a request to access the data saved in the NDA database under Collection ID #3664.
Footnotes
The authors report no conflicts of interest.
References
- Anker JJ, & Carroll ME (2011). Females are more vulnerable to drug abuse than males: evidence from preclinical studies and the role of ovarian hormones. Curr Top Behav Neurosci, 8, 73–96. 10.1007/7854_2010_93 [DOI] [PubMed] [Google Scholar]
- Barth C, Villringer A, & Sacher J (2015). Sex hormones affect neurotransmitters and shape the adult female brain during hormonal transition periods. Front Neurosci, 9, 37. 10.3389/fnins.2015.00037 [DOI] [PMC free article] [PubMed] [Google Scholar]
- Cox WM, Hogan LM, Kristian MR, & Race JH (2002). Alcohol attentional bias as a predictor of alcohol abusers’ treatment outcome. Drug Alcohol Depend, 68(3), 237–243. 10.1016/s0376-8716(02)00219-3 [DOI] [PubMed] [Google Scholar]
- Daniels K, & Abma JC (2018). Current Contraceptive Status Among Women Aged 15–49: United States, 2015 – 2017. Centers for Disease Control and Prevention
- de Wit H, & Griffiths RR (1991). Testing the abuse liability of anxiolytic and hypnotic drugs in humans. Drug Alcohol Depend, 28(1), 83–111. 10.1016/0376-8716(91)90054-3 [DOI] [PubMed] [Google Scholar]
- deWit H (1996). Priming effects with drugs and other reinforcers. Experimental and Clinical Psychopharmacology, 4(1), 5–10. 10.1037/1064-1297.4.1.5 [DOI] [Google Scholar]
- Di Chiara G (1997). Alcohol and dopamine. Alcohol Health Res World, 21(2), 108–114. https://www.ncbi.nlm.nih.gov/pubmed/15704345 [PMC free article] [PubMed] [Google Scholar]
- Duka T, & Townshend JM (2004). The priming effect of alcohol pre-load on attentional bias to alcohol-related stimuli. Psychopharmacology (Berl), 176(3–4), 353–361. 10.1007/s00213-004-1906-7 [DOI] [PubMed] [Google Scholar]
- Erol A, Ho AM, Winham SJ, & Karpyak VM (2019). Sex hormones in alcohol consumption: a systematic review of evidence. Addict Biol, 24(2), 157–169. 10.1111/adb.12589 [DOI] [PMC free article] [PubMed] [Google Scholar]
- Fadardi JS, & Cox WM (2009). Reversing the sequence: reducing alcohol consumption by overcoming alcohol attentional bias. Drug Alcohol Depend, 101(3), 137–145. 10.1016/j.drugalcdep.2008.11.015 [DOI] [PubMed] [Google Scholar]
- Fernie G, Christiansen P, Cole JC, Rose AK, & Field M (2012). Effects of 0.4 g/kg alcohol on attentional bias and alcohol-seeking behaviour in heavy and moderate social drinkers. J Psychopharmacol, 26(7), 1017–1025. 10.1177/0269881111434621 [DOI] [PubMed] [Google Scholar]
- Field M, & Cox WM (2008). Attentional bias in addictive behaviors: a review of its development, causes, and consequences. Drug Alcohol Depend, 97(1–2), 1–20. 10.1016/j.drugalcdep.2008.03.030 [DOI] [PubMed] [Google Scholar]
- Field M, Mogg K, Zetteler J, & Bradley BP (2004). Attentional biases for alcohol cues in heavy and light social drinkers: the roles of initial orienting and maintained attention. Psychopharmacology (Berl), 176(1), 88–93. 10.1007/s00213-004-1855-1 [DOI] [PubMed] [Google Scholar]
- Fillmore MT, Carscadden JL, & Vogel-Sprott M (1998). Alcohol, cognitive impairment and expectancies. Journal of Studies on Alcohol, 59(2), 174–179. 10.15288/jsa.1998.59.174 [DOI] [PubMed] [Google Scholar]
- Fillmore MT, & Jude R (2011). Defining “binge” drinking as five drinks per occasion or drinking to a .08% BAC: which is more sensitive to risk? Am J Addict, 20(5), 468–475. 10.1111/j.1521-0391.2011.00156.x [DOI] [PMC free article] [PubMed] [Google Scholar]
- Fillmore MT, & Vogel-Sprott M (1998). Behavioral impairment under alcohol: cognitive and pharmacokinetic factors. Alcohol Clin Exp Res, 22(7), 1476–1482. https://www.ncbi.nlm.nih.gov/pubmed/9802531 [PubMed] [Google Scholar]
- Fischman MW, & Foltin RW (1991). Utility of subjective-effects measurements in assessing abuse liability of drugs in humans. Br J Addict, 86(12), 1563–1570. 10.1111/j.1360-0443.1991.tb01749.x [DOI] [PubMed] [Google Scholar]
- Ford MM, Eldridge JC, & Samson HH (2002). Ethanol consumption in the female Long-Evans rat: a modulatory role of estradiol. Alcohol, 26(2), 103–113. 10.1016/s0741-8329(01)00203-8 [DOI] [PubMed] [Google Scholar]
- Ford MM, Eldridge JC, & Samson HH (2004). Determination of an estradiol dose-response relationship in the modulation of ethanol intake. Alcohol Clin Exp Res, 28(1), 20–28. 10.1097/01.ALC.0000108647.62718.5A [DOI] [PubMed] [Google Scholar]
- Griffith AK, Martel MM, Eisenlohr-Moul T, & Fillmore MT (2022). Heightened sensitivity to the disinhibiting effect of alcohol in women during the late follicular phase of the menstrual cycle. Exp Clin Psychopharmacol 10.1037/pha0000611 [DOI] [PMC free article] [PubMed]
- Hashimoto JG, & Wiren KM (2008). Neurotoxic consequences of chronic alcohol withdrawal: expression profiling reveals importance of gender over withdrawal severity. Neuropsychopharmacology, 33(5), 1084–1096. 10.1038/sj.npp.1301494 [DOI] [PMC free article] [PubMed] [Google Scholar]
- Hudson A, & Stamp JA (2011). Ovarian hormones and propensity to drug relapse: a review. Neurosci Biobehav Rev, 35(3), 427–436. 10.1016/j.neubiorev.2010.05.001 [DOI] [PubMed] [Google Scholar]
- Katoh Z (1988). Slowing effects of alcohol on voluntary eye movements. Aviat Space Environ Med, 59(7), 606–610. https://www.ncbi.nlm.nih.gov/pubmed/3408421 [PubMed] [Google Scholar]
- Klatsky AL, Armstrong MA, & Kipp H (1990). Correlates of alcoholic beverage preference: traits of persons who choose wine, liquor or beer. Br J Addict, 85(10), 1279–1289. 10.1111/j.1360-0443.1990.tb01604.x [DOI] [PubMed] [Google Scholar]
- Lancaster FE, Brown TD, Coker KL, Elliott JA, & Wren SB (1996). Sex differences in alcohol preference and drinking patterns emerge during the early postpubertal period. Alcohol Clin Exp Res, 20(6), 1043–1049. 10.1111/j.1530-0277.1996.tb01945.x [DOI] [PubMed] [Google Scholar]
- Martel MM, Eisenlohr-Moul T, & Roberts B (2017). Interactive effects of ovarian steroid hormones on alcohol use and binge drinking across the menstrual cycle. J Abnorm Psychol, 126(8), 1104–1113. 10.1037/abn0000304 [DOI] [PMC free article] [PubMed] [Google Scholar]
- Martin CA, Mainous AG 3rd, Curry T, & Martin D (1999). Alcohol use in adolescent females: correlates with estradiol and testosterone. Am J Addict, 8(1), 9–14. 10.1080/105504999306036 [DOI] [PubMed] [Google Scholar]
- Martin CS, Earleywine M, Musty RE, Perrine MW, & Swift RM (1993). Development and Validation of the Biphasic Alcohol Effects Scale. Alcoholism-Clinical and Experimental Research, 17(1), 140–146. 10.1111/j.1530-0277.1993.tb00739.x [DOI] [PubMed] [Google Scholar]
- Maurage P, Masson N, Bollen Z, & D’Hondt F (2020). Eye tracking correlates of acute alcohol consumption: A systematic and critical review. Neurosci Biobehav Rev, 108, 400–422. 10.1016/j.neubiorev.2019.10.001 [DOI] [PubMed] [Google Scholar]
- Miller MA, & Fillmore MT (2011). Persistence of attentional bias toward alcohol-related stimuli in intoxicated social drinkers. Drug Alcohol Depend, 117(2–3), 184–189. 10.1016/j.drugalcdep.2011.01.016 [DOI] [PubMed] [Google Scholar]
- Miller MA, Weafer J, & Fillmore MT (2009). Gender differences in alcohol impairment of simulated driving performance and driving-related skills. Alcohol Alcohol, 44(6), 586–593. 10.1093/alcalc/agp051 [DOI] [PMC free article] [PubMed] [Google Scholar]
- Monem R, & Fillmore MT (2019). Alcohol administration reduces attentional bias to alcohol-related but not food-related cues: Evidence for a satiety hypothesis. Psychol Addict Behav, 33(8), 677–684. 10.1037/adb0000522 [DOI] [PMC free article] [PubMed] [Google Scholar]
- Monem RG, & Fillmore MT (2017). Measuring heightened attention to alcohol in a naturalistic setting: A validation study. Exp Clin Psychopharmacol, 25(6), 496–502. 10.1037/pha0000157 [DOI] [PMC free article] [PubMed] [Google Scholar]
- Mumenthaler MS, Taylor JL, O’Hara R, & Yesavage JA (1999). Gender differences in moderate drinking effects. Alcohol Res Health, 23(1), 55–64. https://www.ncbi.nlm.nih.gov/pubmed/10890798 [PMC free article] [PubMed] [Google Scholar]
- Muti P, Trevisan M, Micheli A, Krogh V, Bolelli G, Sciajno R, Schunemann HJ, & Berrino F (1998). Alcohol consumption and total estradiol in premenopausal women. Cancer Epidemiol Biomarkers Prev, 7(3), 189–193. https://www.ncbi.nlm.nih.gov/pubmed/9521430 [PubMed] [Google Scholar]
- Nolen-Hoeksema S (2004). Gender differences in risk factors and consequences for alcohol use and problems. Clin Psychol Rev, 24(8), 981–1010. 10.1016/j.cpr.2004.08.003 [DOI] [PubMed] [Google Scholar]
- Portans I, White JM, & Staiger PK (1989). Acute tolerance to alcohol: changes in subjective effects among social drinkers. Psychopharmacology (Berl), 97(3), 365–369. 10.1007/BF00439452 [DOI] [PubMed] [Google Scholar]
- Reichman ME, Judd JT, Longcope C, Schatzkin A, Clevidence BA, Nair PP, Campbell WS, & Taylor PR (1993). Effects of alcohol consumption on plasma and urinary hormone concentrations in premenopausal women. J Natl Cancer Inst, 85(9), 722–727. 10.1093/jnci/85.9.722 [DOI] [PubMed] [Google Scholar]
- Roberts AJ, Smith AD, Weiss F, Rivier C, & Koob GF (1998). Estrous cycle effects on operant responding for ethanol in female rats. Alcohol Clin Exp Res, 22(7), 1564–1569. https://www.ncbi.nlm.nih.gov/pubmed/9802543 [PubMed] [Google Scholar]
- Roberts W, & Fillmore MT (2015). Attentional bias to alcohol-related stimuli as an indicator of changes in motivation to drink. Psychol Addict Behav, 29(1), 63–70. 10.1037/adb0000005 [DOI] [PMC free article] [PubMed] [Google Scholar]
- Roberts W, Miller MA, Weafer J, & Fillmore MT (2014). Heavy drinking and the role of inhibitory control of attention. Exp Clin Psychopharmacol, 22(2), 133–140. 10.1037/a0035317 [DOI] [PMC free article] [PubMed] [Google Scholar]
- Robinson TE, & Berridge KC (1993). The neural basis of drug craving: an incentive-sensitization theory of addiction. Brain Res Brain Res Rev, 18(3), 247–291. 10.1016/0165-0173(93)90013-p [DOI] [PubMed] [Google Scholar]
- Rohrbaugh JW, Stapleton JM, Parasuraman R, Frowein HW, Adinoff B, Varner JL, Zubovic EA, Lane EA, Eckardt MJ, & Linnoila M (1988). Alcohol intoxication reduces visual sustained attention. Psychopharmacology (Berl), 96(4), 442–446. 10.1007/BF02180021 [DOI] [PubMed] [Google Scholar]
- Ryan F (2002). Detected, selected, and sometimes neglected: cognitive processing of cues in addiction. Exp Clin Psychopharmacol, 10(2), 67–76. 10.1037//1064-1297.10.2.67 [DOI] [PubMed] [Google Scholar]
- Satta R, Hilderbrand ER, & Lasek AW (2018). Ovarian Hormones Contribute to High Levels of Binge-Like Drinking by Female Mice. Alcohol Clin Exp Res, 42(2), 286–294. 10.1111/acer.13571 [DOI] [PMC free article] [PubMed] [Google Scholar]
- Schoenmakers T, Wiers RW, & Field M (2008). Effects of a low dose of alcohol on cognitive biases and craving in heavy drinkers. Psychopharmacology (Berl), 197(1), 169–178. 10.1007/s00213-007-1023-5 [DOI] [PMC free article] [PubMed] [Google Scholar]
- Sobell LC, & Sobell MB (1992). Timeline follow-back. In Measuring alcohol consumption (pp. 41–72). Humana Press. [Google Scholar]
- Stillwell W (2016). Bioactive Lipids. In An Introduction to Biological Membranes (pp. 453–478). Elsevier. [Google Scholar]
- Townshend JM, & Duka T (2001). Attentional bias associated with alcohol cues: differences between heavy and occasional social drinkers. Psychopharmacology (Berl), 157(1), 67–74. 10.1007/s002130100764 [DOI] [PubMed] [Google Scholar]
- Trantham-Davidson H, & Chandler LJ (2015). Alcohol-induced alterations in dopamine modulation of prefrontal activity. Alcohol, 49(8), 773–779. 10.1016/j.alcohol.2015.09.001 [DOI] [PMC free article] [PubMed] [Google Scholar]
- Weafer J, & Fillmore MT (2013). Acute alcohol effects on attentional bias in heavy and moderate drinkers. Psychol Addict Behav, 27(1), 32–41. 10.1037/a0028991 [DOI] [PMC free article] [PubMed] [Google Scholar]
- Weafer J, Miller MA, & Fillmore MT (2010). Response conflict as an environmental determinant of gender differences in sensitivity to alcohol impairment. Curr Drug Abuse Rev, 3(3), 147–155. 10.2174/1874473711003030147 [DOI] [PubMed] [Google Scholar]
- White A, Castle IJ, Chen CM, Shirley M, Roach D, & Hingson R (2015). Converging Patterns of Alcohol Use and Related Outcomes Among Females and Males in the United States, 2002 to 2012. Alcohol Clin Exp Res, 39(9), 1712–1726. 10.1111/acer.12815 [DOI] [PubMed] [Google Scholar]
- Wiers RW, Rinck M, Kordts R, Houben K, & Strack F (2010). Retraining automatic action-tendencies to approach alcohol in hazardous drinkers. Addiction, 105(2), 279–287. 10.1111/j.1360-0443.2009.02775.x [DOI] [PubMed] [Google Scholar]
- Wilhelm CJ, Hashimoto JG, Roberts ML, Bloom SH, Andrew MR, & Wiren KM (2016). Astrocyte Dysfunction Induced by Alcohol in Females but Not Males. Brain Pathol, 26(4), 433–451. 10.1111/bpa.12276 [DOI] [PMC free article] [PubMed] [Google Scholar]
- Witt ED (2007). Puberty, hormones, and sex differences in alcohol abuse and dependence. Neurotoxicol Teratol, 29(1), 81–95. 10.1016/j.ntt.2006.10.013 [DOI] [PubMed] [Google Scholar]
- Yoest KE, Cummings JA, & Becker JB (2014). Estradiol, dopamine and motivation. Cent Nerv Syst Agents Med Chem, 14(2), 83–89. 10.2174/1871524914666141226103135 [DOI] [PMC free article] [PubMed] [Google Scholar]