

Abstract
Background:
Schizophrenia research reveals sex differences in incidence, symptoms, genetic risk factors, and brain function. However, a knowledge gap remains regarding sex-specific schizophrenia alterations in brain function. Schizophrenia is considered a dysconnectivity syndrome, but the dynamic integration and segregation of brain networks are poorly understood. Recent advances in resting-state fMRI allow us to study spatial dynamics, the phenomenon of brain networks spatially evolving over time. Nevertheless, estimating time-resolved networks remains challenging due to low signal-to-noise, limited short-time information, and uncertain network identification.
Methods:
We adapt a reference-informed network estimation technique to capture time-resolved networks and their dynamic spatial integration and segregation for 315 controls and 193 schizophrenia individuals. We focus on time-resolved spatial functional network connectivity (spFNC), an estimate of network spatial coupling, to study sex-specific alterations in schizophrenia and their links to genomic data.
Results:
Our findings are consistent with the dysconnectivity and neurodevelopment hypotheses and align with the cerebello-thalamo-cortical, triple-network, and frontoparietal dysconnectivity models, helping to unify them. The potential unification offers a new understanding of the underlying mechanisms. Notably, the posterior default mode/salience spFNC exhibits sex-specific schizophrenia alteration during the state with the highest global network integration and correlates with schizophrenia genetic risk. This dysfunction is reflected in regions with weak functional connectivity to corresponding networks.
Conclusions:
Our method can effectively capture spatially dynamic networks, detect nuanced schizophrenia effects including sex-specific ones, and reveal the intricate relationship of dynamic information to genomic data. The results also underscore the clinical potential of dynamic spatial dependence and weak connectivity.
Keywords: Spatial Dynamics, Spatially Dynamic Covariance, Time-Resolved Referenced-Informed Network Estimation Techniques, Schizophrenia (SZ), Sex Differences, Polygenic Risk Score, Single Nucleotide Polymorphism (SNP)
Schizophrenia, Sex-Specific Differences, and the Brain
Schizophrenia is a complex neuropsychiatric disorder that significantly burdens society (1) and presents a wide array of symptoms, including hallucinations, delusions, disorganized speech and behavior, and cognitive impairments (2, 3). Understanding the underlying neurobiological mechanisms of schizophrenia is imperative for developing effective interventions and treatments, with sex being an important factor influencing outcomes and strategies. Notably, research has elucidated sex/gender differences in the incidence and clinical manifestation of mental disorders (4, 5). Females with schizophrenia tend to exhibit more depressive symptoms, whereas males often experience more negative symptoms (6, 7). Sex differences have also been identified in cognitive tasks (8), genetics (9), and neurobiology (10, 11). Previous findings support the notion that autosomal genes interact with sex, influencing the risk for schizophrenia (9, 12–14). Moreover, polygenic risk scores for schizophrenia are negatively correlated with cognitive performance in males exclusively (15). However, a substantial knowledge gap remains regarding sex-specific schizophrenia alterations in brain function and their link to schizophrenia genetic risk factors.
At the brain level, schizophrenia is hypothesized as a disconnection syndrome, where disruptions in functional integrations have a greater influence on behavior and psychopathology than aberrations in single brain regions (16, 17). Thus, extensive efforts have been directed toward identifying these disruptions using resting-state functional magnetic resonance imaging (rsfMRI) to unravel the underlying neurobiology of schizophrenia (18–26). Recent research also shows sex differences in functional connectivity aberrations in schizophrenia (21). The default-mode and salience networks have been associated with negative symptoms, which are more pronounced in men with schizophrenia (8, 20, 27–30). Their functional connectivity mediates the link between sex and mental rotation (31), potentially explaining schizophrenia-by-sex interactions in the mental rotation task (8). Sex differences in functional connectivity was observed in autism spectrum disorder (32), which shares significant clinical and genetic components with schizophrenia (33).
Nonetheless, research is lacking on how brain functional units spatially integrate and segregate over time in schizophrenia and how sex-specific schizophrenia differences in brain function relate to genetic risk factors.
Spatially Dynamic Analyses in rsfMRI: Quantifying Spatial Network Coupling
The brain maintains, regulates, adapts, and responds to a rich repertoire of behavior and mental activities via the continuous reconfiguration of coordinated intrinsic activities. At a large scale, these activities are thought to manifest as a set of discrete yet interactive neuronal assemblies, commonly referred to as functional units or functional sources (34). This view has gained traction in the field of rsfMRI, where spatially fixed nodes or data-driven estimations of functional sources, e.g., functional networks (35–37) or functional parcels (38–40), have been used to model the functional interactions among functional sources. Studies often assume that functional sources remain spatially fixed throughout the scan and use average voxel time series from fixed spatial regions to estimate sources time courses and compute whole-brain static or temporally dynamic functional connectivity. However, the continuous reconfiguration of coordinated intrinsic activities can result in changes in the spatial patterns of functional units over time (i.e., spatial dynamics) (23, 34, 41–43). Consequently, relying solely on the average time series over anatomically fixed regions, which overlooks spatial dynamics, leads to suboptimal functional connectivity estimation and imprecise inferences.
In addition, spatial dynamics carry unique information hidden from existing spatially static approaches, particularly regarding the spatial coupling and uncoupling of functional units over time. Our previous work (41) has shown that brain networks can dynamically segregate and integrate in space, including the transient emergence of the cerebellar and primary visual networks within the spatial patterns of other brain networks.
Here, we leverage spatial dependence to quantify dynamic integration and segregation in brain networks, thereby enhancing our understanding of the dynamic interplay between integrative and specialized processes. We use the term spatial functional network connectivity (spFNC) to describe the spatial dependence between networks, consistent with the definition of temporal functional network connectivity, which refers to the temporal dependence between networks.
Dataset and Preprocessing
We analyzed multi-center 3-Tesla rsfMRI data (19, 44, 45). Quality control and preprocessing followed the NeuroMark protocol (36). The inclusion criteria were: (1) minimum of 100 volumes for rsfMRI data (all data exceeded 140 volumes), (2) head motion within 3° rotations and 3 mm translations in each direction, (3) mean framewise displacement (46) less than 0.25, (4) accurate registration to the template, and (5) spatial overlap exceeding 80% between individual and group masks. This resulted in 193 participants with schizophrenia and 315 matched controls (Table 1). Preprocessing steps include excluding the first five volumes, slice-timing and rigid body motion corrections, registration to an MNI template, resampling to 3 mm3 isotropic voxels, and spatial smoothing with a 6 mm full width at half maximum Gaussian kernel. Additionally, voxel time courses were detrended, despiked, motion-corrected, and filtered to reduce noise and nuisance signals (41). See the supplemental material for details regarding dataset, recruitment strategies, inclusion/exclusion criteria, demographic, and preprocessing.
Table 1.
Demographic information. E: European, A: American, O: Other.
| Diagnostic (#) | Sex (male/female) | Age (mean ± sd) | Race (E/A/O) |
|---|---|---|---|
|
| |||
| Control group (315) | 185/130 | 38.40 ± 12.73 | 192/65/58 |
| Schizophrenia group (193) | 154/39 | 38.61 ± 13.29 | 112/44/37 |
Capturing Time-Resolved Network-Specific Spatial Patterns
To effectively estimate time-resolved spFNC (tr-spFNC), we introduce a time-resolved, reference-informed network estimation approach that derives time-varying spatial maps for each network while controlling for the impact of other networks, thereby disentangling their specific contributions over time (Fig. 1). This approach also overcomes the uncertainty of post hoc matching, which can be more problematic in a time-resolved setting (37, 47). Furthermore, the combination of reference-informed and spatial-constraint mechanisms effectively addresses the challenges of low signal-to-noise ratio and limited information in short time segments. Spatial constraints restrict the search space and act as regularizers, mitigating overfitting to noise and enabling the capture of the underlying signal.
Fig. 1 |. Schematic of the Analysis Pipeline.
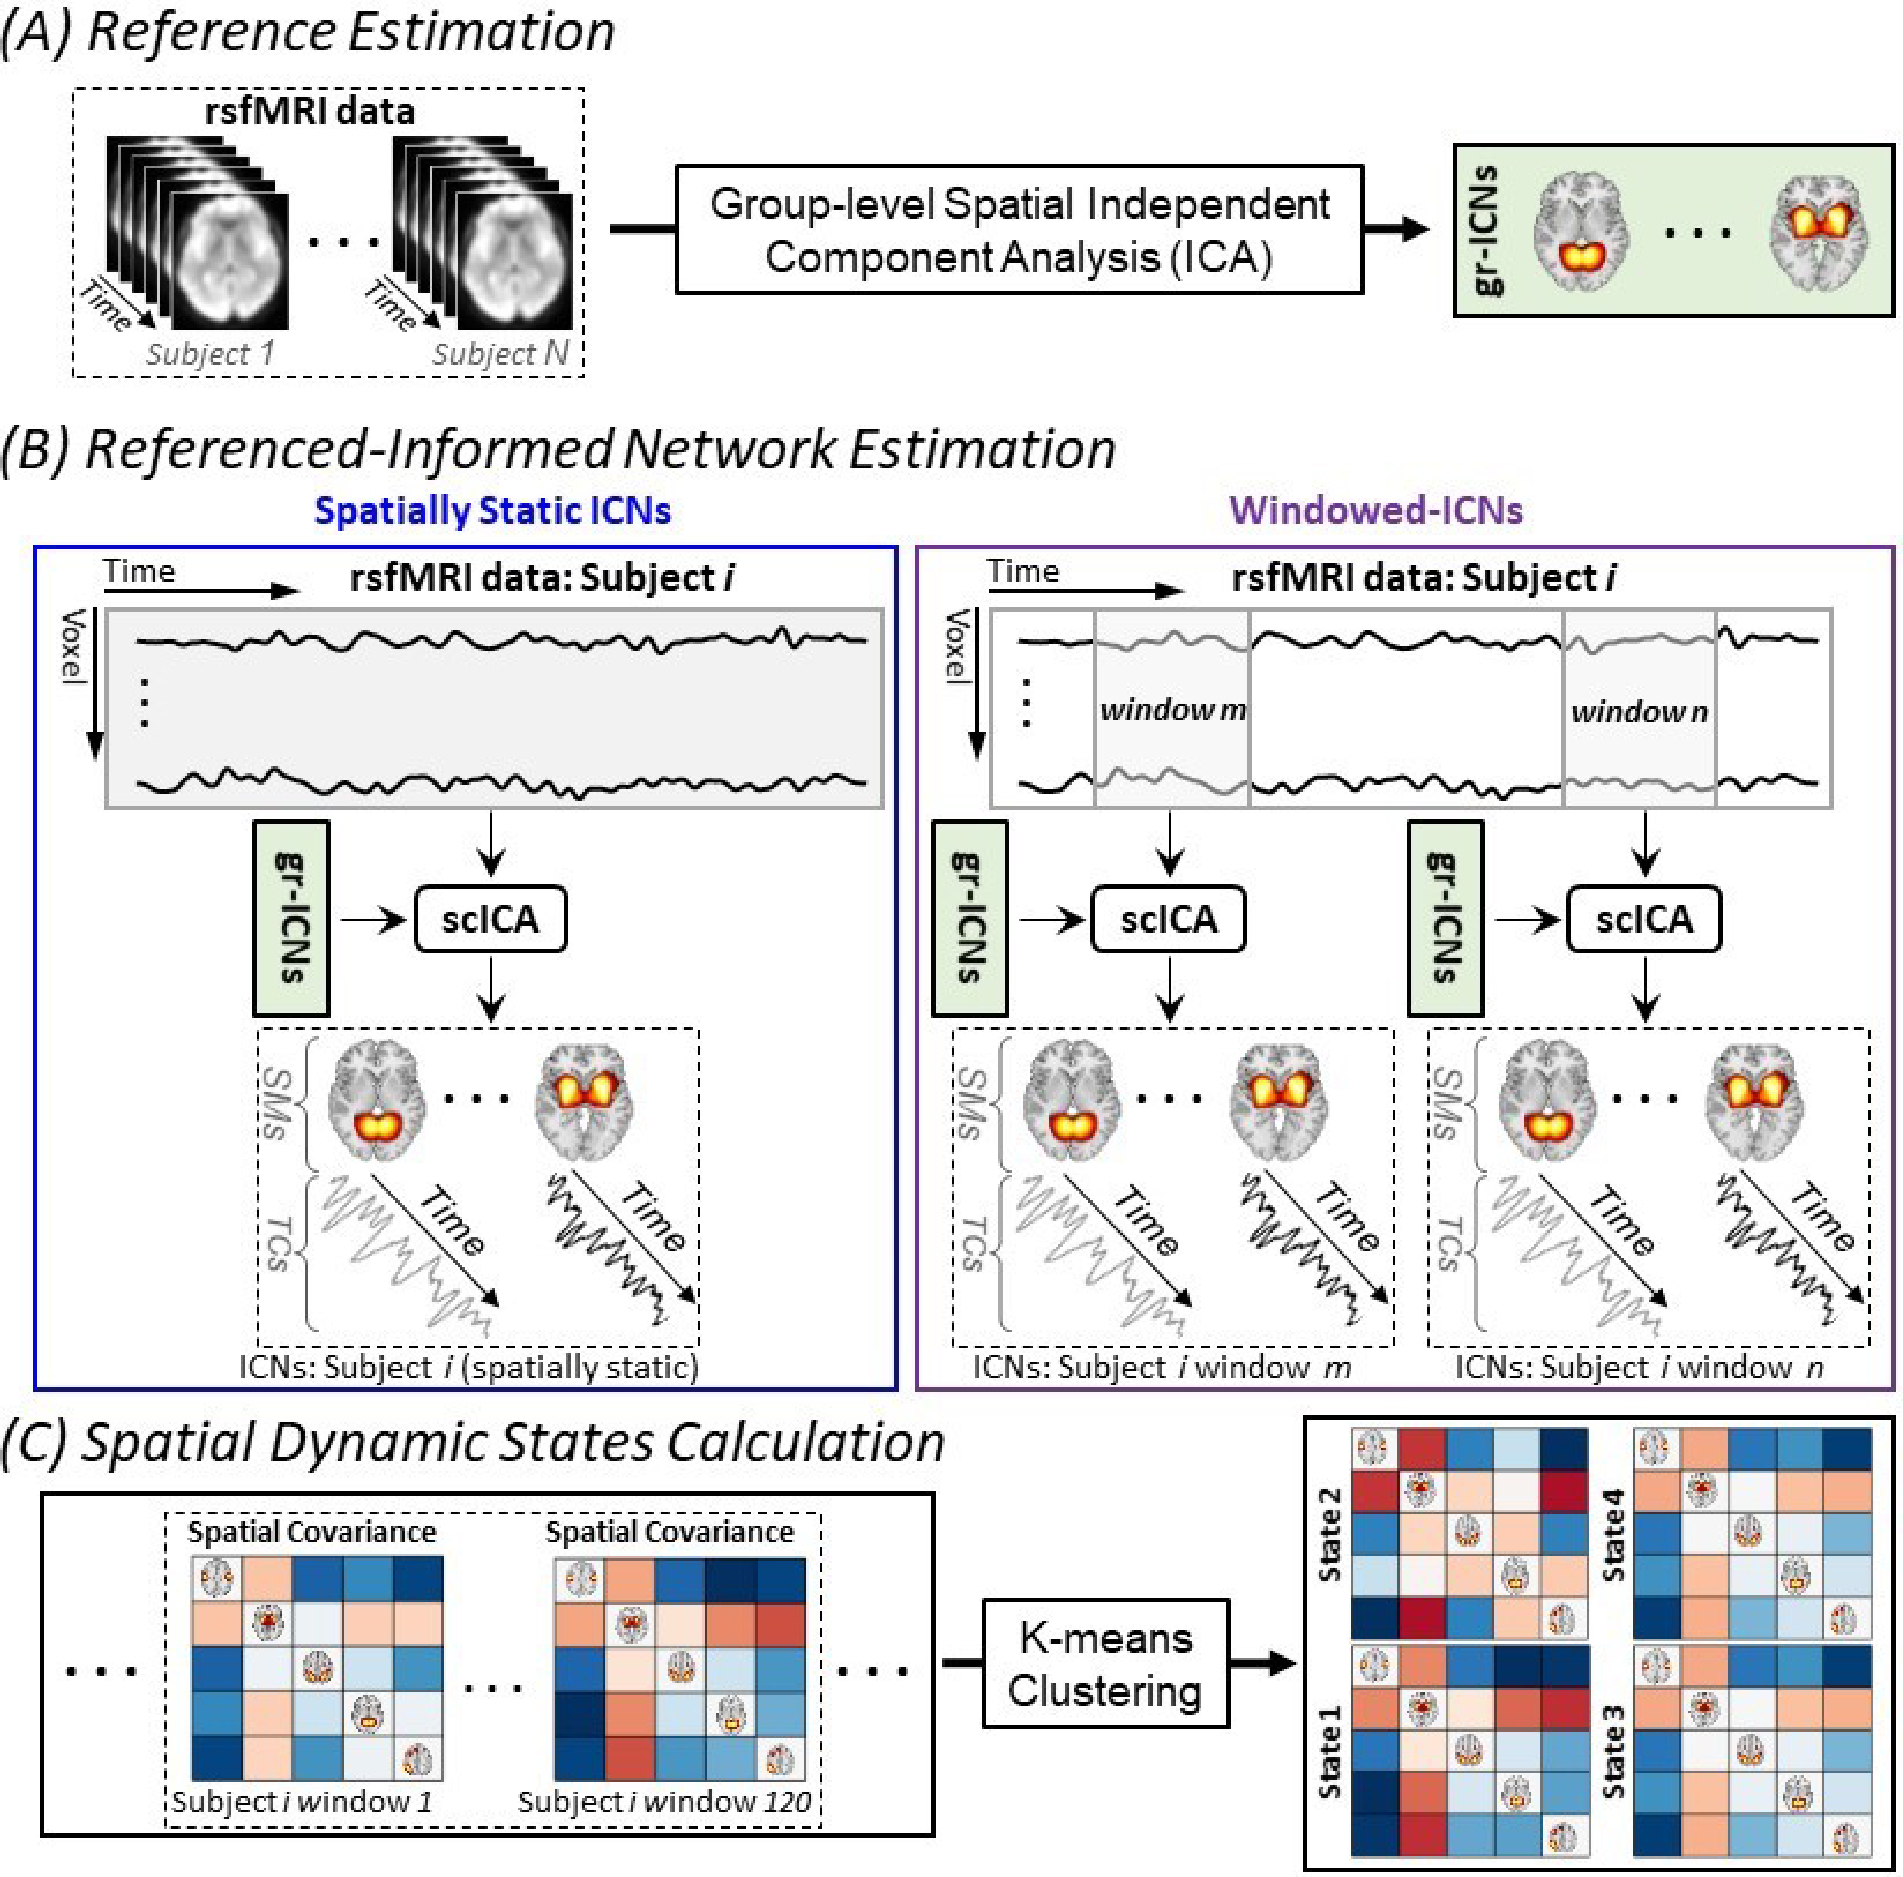
(A) Using group-level spatial independent component analysis to obtain group-level intrinsic connectivity networks as a functional unit reference. (B) Applying spatially constrained independent component analysis to estimate the correspondence of intrinsic connectivity networks from a given subject. The left panel shows the standard spatially constrained independent component analysis application to estimate spatially static intrinsic connectivity networks (i.e., assume spatial patterns of intrinsic connectivity networks remained fixed over time), and the right panel shows the proposed approach to estimate time-resolved intrinsic connectivity networks information. (C) Calculating whole-brain spatial dynamic states from spatial covariance matrices. gr-ICNs: group-level intrinsic connectivity networks and scICA: spatially constrained independent component analysis.
We first performed group-level spatial independent component analysis (ICA) (48) with a model order of 20 (41, 49) using the Group ICA of FMRI Toolbox (http://trendscenter.org/software/gift) and obtained large-scale brain networks used as the templates for downstream analysis (Fig. 1(A)). Fourteen components out of twenty with very high ICASSO stability index (average ± standard deviation = 0.96 ± 0.01, minimum-maximum = 0.93–0.98) were identified as brain networks based on their temporal and spatial properties and knowledge from previous studies (37, 41, 49). They include the primary and secondary visual (VIS-P/VIS-S), primary and secondary somatomotor (MTR-P/MTR-S), subcortical (SUB), cerebellar (CER), attention (ATN), frontal (FRNT), left and right frontoparietal (FPN-L/FPN-R), posterior and anterior default mode (DMN-P/DMN-A), salience (SN), and temporal (TEMP) networks (Fig. 2(A)). Moreover, separate ICAs conducted for each sex group identified similar networks for males and females with high spatial similarity (0.92 ± 0.05 and 0.92 ± 0.03, respectively).
Fig. 2 |. Capturing Global Brain States Dynamics using Low-dimensional Spatial Dynamic States.
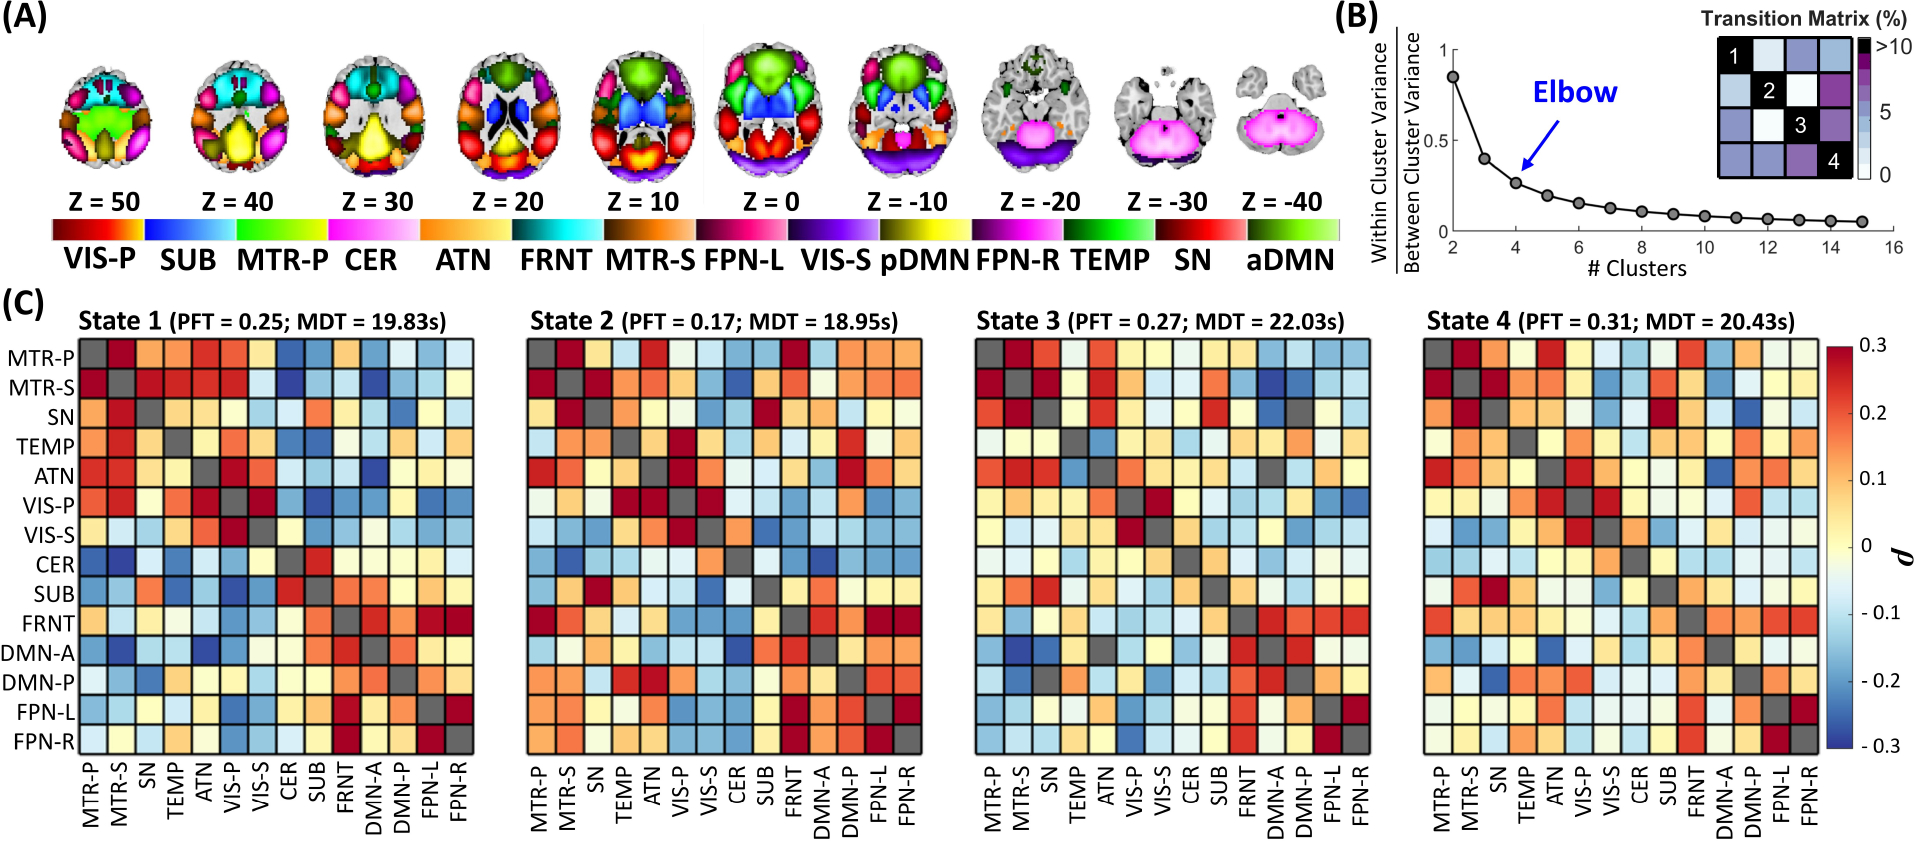
(A) Visualization of the intrinsic connectivity networks. Each color in the composite map represents the spatial map of one intrinsic connectivity networks thresholded at |Z| > 1.96 (p = 0.05). (B) Estimation of the optimal number of states. The k-means clustering procedure was conducted for cluster numbers from 1 to 15 clusters. The ratio of within- to between-cluster variance was calculated for each clustering, and the elbow criterion was used to estimate the number of global states. (C) The four spatial dynamic states are identified using k-means clustering with L1 distance. The fraction rate is the fraction of times a subject spends in a given state, and mean dwell time represents the average time a given subject stays in a given state before switching to another state. The mean dwell time is similar across states (18.95 ~ 22.03 seconds(s)), while fraction rate shows more difference across states (0.17 ~ 0.31). SUB: subcortical, VIS-P: visual-primary, VIS-S: visual-secondary, MTR-P: Motor-primary, MTR-S: Motor-secondary, CER: cerebellar, ATN: attention, FRNT: frontal, FPN-R: frontoparietal-right, FPN-L: frontoparietal-left, SN: salience, pDMN: posterior default mode, aDMN: anterior default mode, TEMP: temporal, MDT: mean dwell time, and PFT: Percentage fraction rate.
Next, we combined a spatially constrained ICA method called multivariate-objective optimization ICA with reference (50) (Fig. 1(B): Left) and the sliding-window technique (51) to estimate time-resolved networks corresponding to the templates (Fig. 1(B): Right). This ICA approach performs well in capturing sample-specific information for different data lengths and brain networks (37) and is robust to artifacts (52). The sliding-window technique is the most commonly used technique to study brain dynamics due to its simplicity, ease of use, and similarity with the conventional functional connectivity procedure, making the interpretation of findings straightforward (51). We used a tapered window (rectangle width = 60 seconds, Gaussian σ = 6 seconds) with a sliding step size of one, consistent with previous recommendations (51, 53) and our prior research in spatial dynamics (41), ensuring consistency and comparability across findings.
Low-dimensional Spatial Dynamic States Encapsulates Global Brain State Dynamics
We quantified tr-spFNC by calculating spatial covariance of networks at each time window, where an increase and decrease indicate network integration and segregation. We next captured global brain state dynamics by identifying four reoccurring distinct spFNC patterns Fig. 2(C) using k-means clustering with L1 distance and the elbow criterion (Fig. 2(B)), following by previous work and recommendations (21, 51, 54).
The fraction of time that individuals spend in spatial dynamics states varies significantly, with State 4 having an approximately twofold higher fraction rate compared to State 2 (0.31 vs. 0.17). State 4 demonstrates the lowest level of overall network integration, while States 1 and 2 show the highest integration. Conversely, the mean dwell time, which indicates the amount of time spent at each state per visit, is very similar across all states ranging between 18.95 to 22.03 seconds. In other words, while the life expectancy of spatial dynamic states (i.e., mean dwell time) is similar on average, the total amount of time the brain stays in each state varies.
The Clinical Relevance of Dynamic Spatial Coupling: A Schizophrenia Study
We next investigated alterations in the continuous reconfiguration of functional integration and segregation in schizophrenia. Given the prior findings (see Schizophrenia, Sex-Specific Differences, and Brain), we hypothesized alterations in dynamic spFNC of large-scale networks in schizophrenia, including sex-specific disruptions in the pDMN/SN spFNC.
We ran a generalized linear regression model for each spFNC pair from each spatial dynamic state with age, sex, mean framewise displacement, and site as confounding factors and diagnosis and sex-by-diagnosis interactions as predictors of interest. The p-values were corrected using the 5% false discovery rate (55).
We observed system-wide disruptions in dynamic functional integration (Fig. 3), among which the spFNC pairs of the CER, TEMP, and MTR-S are affected the most. As hypothesized, the dynamic spatial coupling between the pDMN and SN reveals sex-specific changes in schizophrenia. The sex-specific effect also exists in dynamic spFNC pairs of “CER/MTR-S” and “SUB/FRNT.” The sex-specific effect of schizophrenia was only significant in State 1, the state with the highest level of system-wide functional integration.
Fig. 3 |. Global Spatial Dynamic Disruption in Schizophrenia and Association with Genomic Data.
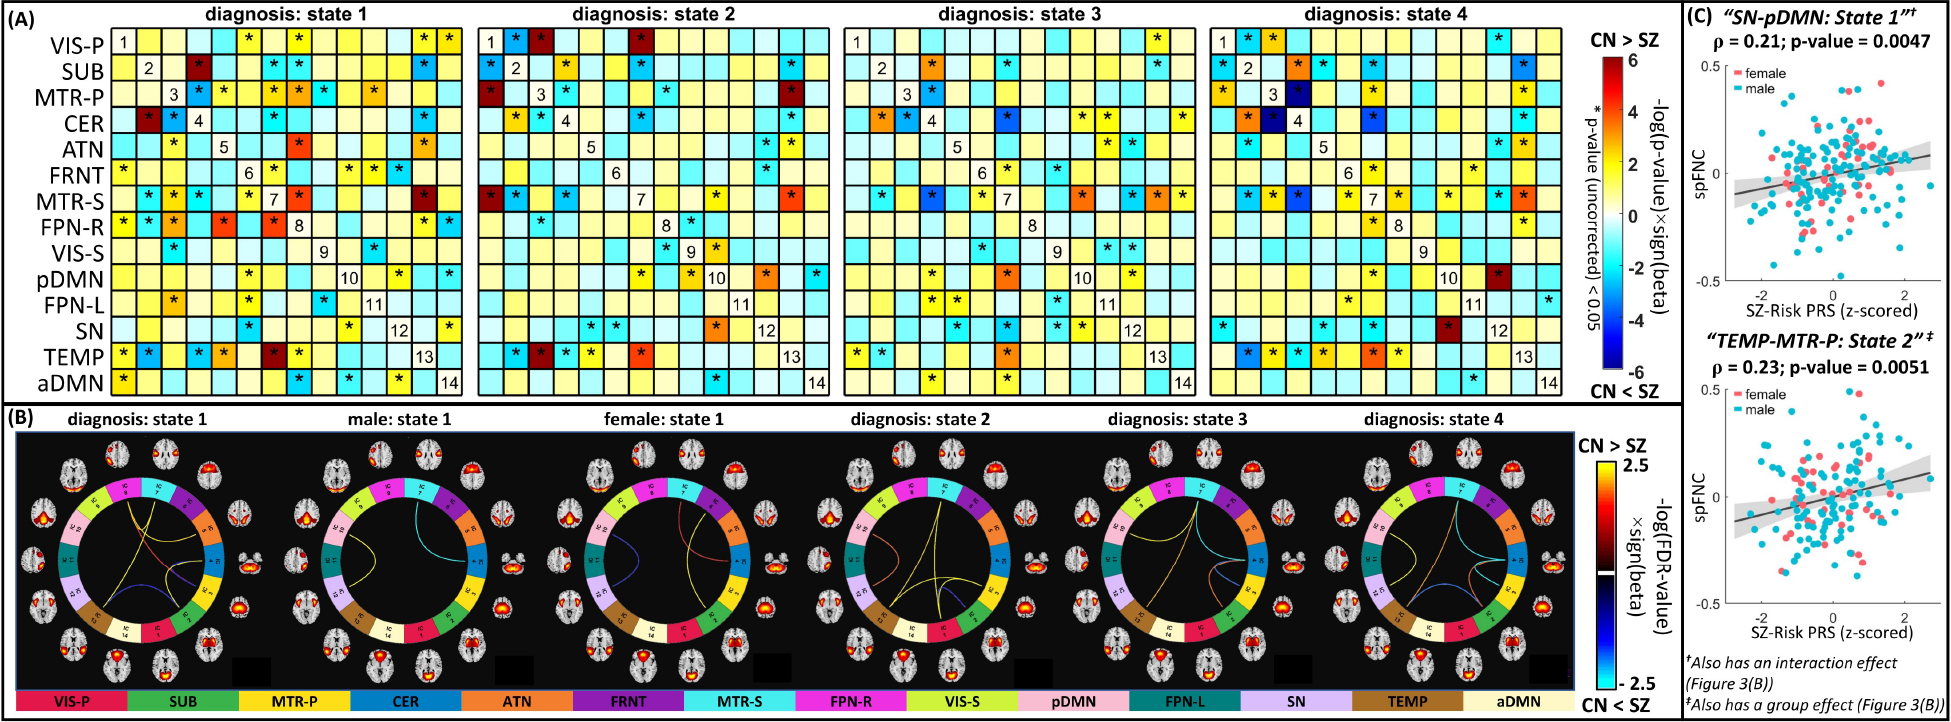
(A) Shows the diagnosis effect (before correcting for multiple comparisons), i.e., schizophrenia versus control, of the identified spatial functional network connectivity (spFNC) dynamic states. The statistical comparison for each per-state spFNC pair was conducted using a generalized linear regression model with age, sex, mean framewise displacement, and site as confounding factors and diagnosis and sex-by-diagnosis interactions as predictors of interest. Asterisks (*) represent p-value < 0.05. (B) Connectograms of state spFNC pairs with a significant diagnosis or interaction (diagnosis-by-sex) effects after false discovery rate corrections. Three spFNC pairs from State 1 show significant sex-diagnosis interaction effects, including posterior default mode and salience networks. (C) The association between schizophrenia genetic risk and aberrant dynamic spatial coupling. Among dynamic spFNC pairs with a significant schizophrenia effect, two show significant associations with the polygenic risk score (PRS) after false discovery rate correction. These two include the spFNC between the posterior default mode and salience networks in State 1 with a sex-specific schizophrenia effect and the spFNC between the temporal and primary motor networks in State 2, which show disruption in schizophrenia but with no significant sex effect. SUB: subcortical, VIS-P: visual-primary, VIS-S: visual-secondary, MTR-P: Motor-primary, MTR-S: Motor-secondary, CER: cerebellar, ATN: attention, FRNT: frontal, FPN-R: frontoparietal-right, FPN-L: frontoparietal-left, SN: salience, pDMN: posterior default mode, aDMN: anterior default mode, TEMP: temporal, SZ: schizophrenia, CN: control, PRS: polygenic risk score.
We next evaluated the genomic predisposition of aberrant system-wide dynamic functional integration. We focused on the schizophrenia-risk single nucleotide polymorphisms residing in the 287 loci reported by a recent large-scale schizophrenia genomic study (56) and computed the polygenic risk score for schizophrenia pruned at r-squared < 0.1 (57) using PRSice (58). Sixteen of the annotated genes have been implicated for credible causal non-synonymous or untranslated region variation, and the enrichment test has pointed to postsynaptic pathology (57). Details regarding these 287 risk loci are available in Supplementary Table 3 of (57). The associations between the polygenic risk score and aberrant dynamic spFNC were performed on subset of data (European/American = 304/109, schizophrenia/control = 156/257) using Pearson correlation while controlling for diagnosis, sex, age, mean framewise displacement, and site and correcting using the false discovery rate. Two dynamic spFNC pairs exhibit significant correlations with the polygenic risk score for schizophrenia, including “pDMN/SN” spFNC in State 1 with a sex-specific schizophrenia effect and “TEMP/MTR-P” the spFNC in State 2 with a significant diagnosis effect (Fig. 3(C)). We further investigated these associations separately in European and American populations and observed consistent associations with comparable effect sizes.
Low Regional Contribution Linked to High Informational Content
Next, we investigated how schizophrenia-related alterations in low-dimensional spatial dynamic states link to diagnosis differences in high-dimensional voxel space, by focusing on the dynamic spFNC pairs with both significant schizophrenia effects and genomic associations. Voxel-wise statistical comparisons were conducted on the networks’ state spatial maps using the same regression model as for spFNC analysis, resulting in one spatial map of beta coefficients for each variable of interest. Subsequently, we computed the spatial similarity between each beta-spatial map and the spatial maps of networks involved in each spFNC pair using Pearson correlation and compared it with the spatial similarity estimated from null data with the same level of spatial smoothing.
Our results suggest that (1) the aberrations of brain networks reflect changes in dynamic spFNC; (2) schizophrenia affects brain networks in a nuanced and distributed manner across the entire brain; (3) regions with lower network contributions demonstrate a more prominent effect; and (4) the impact of schizophrenia may not necessarily be strongly evident for single voxels, despite significant whole-brain effects.
Fig. 4(A) displays the spatial similarity between the beta-spatial maps of variables of interest (e.g., diagnosis) and the network maps, with significant similarities indicated by asterisks. Fig. 4(B) exhibits the beta-spatial maps with significant spatial similarity. The beta-spatial map of SN State 1 for the sex-by-diagnosis interaction and male diagnosis effects (but not for the group diagnosis effect) show significant spatial similarities with the pDMN (Fig. 4(A)). Similarly, the beta-spatial maps of the interaction (sex-by-diagnosis) and diagnosis (male) effects for the State 1 pDMN have significant similarities with the spatial map of the SN (Fig. 4(A)). These findings bolster the sex-specific schizophrenia effect observed in “pDMN/SN” spFNC in State 1 (Fig. 3).
Fig. 4 |. The Evidence of Aberrant Dynamic Spatial Coupling on Network Dynamic Spatial Maps.
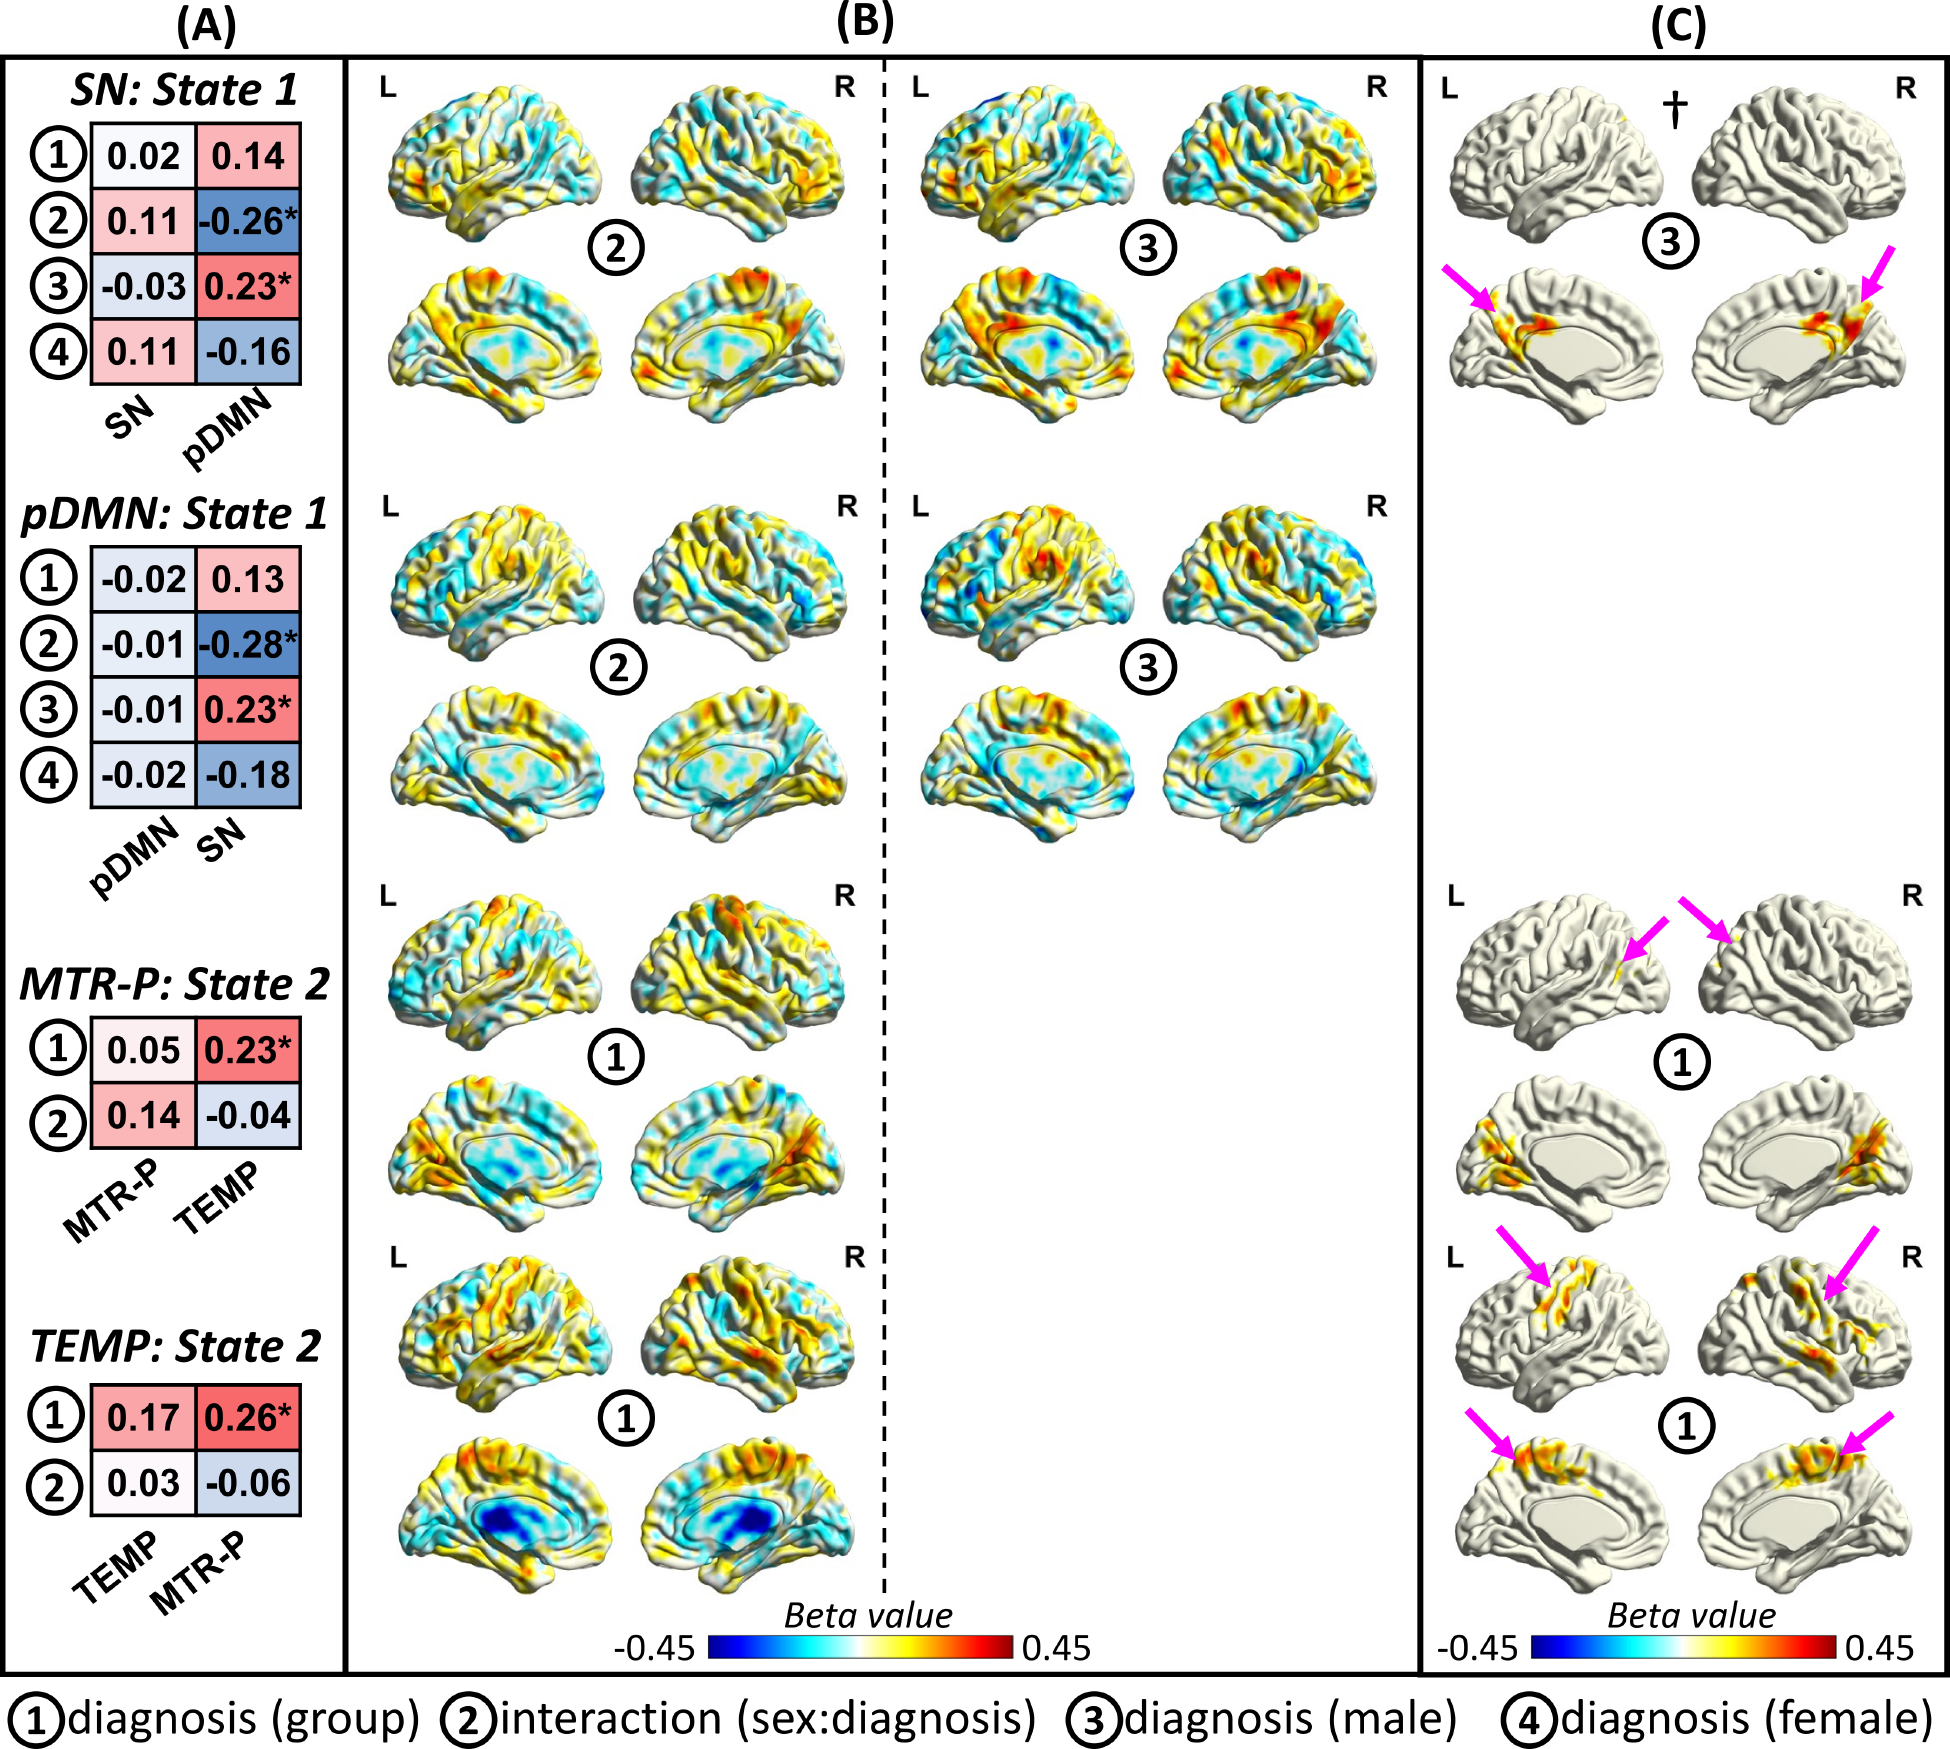
We conducted voxel-wise statistical analysis on the spatial patterns of the networks to evaluate if the effect of schizophrenia on dynamic spFNC emerges in the network dynamic spatial maps. We focus on the spatial patterns involved in the two spFNC pairs with significant schizophrenia effects and genomic associations. (A) shows the results of the spatial similarity (measured by Pearson correlation) between the spatial map of a specific network for a given state and the beta-spatial maps of the variables of interest (e.g., diagnosis) from voxel-wise statistical analysis. Asterisks represent those with significant spatial similarity (p-value < 0.05), and the value in each cell represents the Pearson correlation coefficient. The results are aligned with dynamic spFNC findings. For instance, we observe significant spatial similarity with the posterior default mode network (pDMN) for the interaction effect in the salience network (SN) state 1. Another example is the spatial map of the diagnosis group effect (but not the interaction effect) obtain using voxel-wise analysis of the primary somatomotor network (MTR-P) in State 2, which shows significant spatial similarity with the spatial map of the temporal (TEMP) network. (B) exhibits the beta-spatial maps of those that show significant spatial similarity in Fig. 4(A). To study the impact of the impact of schizophrenia at the voxel level, cluster-wise correction was applied to beta-spatial maps. Panel (C) displays cluster-corrected statistics. Pink arrows illustrate clusters in which the paired networks have a strong contribution. For example, the pink arrows in † show the cluster in the posterior cingulate cortex (PCC) and precuneus that survived cluster-wise correction. The PCC and precuneus are the cores of the pDMN and contribute significantly to the pDMN.
For the State 1 pDMN, the impact of schizophrenia was not strong enough to manifest at the voxel level (Fig. 4(C)), despite the significant global effect. However, the SN map in State 1 revealed significant interaction and male diagnosis effects in regions commonly associated with the pDMN, including the posterior cingulate cortex and precuneus (Fig. 4(C)). These regions with notable sex-specific schizophrenia effects have often been masked out in previous research due to their weak functional connectivity to their respective networks.
For the MTR-P and TEMP networks in State 2 with significant diagnostic effects in their spFNC (Fig. 3), the beta-spatial map of the diagnosis effect shows significant spatial similarity with the TEMP and MTR-P networks, respectively (Fig. 4(A)). At the voxel level, regions with significant diagnosis group effects for the TEMP network resemble the MTR-P network (Fig. 4(C)). For the MTR-P network, the diagnosis group effect spatial map contains a brain area with a significant contribution to TEMP but also contains regions of the VIS-P, which also show aberrant FNC with the MTR-P in State 2.
We also conducted a voxel-wise analysis to evaluate the associations between the polygenic risk score and state network spatial maps. We found significant spatial similarities (p < 0.05) between the genomic association maps and all four networks’ state spatial maps. For example, the genomic association map for the State 1 pDMN showed significant spatial similarity with the SN map (p = 0.03).
Discussion
Our research aims to explore the potential benefits of dynamic spatial integration and segregation of brain networks in the context of schizophrenia, with a particular focus on sex-specific alterations and their links to genetic risk factors.
To achieve this goal and address existing challenges, we introduce a reference-informed network estimation technique that effectively estimates time-resolved networks from short time segments, while also controlling for the influence of other networks in the estimations. This has a potential advantage over our previous work (41), which utilized sliding window correlation as an alternative approach. Furthermore, compare to our previous effort (59), this method is more generalizable, computationally efficient, and capable of capturing information about the second- and higher-order statistics of spatial dependence. This allows us to more accurately quantify dynamic integration and segregation, enhancing our understanding of dysconnectivity in brain dynamics associated with schizophrenia.
We identified four distinct spatial dynamic states with unique network integration and segregation patterns, collectively providing a low-dimensional summary of global brain state dynamics. The brain spends more time in State 4, the most segregated state with the highest rate of between-state transitioning. We propose that this state functions as a hub-like transition state. However, all states have a similar life expectancy, suggesting that State 4 is not a steady state. These findings must be verified in an independent dataset to ensure replicability and generalizability.
We examined the impact of schizophrenia on low-dimensional spatial dynamic states. Inferring from the dysconnectivity hypothesis (60), disturbances in behavior and psychopathology are expected to be associated with disruptions in the reconfiguration of system-wide brain functional integration. Our findings support this proposition by demonstrating significant alterations in the dynamics of spatial coupling in both men and women with schizophrenia.
In general, individuals with schizophrenia present lower spFNC integration across all states and most networks. Specifically, the patterns of lower integration were more widespread in the MTRs and PFN-R (Fig. 3). This is in line with previous reports of global connectivity deficits in schizophrenia, with more prominent alterations in the frontal and temporal regions (61, 62). We also found that individuals with schizophrenia present, to a lesser extent, higher spFNC integration in specific pairs of networks, mainly involving the SUB, TEMP, MTRs, CER networks (Fig. 3). This is also in line with previous reports of functional hyperconnectivity in individuals with schizophrenia (63–65).
While widespread disruption in networks’ spatial coupling occurs across the whole brain and all dynamic states, the highly integrated, modular State 1 shows a great number of dysconnectivity patterns. The alterations observed in the “pDMN/SN” and “FPN-R/ATN” spFNC in this state may be related to disturbances in cognitive and psychopathology associated with psychosis (20, 66). These findings are in line with the triple-network (TPN) model (66), suggesting the abnormal striatal dopamine release may lead to disruptions in the dynamics among the DMN, SN, and FPN, thus potentially contributing to the misattribution of salience to irrelevant external stimuli and self-referential mental events.
Moreover, functional connectivity aberrations in the pDMN have been repeatedly involved with schizophrenia pathophysiology (67–69). Our results support and extend these findings by showing that disruptions in “pDMN/SN” spFNC are present in all four dynamic states (although this did not survive multiple comparison correction in State 3). Also, as hypothesized, we found a sex-by-diagnosis interaction effect for “pDMN/SN” spFNC in State 1, which could explain why some previous work found mixed results (68, 70–72), or no alterations (73) in the DMN functional connectivity of individuals with schizophrenia. This pair also shows an association with schizophrenia polygenic risk score, adding another confirmation layer and suggesting a potential sex-specific psychosis neurobiological marker. However, the reproducibility of these results should be verified through an independent dataset.
Prior studies suggest that women diagnosed with schizophrenia tend to manifest more affective symptoms and often have overlapping diagnoses with affective psychosis (74, 75). Negative symptoms tend to be more prevalent in males. Given the association between these symptoms and differences in Cingulo-Opercular and Cerebellar Networks (76), our findings align with the potential link between cerebellar and salience networks and the observed sex differences.
Some spFNC pairs present significant schizophrenia differences that are fleeting and temporally localized to only a few states (i.e., exhibit a state-like property), which contrasts with spFNC pairs where the schizophrenia effect consistently present across all states (a trait-like property). The PFN-R/ATN coupling exemplifies a state-like spFNC pair, whereas the TEMP/MTR-S pair is a notable trait-like example. Intriguingly, based on Neurosynth (https://www.neurosynth.org/) (77), the highest activation point for the TEMP is linked to semantic integration and language, while the peak activation for MTR-S is associated with speech production. Disruptions in language-related regions and networks in psychotic disorders are a finding well-established by prior studies and might be linked to auditory verbal hallucinations (78–83). It should be noted that other pairs, such as pDMN/SN (with diagnosis-by-sex interaction effect), MTR-S/SUB, MTR-S/CER, and SUB/CER, demonstrate a similar trait-like pattern, although the difference did not survive multiple comparison corrections in all states (Fig 3(A)). Importantly the SZ-changes in MTR-S/SUB/CER support the cerebellar-thalamic-cortical dysconnectivity model of psychosis (84–86).
Another major finding is the spatial decoupling between TEMP and MTR networks across all states, among which TEMP/MTR-P spFNC in State 2 is correlated with schizophrenia polygenic risk score. Alterations in functional connectivity in temporal, somatosensory, and motor regions have been previously associated with schizophrenia (19), but to the best of our knowledge, this is the first study to show an association between those aberrations and genetic predisposition for schizophrenia. Individuals with schizophrenia often exhibit motor impairments from early stages, suggesting a genetic vulnerability contributing to neurodevelopmental disruptions (87, 88). Temporal cortex dysfunction may also play a role in social cognition and theory of mind impairments in schizophrenia due to difficulties detecting subtle emotional components of auditory inputs, leading to reduced social interaction skills and marked deficiencies in psychosocial functioning (89). Additionally, the schizophrenia polygenic risk score reflects the overall genetic risk burden of 287 SZ-related loci, for which a fine mapping revealed that sixteen of the annotated genes had been implicated for credible causal non-synonymous or untranslated region variation. The enrichment test has also pointed to a diverse set of synaptic proteins and suggested that multiple functional interactions of schizophrenia risk converge on synapses (56). While our findings link genetic risk for schizophrenia to TEMP/MTR networks, it is intriguing to investigate whether this genetic predisposition could lead to synaptic alterations in these networks during neurodevelopment, resulting in poor functional integration and the early emergence of neurological signs.
A significant breakthrough has been made regarding the significance of regions with weak functional connectivity (Fig. 4). Our findings reveal that the distortion in spatial coupling is embedded in high-dimensional (voxel-level) space in brain regions with low contributions to the corresponding networks (Fig. 4). For instance, significant SZ interaction and male diagnosis effects in the SN State 1 are exclusively exhibited in regions with a low contribution to the SN. This observation is significant because current research often overlooks regions with small contributions during voxel-wise analysis (i.e., use a mask of regions with high amplitude in spatial maps). This complements our recent finding (22) on the importance of time points with low contributions in capturing schizophrenia-related changes, calling for further investigation.
Together, our findings indicate that information about dynamic spatial dependence, which has been overlooked, holds immense potential to substantially impact the clinical landscape as it quantifies the continuous integration and segregation of brain networks. Particularly, it can advance our understanding of schizophrenia, a disorder often characterized by dysconnectivity and disruptions in system-wide functional integration.
Limitations and Future Direction
We confirmed the existence of these networks in both sex groups, and our framework ensures comparability of findings between them. Nevertheless, there is a pressing need for new techniques that account for sex-specific differences when estimating brain networks.
Using spatially constrained ICA enables capturing brain networks from short data lengths (37), but its constraints limit comprehensive depiction of spatial dynamics and subject-specific features. Future research should develop optimized methods for more precise and thorough estimations of time-resolved subject-specific networks, to improve our understanding of intricate spatial dynamics and individual variations in brain function. Furthermore, our study focused on dynamic spatial coupling, but a more comprehensive framework that includes temporal dynamics and static features is needed to characterize sex-common and sex-specific functional patterns of schizophrenia and their association with genetic risk factors.
This study made choices based on existing knowledge from previous studies (51, 53, 54). However, the impact of different choices and the generalizability of clinical findings should be assessed by future studies, particularly considering the inconsistency among previous schizophrenia-related findings. For instance, future studies should investigate the impact of window lengths and spatial smoothing (37).
Factors, such as medication status and symptom severity, may influence the results and limit their applicability to other populations or specific subgroups. It is imperative to assess the replicability and generalizability of the findings in more homogeneous independent datasets with larger sample sizes, with a particular focus on medication use, symptom severity, substance use disorders, medical comorbidities, and years since symptom onset. While our post hoc analysis found no significant association between medication (chlorpromazine equivalence scores) and the two dynamic spFNC pairs with significant schizophrenia effects and genomic associations, evaluating the impact of different pharmacological treatments on schizophrenia related changes in brain dynamics is critical. Additionally, future research should evaluate our findings in other cohorts, such as first-episode psychosis, individuals at high risk of psychosis, or first-degree relatives.
The correlation between the schizophrenia polygenic risk score and two specific spFNC aberrations suggests genetic influence on these changes and lends support to the neurodevelopmental hypothesis of schizophrenia, but the cross-sectional design precludes causal inference. Longitudinal studies with larger datasets are needed to elucidate the neurodevelopmental trajectory of schizophrenia.
Finally, the relevance of sex-specific findings should be interpreted while recognizing sex differences in the incidence and prevalence (higher in males) and earlier onset in males of schizophrenia. Additionally, the limitations of statistical power underscore the need for larger sample sizes in future studies to validate these findings. Gender is another crucial factor that can influence our findings. Sex and gender differences in psychosis are the consequence of complex interactions between biological and psychosocial factors. It is essential to evaluate our findings in a dataset with both sex and gender information to discern between findings driven primarily by psychosocial or biological factors.
Supplementary Material
KEY RESOURCES TABLE.
| Resource Type | Specific Reagent or Resource | Source or Reference | Identifiers | Additional Information |
|---|---|---|---|---|
| Add additional rows as needed for each resource type | Include species and sex when applicable. | Include name of manufacturer, company, repository, individual, or research lab. Include PMID or DOI for references; use "this paper” if new. | Include catalog numbers, stock numbers, database IDs or accession numbers, and/or RRIDs. RRIDs are highly encouraged; search for RRIDs at https://scicrunch.org/resources. | Include any additional information or notes if necessary. |
| Software; Algorithm | SCR_007037 | SPM toolbox | ||
| Software; Algorithm | SCR_002823 | FSL toolbox | ||
| Software; Algorithm | SCR_024416 | GIFT toolbox | ||
| Other | SCR_007291 | FBIRN dataset | ||
| Other | SCR_010482 | COBRE dataset | ||
| Other | SCR_004384 | MPRC dataset |
Acknowledgments
This work was supported by grants from the National Institutes of Health grant numbers R01MH123610, R01EB020407, R01MH118695, and NSF 2112455 to Dr. Vince D. Calhoun and 5R01MH119251 to Dr. Armin Iraji.
Footnotes
Financial Disclosures
The authors report no biomedical financial interests or potential conflicts of interest.
Publisher's Disclaimer: This is a PDF file of an unedited manuscript that has been accepted for publication. As a service to our customers we are providing this early version of the manuscript. The manuscript will undergo copyediting, typesetting, and review of the resulting proof before it is published in its final form. Please note that during the production process errors may be discovered which could affect the content, and all legal disclaimers that apply to the journal pertain.
References
- 1.Kadakia A, Catillon M, Fan Q, Williams GR, Marden JR, Anderson A, et al. (2022): The Economic Burden of Schizophrenia in the United States. J Clin Psychiatry. 83. [DOI] [PubMed] [Google Scholar]
- 2.Green MF (2006): Cognitive impairment and functional outcome in schizophrenia and bipolar disorder. J Clin Psychiatry. 67 Suppl 9:3–8; discussion 36–42. [PubMed] [Google Scholar]
- 3.Tandon R, Nasrallah HA, Keshavan MS (2009): Schizophrenia, “just the facts” 4. Clinical features and conceptualization. Schizophr Res. 110:1–23. [DOI] [PubMed] [Google Scholar]
- 4.Paus T, Keshavan M, Giedd JN (2008): Why do many psychiatric disorders emerge during adolescence? Nat Rev Neurosci. 9:947–957. [DOI] [PMC free article] [PubMed] [Google Scholar]
- 5.Dalsgaard S, Thorsteinsson E, Trabjerg BB, Schullehner J, Plana-Ripoll O, Brikell I, et al. (2020): Incidence rates and cumulative incidences of the full spectrum of diagnosed mental disorders in childhood and adolescence. Jama Psychiat. 77:155–164. [DOI] [PMC free article] [PubMed] [Google Scholar]
- 6.Li R, Ma X, Wang G, Yang J, Wang C (2016): Why sex differences in schizophrenia? Journal of translational neuroscience. 1:37. [PMC free article] [PubMed] [Google Scholar]
- 7.Ochoa S, Usall J, Cobo J, Labad X, Kulkarni J (2012): Gender differences in schizophrenia and first-episode psychosis: a comprehensive literature review. Schizophr Res Treatment. 2012:916198. [DOI] [PMC free article] [PubMed] [Google Scholar]
- 8.Mendrek A, Mancini-Marïe A (2016): Sex/gender differences in the brain and cognition in schizophrenia. Neurosci Biobehav Rev. 67:57–78. [DOI] [PubMed] [Google Scholar]
- 9.Goldstein JM, Cherkerzian S, Tsuang MT, Petryshen TL (2013): Sex differences in the genetic risk for schizophrenia: History of the evidence for sex-specific and sex-dependent effects. American Journal of Medical Genetics Part B: Neuropsychiatric Genetics. 162:698–710. [DOI] [PubMed] [Google Scholar]
- 10.Frederikse M, Lu A, Aylward E, Barta P, Sharma T, Pearlson G (2000): Sex differences in inferior parietal lobule volume in schizophrenia. Am J Psychiat. 157:422–427. [DOI] [PubMed] [Google Scholar]
- 11.Mendrek A, Mancini-Marïe A (2016): Sex/gender differences in the brain and cognition in schizophrenia. Neuroscience & Biobehavioral Reviews. 67:57–78. [DOI] [PubMed] [Google Scholar]
- 12.Shifman S, Johannesson M, Bronstein M, Chen SX, Collier DA, Craddock NJ, et al. (2008): Genome-wide association identifies a common variant in the reelin gene that increases the risk of schizophrenia only in women. Plos Genet. 4:e28. [DOI] [PMC free article] [PubMed] [Google Scholar]
- 13.Zhang F, Chen Q, Ye T, Lipska BK, Straub RE, Vakkalanka R, et al. (2011): Evidence of sex-modulated association of ZNF804A with schizophrenia. Biol Psychiat. 69:914–917. [DOI] [PubMed] [Google Scholar]
- 14.Blokland GA, Grove J, Chen C-Y, Cotsapas C, Tobet S, Handa R, et al. (2022): Sex-dependent shared and nonshared genetic architecture across mood and psychotic disorders. Biol Psychiat. 91:102–117. [DOI] [PMC free article] [PubMed] [Google Scholar]
- 15.Koch E, Nyberg L, Lundquist A, Pudas S, Adolfsson R, Kauppi K (2021): Sex-specific effects of polygenic risk for schizophrenia on lifespan cognitive functioning in healthy individuals. Transl Psychiat. 11:520. [DOI] [PMC free article] [PubMed] [Google Scholar]
- 16.Buckholtz JW, Meyer-Lindenberg A (2012): Psychopathology and the human connectome: toward a transdiagnostic model of risk for mental illness. Neuron. 74:990–1004. [DOI] [PubMed] [Google Scholar]
- 17.Friston KJ (2002): Dysfunctional connectivity in schizophrenia. World Psychiatry. 1:66–71. [PMC free article] [PubMed] [Google Scholar]
- 18.Calhoun VD, Sui J, Kiehl K, Turner J, Allen E, Pearlson G (2011): Exploring the psychosis functional connectome: aberrant intrinsic networks in schizophrenia and bipolar disorder. Front Psychiatry. 2:75. [DOI] [PMC free article] [PubMed] [Google Scholar]
- 19.Damaraju E, Allen EA, Belger A, Ford JM, McEwen S, Mathalon DH, et al. (2014): Dynamic functional connectivity analysis reveals transient states of dysconnectivity in schizophrenia. Neuroimage Clin. 5:298–308. [DOI] [PMC free article] [PubMed] [Google Scholar]
- 20.Hare SM, Ford JM, Mathalon DH, Damaraju E, Bustillo J, Belger A, et al. (2019): Salience-Default Mode Functional Network Connectivity Linked to Positive and Negative Symptoms of Schizophrenia. Schizophr Bull. 45:892–901. [DOI] [PMC free article] [PubMed] [Google Scholar]
- 21.Iraji A, Faghiri A, Fu Z, Rachakonda S, Kochunov P, Belger A, et al. (2022): Multi-spatial-scale dynamic interactions between functional sources reveal sex-specific changes in schizophrenia. Network Neuroscience. 6:357–381. [DOI] [PMC free article] [PubMed] [Google Scholar]
- 22.Iraji A, Faghiri A, Fu Z, Kochunov P, Adhikari BM, Belger A, et al. (2022): Moving beyond the ‘CAP’ of the Iceberg: Intrinsic connectivity networks in fMRI are continuously engaging and overlapping. Neuroimage. 251:119013. [DOI] [PMC free article] [PubMed] [Google Scholar]
- 23.Iraji A, Fu Z, Damaraju E, DeRamus TP, Lewis N, Bustillo JR, et al. (2019): Spatial dynamics within and between brain functional domains: A hierarchical approach to study time-varying brain function. Hum Brain Mapp. 40:1969–1986. [DOI] [PMC free article] [PubMed] [Google Scholar]
- 24.Li S, Hu N, Zhang W, Tao B, Dai J, Gong Y, et al. (2019): Dysconnectivity of Multiple Brain Networks in Schizophrenia: A Meta-Analysis of Resting-State Functional Connectivity. Front Psychiatry. 10:482. [DOI] [PMC free article] [PubMed] [Google Scholar]
- 25.Dong D, Wang Y, Chang X, Luo C, Yao D (2018): Dysfunction of Large-Scale Brain Networks in Schizophrenia: A Meta-analysis of Resting-State Functional Connectivity. Schizophr Bull. 44:168–181. [DOI] [PMC free article] [PubMed] [Google Scholar]
- 26.Long Q, Bhinge S, Calhoun VD, Adali T (2021): Relationship between Dynamic Blood-Oxygen-Level-Dependent Activity and Functional Network Connectivity: Characterization of Schizophrenia Subgroups. Brain Connect. 11:430–446. [DOI] [PMC free article] [PubMed] [Google Scholar]
- 27.Pugliese V, de Filippis R, Aloi M, Rotella P, Carbone EA, Gaetano R, et al. (2022): Aberrant salience correlates with psychotic dimensions in outpatients with schizophrenia spectrum disorders. Ann Gen Psychiatry. 21:25. [DOI] [PMC free article] [PubMed] [Google Scholar]
- 28.Li R, Ma X, Wang G, Yang J, Wang C (2016): Why sex differences in schizophrenia? J Transl Neurosci (Beijing). 1:37–42. [PMC free article] [PubMed] [Google Scholar]
- 29.Riecher-Rössler A, Butler S, Kulkarni J (2018): Sex and gender differences in schizophrenic psychoses-a critical review. Arch Womens Ment Health. 21:627–648. [DOI] [PubMed] [Google Scholar]
- 30.Carter B, Wootten J, Archie S, Terry AL, Anderson KK (2022): Sex and gender differences in symptoms of early psychosis: a systematic review and meta-analysis. Arch Womens Ment Health. 25:679–691. [DOI] [PubMed] [Google Scholar]
- 31.Long H, Fan M, Yang X, Guan Q, Huang Y, Xu X, et al. (2021): Sex-related Difference in Mental Rotation Performance is Mediated by the special Functional Connectivity Between the Default Mode and Salience Networks. Neuroscience. 478:65–74. [DOI] [PubMed] [Google Scholar]
- 32.Lawrence KE, Hernandez LM, Bowman HC, Padgaonkar NT, Fuster E, Jack A, et al. (2020): Sex Differences in Functional Connectivity of the Salience, Default Mode, and Central Executive Networks in Youth with ASD. Cereb Cortex. 30:5107–5120. [DOI] [PMC free article] [PubMed] [Google Scholar]
- 33.Canitano R, Pallagrosi M (2017): Autism Spectrum Disorders and Schizophrenia Spectrum Disorders: Excitation/Inhibition Imbalance and Developmental Trajectories. Front Psychiatry. 8:69. [DOI] [PMC free article] [PubMed] [Google Scholar]
- 34.Iraji A, Miller R, Adali T, Calhoun VD (2020): Space: A Missing Piece of the Dynamic Puzzle. Trends Cogn Sci. 24:135–149. [DOI] [PMC free article] [PubMed] [Google Scholar]
- 35.Allen EA, Erhardt EB, Damaraju E, Gruner W, Segall JM, Silva RF, et al. (2011): A baseline for the multivariate comparison of resting-state networks. Front Syst Neurosci. 5:2. [DOI] [PMC free article] [PubMed] [Google Scholar]
- 36.Du Y, Fu Z, Sui J, Gao S, Xing Y, Lin D, et al. (2020): NeuroMark: An automated and adaptive ICA based pipeline to identify reproducible fMRI markers of brain disorders. Neuroimage Clin. 28:102375. [DOI] [PMC free article] [PubMed] [Google Scholar]
- 37.Iraji A, Fu Z, Faghiri A, Duda M, Chen J, Rachakonda S, et al. (2022): Canonical and Replicable Multi-Scale Intrinsic Connectivity Networks in 100k+ Resting-State fMRI Datasets. bioRxiv.2022.2009.2003.506487. [DOI] [PMC free article] [PubMed] [Google Scholar]
- 38.Schaefer A, Kong R, Gordon EM, Laumann TO, Zuo XN, Holmes AJ, et al. (2018): Local-Global Parcellation of the Human Cerebral Cortex from Intrinsic Functional Connectivity MRI. Cereb Cortex. 28:3095–3114. [DOI] [PMC free article] [PubMed] [Google Scholar]
- 39.Craddock RC, James GA, Holtzheimer PE 3rd, Hu XP, Mayberg HS (2012): A whole brain fMRI atlas generated via spatially constrained spectral clustering. Hum Brain Mapp. 33:1914–1928. [DOI] [PMC free article] [PubMed] [Google Scholar]
- 40.Yeo BT, Krienen FM, Sepulcre J, Sabuncu MR, Lashkari D, Hollinshead M, et al. (2011): The organization of the human cerebral cortex estimated by intrinsic functional connectivity. J Neurophysiol. 106:1125–1165. [DOI] [PMC free article] [PubMed] [Google Scholar]
- 41.Iraji A, Deramus TP, Lewis N, Yaesoubi M, Stephen JM, Erhardt E, et al. (2019): The spatial chronnectome reveals a dynamic interplay between functional segregation and integration. Hum Brain Mapp. 40:3058–3077. [DOI] [PMC free article] [PubMed] [Google Scholar]
- 42.Bhinge S, Long Q, Calhoun VD, Adali T (2019): Spatial Dynamic Functional Connectivity Analysis Identifies Distinctive Biomarkers in Schizophrenia. Front Neurosci. 13:1006. [DOI] [PMC free article] [PubMed] [Google Scholar]
- 43.Boukhdhir A, Zhang Y, Mignotte M, Bellec P (2021): Unraveling reproducible dynamic states of individual brain functional parcellation. Netw Neurosci. 5:28–55. [DOI] [PMC free article] [PubMed] [Google Scholar]
- 44.Aine CJ, Bockholt HJ, Bustillo JR, Cañive JM, Caprihan A, Gasparovic C, et al. (2017): Multimodal Neuroimaging in Schizophrenia: Description and Dissemination. Neuroinformatics. 15:343–364. [DOI] [PMC free article] [PubMed] [Google Scholar]
- 45.Adhikari BM, Hong LE, Sampath H, Chiappelli J, Jahanshad N, Thompson PM, et al. (2019): Functional network connectivity impairments and core cognitive deficits in schizophrenia. Hum Brain Mapp. 40:4593–4605. [DOI] [PMC free article] [PubMed] [Google Scholar]
- 46.Power JD, Mitra A, Laumann TO, Snyder AZ, Schlaggar BL, Petersen SE (2014): Methods to detect, characterize, and remove motion artifact in resting state fMRI. Neuroimage. 84:320–341. [DOI] [PMC free article] [PubMed] [Google Scholar]
- 47.Uddin LQ, Betzel RF, Cohen JR, Damoiseaux JS, De Brigard F, Eickhoff SB, et al. (2022): Controversies and current progress on large-scale brain network nomenclature from OHBM WHATNET: Workgroup for HArmonized Taxonomy of NETworks.
- 48.Calhoun VD, Adali T, Pearlson GD, Pekar JJ (2001): A method for making group inferences from functional MRI data using independent component analysis. Hum Brain Mapp. 14:140–151. [DOI] [PMC free article] [PubMed] [Google Scholar]
- 49.Iraji A, Calhoun VD, Wiseman NM, Davoodi-Bojd E, Avanaki MRN, Haacke EM, et al. (2016): The connectivity domain: Analyzing resting state fMRI data using feature-based data-driven and model-based methods. Neuroimage. 134:494–507. [DOI] [PMC free article] [PubMed] [Google Scholar]
- 50.Du Y, Fan Y (2013): Group information guided ICA for fMRI data analysis. Neuroimage. 69:157–197. [DOI] [PubMed] [Google Scholar]
- 51.Iraji A, Faghiri A, Lewis N, Fu Z, Rachakonda S, Calhoun VD (2021): Tools of the trade: estimating time-varying connectivity patterns from fMRI data. Soc Cogn Affect Neurosci. 16:849–874. [DOI] [PMC free article] [PubMed] [Google Scholar]
- 52.Du Y, Allen EA, He H, Sui J, Wu L, Calhoun VD (2016): Artifact removal in the context of group ICA: A comparison of single-subject and group approaches. Hum Brain Mapp. 37:1005–1025. [DOI] [PMC free article] [PubMed] [Google Scholar]
- 53.Preti MG, Bolton TA, Van De Ville D (2017): The dynamic functional connectome: State-of-the-art and perspectives. NeuroImage. 160:41–54. [DOI] [PubMed] [Google Scholar]
- 54.Allen EA, Damaraju E, Plis SM, Erhardt EB, Eichele T, Calhoun VD (2014): Tracking whole-brain connectivity dynamics in the resting state. Cereb Cortex. 24:663–676. [DOI] [PMC free article] [PubMed] [Google Scholar]
- 55.Benjamini Y, Hochberg Y (1995): Controlling the False Discovery Rate: A Practical and Powerful Approach to Multiple Testing. Journal of the Royal Statistical Society Series B (Methodological). 57:289–300. [Google Scholar]
- 56.Trubetskoy V, Pardinas AF, Qi T, Panagiotaropoulou G, Awasthi S, Bigdeli TB, et al. (2022): Mapping genomic loci implicates genes and synaptic biology in schizophrenia. Nature. 604:502–508. [DOI] [PMC free article] [PubMed] [Google Scholar]
- 57.Trubetskoy V, Pardiñas AF, Qi T, Panagiotaropoulou G, Awasthi S, Bigdeli TB, et al. (2022): Mapping genomic loci implicates genes and synaptic biology in schizophrenia. Nature. 604:502–508. [DOI] [PMC free article] [PubMed] [Google Scholar]
- 58.Choi SW, Mak TSH, O’Reilly PF (2020): Tutorial: a guide to performing polygenic risk score analyses. Nat Protoc. 15:2759–2772. [DOI] [PMC free article] [PubMed] [Google Scholar]
- 59.Ma S, Calhoun VD, Phlypo R, Adalı T (2014): Dynamic changes of spatial functional network connectivity in healthy individuals and schizophrenia patients using independent vector analysis. Neuroimage. 90:196–206. [DOI] [PMC free article] [PubMed] [Google Scholar]
- 60.Friston K, Brown HR, Siemerkus J, Stephan KE (2016): The dysconnection hypothesis (2016). Schizophr Res. 176:83–94. [DOI] [PMC free article] [PubMed] [Google Scholar]
- 61.Fornito A, Zalesky A, Pantelis C, Bullmore ET (2012): Schizophrenia, neuroimaging and connectomics. Neuroimage. 62:2296–2314. [DOI] [PubMed] [Google Scholar]
- 62.van den Heuvel MP, Fornito A (2014): Brain networks in schizophrenia. Neuropsychol Rev. 24:32–48. [DOI] [PubMed] [Google Scholar]
- 63.Liu H, Kaneko Y, Ouyang X, Li L, Hao Y, Chen EY, et al. (2012): Schizophrenic patients and their unaffected siblings share increased resting-state connectivity in the task-negative network but not its anticorrelated task-positive network. Schizophr Bull. 38:285–294. [DOI] [PMC free article] [PubMed] [Google Scholar]
- 64.Walther S, Stegmayer K, Federspiel A, Bohlhalter S, Wiest R, Viher PV (2017): Aberrant Hyperconnectivity in the Motor System at Rest Is Linked to Motor Abnormalities in Schizophrenia Spectrum Disorders. Schizophr Bull. 43:982–992. [DOI] [PMC free article] [PubMed] [Google Scholar]
- 65.Avram M, Brandl F, Bäuml J, Sorg C (2018): Cortico-thalamic hypo- and hyperconnectivity extend consistently to basal ganglia in schizophrenia. Neuropsychopharmacology. 43:2239–2248. [DOI] [PMC free article] [PubMed] [Google Scholar]
- 66.Menon V, Palaniyappan L, Supekar K (2022): Integrative Brain Network and Salience Models of Psychopathology and Cognitive Dysfunction in Schizophrenia. Biol Psychiatry. [DOI] [PubMed] [Google Scholar]
- 67.Hu ML, Zong XF, Mann JJ, Zheng JJ, Liao YH, Li ZC, et al. (2017): A Review of the Functional and Anatomical Default Mode Network in Schizophrenia. Neurosci Bull. 33:73–84. [DOI] [PMC free article] [PubMed] [Google Scholar]
- 68.Sheffield JM, Barch DM (2016): Cognition and resting-state functional connectivity in schizophrenia. Neurosci Biobehav Rev. 61:108–120. [DOI] [PMC free article] [PubMed] [Google Scholar]
- 69.Meda SA, Ruaño G, Windemuth A, O’Neil K, Berwise C, Dunn SM, et al. (2014): Multivariate analysis reveals genetic associations of the resting default mode network in psychotic bipolar disorder and schizophrenia. Proc Natl Acad Sci U S A. 111:E2066–2075. [DOI] [PMC free article] [PubMed] [Google Scholar]
- 70.Skudlarski P, Jagannathan K, Anderson K, Stevens MC, Calhoun VD, Skudlarska BA, et al. (2010): Brain connectivity is not only lower but different in schizophrenia: a combined anatomical and functional approach. Biol Psychiatry. 68:61–69. [DOI] [PMC free article] [PubMed] [Google Scholar]
- 71.Mingoia G, Wagner G, Langbein K, Maitra R, Smesny S, Dietzek M, et al. (2012): Default mode network activity in schizophrenia studied at resting state using probabilistic ICA. Schizophr Res. 138:143–149. [DOI] [PubMed] [Google Scholar]
- 72.Orliac F, Naveau M, Joliot M, Delcroix N, Razafimandimby A, Brazo P, et al. (2013): Links among resting-state default-mode network, salience network, and symptomatology in schizophrenia. Schizophr Res. 148:74–80. [DOI] [PubMed] [Google Scholar]
- 73.Wolf ND, Sambataro F, Vasic N, Frasch K, Schmid M, Schönfeldt-Lecuona C, et al. (2011): Dysconnectivity of multiple resting-state networks in patients with schizophrenia who have persistent auditory verbal hallucinations. J Psychiatry Neurosci. 36:366–374. [DOI] [PMC free article] [PubMed] [Google Scholar]
- 74.Brand BA, de Boer JN, Dazzan P, Sommer IE (2022): Towards better care for women with schizophrenia-spectrum disorders. Lancet Psychiatry. 9:330–336. [DOI] [PubMed] [Google Scholar]
- 75.Sommer IE, Tiihonen J, van Mourik A, Tanskanen A, Taipale H (2020): The clinical course of schizophrenia in women and men-a nation-wide cohort study. NPJ Schizophr. 6:12. [DOI] [PMC free article] [PubMed] [Google Scholar]
- 76.Mamah D, Barch DM, Repovš G (2013): Resting state functional connectivity of five neural networks in bipolar disorder and schizophrenia. J Affect Disord. 150:601–609. [DOI] [PMC free article] [PubMed] [Google Scholar]
- 77.Yarkoni T, Poldrack RA, Nichols TE, Van Essen DC, Wager TD (2011): Large-scale automated synthesis of human functional neuroimaging data. Nat Methods. 8:665–670. [DOI] [PMC free article] [PubMed] [Google Scholar]
- 78.DeLisi LE (2001): Speech disorder in schizophrenia: review of the literature and exploration of its relation to the uniquely human capacity for language. Schizophr Bull. 27:481–496. [DOI] [PubMed] [Google Scholar]
- 79.Chang X, Collin G, Xi Y, Cui L, Scholtens LH, Sommer IE, et al. (2017): Resting-state functional connectivity in medication-naïve schizophrenia patients with and without auditory verbal hallucinations: A preliminary report. Schizophr Res. 188:75–81. [DOI] [PubMed] [Google Scholar]
- 80.Cui LB, Liu K, Li C, Wang LX, Guo F, Tian P, et al. (2016): Putamen-related regional and network functional deficits in first-episode schizophrenia with auditory verbal hallucinations. Schizophr Res. 173:13–22. [DOI] [PubMed] [Google Scholar]
- 81.Mueser KT, Bellack AS, Brady EU (1990): Hallucinations in schizophrenia. Acta Psychiatr Scand. 82:26–29. [DOI] [PubMed] [Google Scholar]
- 82.McCarthy-Jones S, Smailes D, Corvin A, Gill M, Morris DW, Dinan TG, et al. (2017): Occurrence and co-occurrence of hallucinations by modality in schizophrenia-spectrum disorders. Psychiatry Res. 252:154–160. [DOI] [PubMed] [Google Scholar]
- 83.Salisbury DF, Kohler J, Shenton ME, McCarley RW (2020): Deficit Effect Sizes and Correlations of Auditory Event-Related Potentials at First Hospitalization in the Schizophrenia Spectrum. Clin EEG Neurosci. 51:198–206. [DOI] [PMC free article] [PubMed] [Google Scholar]
- 84.Woodward ND, Karbasforoushan H, Heckers S (2012): Thalamocortical dysconnectivity in schizophrenia. Am J Psychiatry. 169:1092–1099. [DOI] [PMC free article] [PubMed] [Google Scholar]
- 85.Wei Y, Xue K, Yang M, Wang H, Chen J, Han S, et al. (2022): Aberrant Cerebello-Thalamo-Cortical Functional and Effective Connectivity in First-Episode Schizophrenia With Auditory Verbal Hallucinations. Schizophr Bull. 48:1336–1343. [DOI] [PMC free article] [PubMed] [Google Scholar]
- 86.Cao H, Ingvar M, Hultman CM, Cannon T (2019): Evidence for cerebello-thalamo-cortical hyperconnectivity as a heritable trait for schizophrenia. Transl Psychiatry. 9:192. [DOI] [PMC free article] [PubMed] [Google Scholar]
- 87.Chan RC, Xu T, Heinrichs RW, Yu Y, Wang Y (2010): Neurological soft signs in schizophrenia: a meta-analysis. Schizophr Bull. 36:1089–1104. [DOI] [PMC free article] [PubMed] [Google Scholar]
- 88.Bombin I, Arango C, Buchanan RW (2005): Significance and meaning of neurological signs in schizophrenia: two decades later. Schizophr Bull. 31:962–977. [DOI] [PubMed] [Google Scholar]
- 89.Javitt DC, Sweet RA (2015): Auditory dysfunction in schizophrenia: integrating clinical and basic features. Nat Rev Neurosci. 16:535–550. [DOI] [PMC free article] [PubMed] [Google Scholar]
Associated Data
This section collects any data citations, data availability statements, or supplementary materials included in this article.