

Abstract
Traction Force Microscopy (TFM) derives maps of cell-generated forces, typically in the nN range, transmitted to the extracellular environment upon actuation of complex biological processes. In traditional approaches, force rendering requires a terminal, time-consuming step of cell deadhesion to obtain a reference image. A conceptually opposite approach is provided by reference-free methods, opening to the on-the-fly generation of force maps from an ongoing experiment. This requires an image processing algorithm keeping the pace of the biological phenomena under investigation. Here, we introduce an integrated software pipeline rendering force maps from single reference-free TFM images seconds to minutes after their acquisition. The algorithm tackles image processing, reference image estimation, and finite element analysis as a single problem, yielding a robust and fully automatic solution. The method’s capabilities are demonstrated in two applications. First, the mechanical annihilation of cancer cells is monitored as a function of rising environmental temperature, setting a population threshold at 45°C. Second, the fast temporal correlation of forces produced across individual cells is used to map physically connected adhesion points, yielding typical lengths that vary as function of the cell cycle phase.
Introduction
Forces transmitted by mammalian cells to the extracellular environment contribute fundamental signals and actuation mechanisms to complex biological processes, including migration, organogenesis and tissue repair [1, 2]. Among cellular forces, actomyosin-generated cell contractility in the nN range, can be estimated by means of optical methods which capture the deformation imposed by cells to the substrate [3]. These experimental approaches have evolved from simple qualitative observations [4] to the current family of traction force microscopy [5] protocols yielding force maps with high spatial resolution [6].
Despite these advancements, the accurate measurement of substrate deformations from optical images remains challenging. In particular, classical TFM techniques [6, 7] use stochastic patterns of randomly dispersed fluorescent beads in a continuous, compliant substrate [8]. Their intrinsic limitation is in the requirement of a reference, load-free image of the same field of view, to reveal the displacement of optical landmarks [3]. This is obtained upon de-adhesion of cells, implying that the force map can only be computed after the experiment is terminated, and thus hours after the original image is collected. For this reason, reference-based TFM methods are incompatible with on-the-fly computation of tractions during an ongoing experiment. In addition, they are not conducive to immunostaining [9]. A global pre-scanning [10] of each substrate before cell seeding, although theoretically possible, practically requires a lengthy setup and yields to limited resolution.
In reference-free methods, randomly dispersed fluorophores are replaced by precisely arranged, regular patterns of fiducial markers or force sensors [11–13]. Specifically, beds of silicone pillars or needles provide a well-established and scalable approach, which has seen its best application in the study of forces applied by individual adhesion points [13–18]. Upon force generation, flexible pillars are bent from their resting position and the ensuing deformation can be observed using fluorescence or transmission microscopy [19]. The resulting quantification provides a time-resolved force vector in correspondence of each pillar [13]. Tractions maps with sub-adhesion resolution can similarly be obtained in reference-free modality, using the, by comparison, confocal TFM (cTFM), an approach based on the decoration of a compliant, continuum elastomeric substrate with a regular distribution of electrohydrodynamic printed quantum dot (QD) discs with typical sizes in the nm range [9, 11]. Based on the high precision patterning of either pillars or QD nanodiscs, their load-free configuration can be numerically computed [11, 12]. Reference-free approaches are therefore conducive to the online determination of force maps from a single image, in turn opening the way to the iterative education of the ongoing experiment. This breakthrough development is, however, hampered by the poor automation of currently available in silico approaches, which are practically non-compatible with the online processing of large data sets acquired at high frequency.
Existing algorithmic solutions rely on the detection of large, undeformed regions in the image of interest. Polio et al. [12] uses a radon transform to align a regular grid to the regular regions [20] and then relies on PIV [8, 21, 22] to estimate the displacement field. cTFM [11] uses a Delaunay triangulation to bootstrap the detection (see Video 3 for the original method [11] and Video 1 for ours), and an exhaustive combinatorial search to reconstruct the displacements in the deformed regions. Weng at al. [23] relies on user interaction to identify regular regions by manually aligning one row of undeformed pillars (see Video 4 for the original method [23] and Video 2 for the same image processed with ours). In all cases, these methods cannot be used on problematic, yet very common, images with (i) large deformations, since the synthetic reference image is too different from the acquired one, (ii) lack of a sufficiently large undeformed regions, which is common in monolayer [24], and (iii) images containing the substrate boundary.
Here, we introduce Cellogram: the first analysis pipeline for reference-free TFM images which can robustly and automatically process the aforementioned problematic images, enabling batch processing of large image sequences. Our algorithmic solution includes automated image processing, reference state determination, and finite element analysis. An estimate of the displacements is computed in seconds, while the accurate force reconstruction is completed offline in minutes. The combination of these three steps is a black-box analysis pipeline with unprecedented efficiency, compatible with the online generation of force maps in long-term and/or high time resolution live cell experiments. These features are showcased by two challenging examples. First, using a cTFM approach, we explore the temperature dependence of cellular force generation in cancer cells and define a threshold value for thermally induced mechanical annihilation. Second, using micro-pillar arrays, we detect the time correlation between forces exerted by cells on individual adhesions, which provides a functional estimation of the typical length of basal stress fibers. Altogether, these experimental settings yield an online information flow, which provides access to additional layers of information and is far beyond the reach of the existing state of the art.
The Analysis Algorithm
Cellogram automatically converts images featuring optical landmarks (QD nanodiscs or pillars; [11, 13]) into traction forces. Specifically, the algorithm detects the fiducial markers in the image, estimates their reference positions, and, depending on the reference-free methodology used, either estimates forces directly from displacements (pillars) or runs a finite element analysis to calculate the actuating tractions (QDs). Figure 1 a, shows a schematic view of the process, while Figure 1 b demonstrates it on an experimental image. Note that Figure 1 (c-h) provide statistics for both reference-free methodologies (first 2 columns pillars, last two columns QDs), but given the difference between the processes the timings are not directly comparable. For most experimental images (more than 95%), the processing is fully automatic. Minimal user interaction is required in the remaining cases in which high local deformations, substrate defects, or low image quality create ambiguities.
Figure 1.
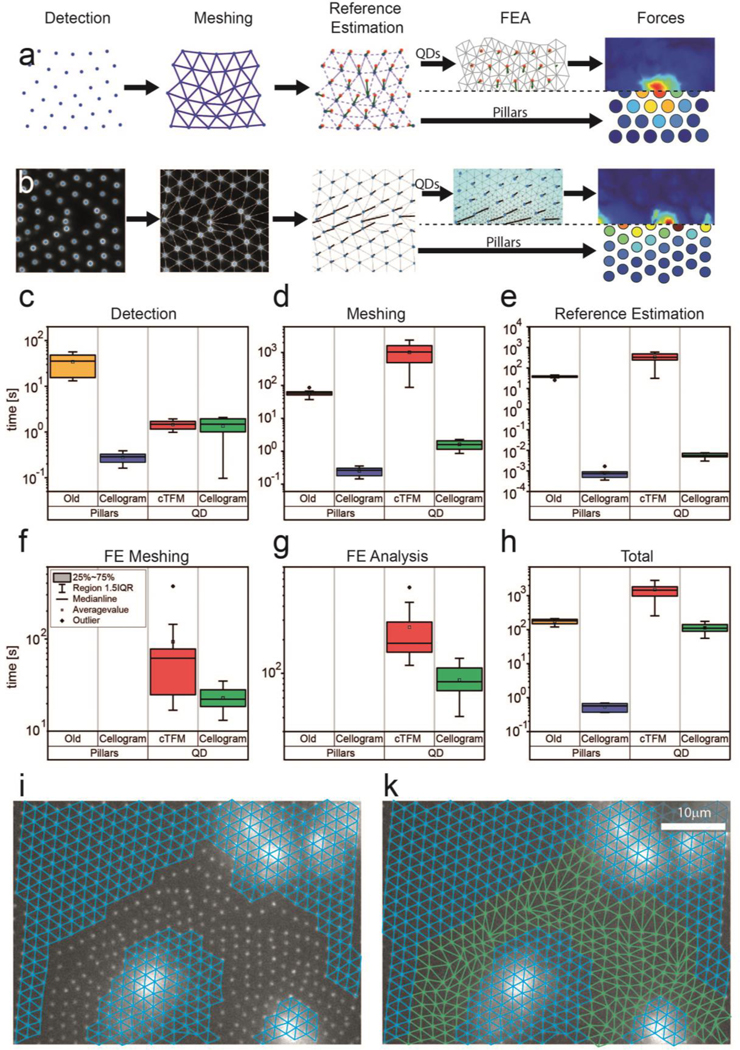
Processing pipeline improvements (a) Schematic of the Cellogram processing pipeline. (b) Software screenshots of the Cellogram pipeline corresponding to the steps in (a). (c-g) comparison of computation times for individual pipeline stages in Cellogram and previously used software on 10 images each. (h) Computation time comparison for the total analysis time per image. (i) Unsuccessful meshing attempt in cTFM (j) Completed meshing in Cellogram
When compared to existing solvers [11, 23, 25–27], Cellogram proves superior in terms of calculation time for all sub-processes (Figure 1 c-g) and is overall at least one or several orders of magnitude faster (Figure 1 h). Note that the timing of the detection step is similar between cTFM and Cellogram (Figure 1 c) since the same algorithm was used. Considering the application to cTFM, the new computational approach is compatible with imaging at a time resolution of 5 s for the online estimation of displacements (for approximately 3,000 landmarks). This enables the generation of full traction maps fully automatically in less than 2 min. This time resolution compares with an average of more than 20 min for the previous method, which requires significant user input [11]. For the application to the analysis of forces on arrays of deformable pillars, the fully automatic processing time is reduced to less than a second. This compares with 5 min of manual interaction for previous methods [23].
In addition to the fast and automatic generation of force maps, which can run in parallel with the ongoing image acquisition at high temporal and spatial resolution, Cellogram extends the analysis to all available images, including those featuring large substrate deformation. This includes data, which proved unsolvable using previous approaches. In these settings, reference-free TFM becomes a routine technique (Figure 1 i, j), which can be applied to study transient processes, without investing large amounts of time or requiring trained users. Together, the increase in speed and robustness opens up reference-free platforms to high throughput TFM and high temporal resolution online TFM. In what follows, examples are presented in which the new capabilities are fully exploited.
Temperature dependence of traction forces generated by cancer cells
Localized temperature increase provides an efficient and non-invasive mechanism to ablate unresectable tumors in soft tissues [28]. A safe application of thermal ablation must ensure the complete eradication of the metastatic seeds, while minimizing the collateral damage to the surrounding healthy tissues. In this context, it is relevant to evaluate the sensitivity of cancer cells to increasing temperatures, up to the definition of a threshold value at which adhesion and force generation are compromised. A state which, together with genetic and metabolic damage [29], irreversibly leads to cell death [30]. The response of cancer cells to hyperthermia is therefore a clinically relevant biological phenomenon which requires a statistically significant number of observations, with high temporal and spatial resolution, to distil a reliable trend of temperature dependency from a cell population.
Some information is available regarding the integrity of the cell cytoskeleton and integrin mediated adhesion at low temperatures (i.e. below 37°C; [31]). However, a time-resolved evaluation of the mechanical cell response to supraphysiological thermal conditions remains unexplored. We approached this problem using cTFM to visualize substrate deformations induced by HeLa cells in a temperature-controlled environment. This cell line was selected as its biochemical and adhesion properties are well described [32].
To verify that the selected reference-free method can capture dynamic variations of acto-myosin contractility, HeLa cells were treated with Blebbistatin, a general myosin inhibitor (Figure 2 a-c; [33]). In particular, cells were imaged for 140 min upon addition of 50 μm of the drug to the culture medium [33]. Tractions exerted by individual cells on the compliant substrate decreased rapidly in the first 60 min, to then reach a stable plateau at ~40% of the initial strain energy (Figure 2 c).
Figure 2.

Mechanical and thermal annihilation of cancer cells. (a) Temporal variation of tractions exerted by HeLa cells upon treatment with Blebbistatin (50 μm). Representative example of cellular traction maps (upper panels) and corresponding brightfield images (BF, lower panels). Scale bar is 10 μm. (b-c) Population analysis reporting the displacement (b) and strain energy/area (c) relative to the values measured before treatment (i.e. Time = 0 min). A red or blue line defines the average value. The shaded area corresponds to the standard error of the mean. (d-g) Mechanical response of HeLa cells to increasing environmental temperature. (d) Representative example of cellular traction maps (left panels) and corresponding brightfield images (BF, right panels). Scale bar is 10 μm. (e) Corresponding evolution of traction, strain energy and area relative to the values measured at 37°C. Population analysis reporting the displacement (f) and strain energy/area (g) relative to the values measured at 37°C. A red or blue line defines the average value. The shaded area corresponds to the standard error of the mean. For all panels, n = number of individual measures, n’ = number of independent experiments.
Next, the mechanical adaptation of HeLa cells to thermal energy was investigated. Environmental temperature was gradually increased from 37°C to 45°C with a ΔT/t of 1°C/h. Multiple individual cells were imaged in parallel with a time resolution of 30 min. Cells initially (i.e. at 37°C) conveyed different levels of mechanical strain energy U to the substrate [34]. Yet, following a sufficient number of individual cells over time (~700 images), a general trend could be obtained (Figure 2 d-g). Cell-generated substrate deformation remained unvaried until the temperature of 42°C was reached (Figure 2 d, e). Interestingly, all cells increased significantly (>25%) their contractility during the time period in which temperature increased from 42 to 44°C. In this phase, cell surfaces started to shrink (Figure 2 d, e). Above 44°C, the mechanical activity of all monitored cells rapidly decreased (Figure 2 f, g) yielding an evident cell rounding. These results indicate that a threshold for the mechanical annihilation of HeLa cells is reached at 45°C, a value that is in good agreement with clinical reports [28].
Finally, to visualize the dynamics of focal adhesion disassembly upon the mechanical response to increasing temperature, the analysis was extended to cells expressing a fluorescent adhesion marker. For this, the thermal dependence of traction forces was evaluated in rat embryo fibroblasts (REF-52) stably transfected with a YFP-paxillin reporter (Supplementary Figure 7), a well-established model for the study of adhesion dynamics [35]. The overall response of these cells showed a monotone decrease of displacement and strain energy, with complete mechanical annihilation at 45°C. This phase coincided with the loss of visible focal adhesion (Supplementary Figure 7) and disassembly of the actin cytoskeleton (Supplementary Figure 8).
Spatial and temporal correlation of traction forces during the cell cycle
The contractile machinery of cells transmits tractions to the underlying substrate in a dynamic process that actuates spreading, shape change and migration [36]. Acto-myosin generated contractility is coupled to the extracellular environment by the physical interaction between ventral actin stress fibers and integrin-based contacts [37]. At the basal side of adherent cells, bundled actin filaments define linear connections between oppositely growing focal adhesions, therefore establishing tension across the cell body. While the typical architecture of these structural elements has been described, the interaction with the substrate and the resulting cell adaptation remain poorly understood [37].
Force sensor arrays comprising elastomeric posts with diameter and period of few microns offer a structured substrate to adhering cells, allowing the establishment of focal adhesions at the upper surface of individual pillars [13]. The resulting one-to-one interaction renders a digital, reference-free representation of the cell’s mechanical activity opening to the investigation of force transmission patterns during complex processes and their modulation in different phases of the cell cycle [9, 38]. In this direction, a spatial and temporal analysis of cell-generated tractions is possible, which however requires an agile and efficient approach to define the cross-correlation among several mechanical elements, at high frequency and over long periods of observation.
We approached this application using an array of deformable pillars (4 μm pitch, 1.8 μm diameter, 7.1 μm height and 2.5 MPa Young’s modulus) on which HeLa and MDCK cells expressing a Fucci cell-cycle phase sensor were seeded (Figure 3, [9, 39]). Individual cells were imaged for 160 min with a time resolution of Δt = 4 min, compatible with the typical dynamics of focal adhesion maturation [37]. The global analysis of pillar bending yielded a deformation vector for all individual elements at each time of measure. The pair-wise Pearson correlation coefficient of these field (on average 38 and 53 pillars per cell, for HeLa and MDCK; respectively) was then calculated (Supplementary Figure 9). Pillar couples on which force transmission increased or decreased at the same time received a positive correlation score (+1). Couples that on the contrary displayed an antithetic behavior received a negative correlation score (−1). Pairs of pillars which behaved independently or showed no bending had zero correlation (Supplementary Figure 9 a, b). This temporal correlation analysis was extended to all possible combinations of pillars interacting with individual cells, yielding a total of ~51 thousand analyzed pairs.
Figure 3.

Cell-cycle dependent correlation of traction forces. (a) Cell-cycle phase dependent nuclear colouring in HeLa cells expressing a Fucci reporter. Scale bar is 20 μm. (b, c) Representative inverted fluorescent images reporting the distribution of filamentous actin (Actin; b) and phosphorylated paxillin (pY-paxillin; c) in HeLa cells. Scale bar is 20 μm. (d) Boxplot reporting the calibration of actin stress fiber length in fixed samples. The bars extend from the 25th to the 75th percentile. A line in the box represents the mean value while the box height corresponds to its standard deviation. Individual measures are reported as open red circles. (e) Corresponding frequency distribution (in percentage) of measured values. (f, g) Correlation of traction forces as a function of interpillar distance for HeLa Fucci cells in the G1 (f) or S/G2 (g) phase of the cell cycle. A blue line defines the average value. The shaded blue area corresponds to the standard error of the mean. A dashed black line displays the exponential fit for the experimental data from which a typical length (correlation = 0.5) is extrapolated. (h) Colocalization of focal adhesions (individuated by the inverted fluorescent signal of pY-paxillin in fixed HeLa cells) and pillar tops (open red circles). Scale bar is 10 μm. (i-j) Colocalization of actin filaments (individuated by the inverted fluorescent signal of filamentous actin in fixed HeLa cells; i) and highest positive interpillar correlations (j). (k) Merged representation of panels i and j. (l-m) Corresponding analysis of traction force correlation during different phases of the cell cycle in MDCK cells. Correlation of traction forces as a function of interpillar distance for MDCK cells in the G1 (l) or S/G2 (m) phase. A blue line defines the average value. The shaded blue area corresponds to the standard error of the mean. A dashed black line displays the exponential fit for the experimental data from which a typical length (correlation = 0.5) is extrapolated. (n) Average time of engagement for pillars interacting with HeLa or MDCK cells in the G1 or S/G2 phase of the cell cycle. For all panels, n = number of individual measures, n’ = number of independent experiments.
Negative temporal correlation between paired pillar movements (i.e. smaller than −0.75) was seldom detected (0.01%). This result indicates that cellular forces are not likely to generate sliding or oscillation of rigid bodies. On the other hand, significant positive correlation (i.e. larger than 0.75) was evident for specific couples of pillars (17.2%), which increased or decreased deformation at the same time along the entire observation period (Figure 3 and Supplementary Figure 9). Correlated elements moved together, compatibly with the increase or decrease of contractile actuation. Based on this global analysis, a plot of temporal correlation as function of the distance between the considered elements was obtained (Figure 3 f, g and l, m for HeLa cells and MDCK; respectively). In general, the correlation between pillar couples decreased exponentially at increasing interpillar distance (Figure 3 f-g, l-n).
The temporal correlation analysis was extended to cancerous and normal epithelial cells along the cell cycle to investigate how the dynamic patterns of force transmission vary as function of the cell cycle phase. In particular, HeLa cells in the G1 phase, the most mechanically active [9, 38], yielded a correlation distance up to 40 μm with average values of 18 μm. The transition to the ensuing S/G2 phase reduced the average correlation length to 12 μm (Figure 3 a and f-g). Corresponding values were obtained when the actual length of actin stress fibers was measured in fixed specimens (average and maximal length of 15 ± 0.5 μm and 44.5 μm; respectively. Figure 3 b-e). Consistently, focal adhesions were established in correspondence of individual pillars and positively correlated pillar pairs aligned along visible stress fibres (Figure 3 h-k).
The same investigation was performed on MDCK cells stably expressing the Fucci sensor, rendering however a different picture (Figure 3 l-n). Subconfluent cells (single cells or small islands of 2–4 cells) showed shorter actin fibers (average and maximal length of 6.5 ± 0.5 μm and 20.5 μm; respectively. Supplementary Figure 10) mostly restricted to the cell periphery. Cells displayed a dynamic pattern of pillar bending whereby individual pillars were engaged and deformed for short periods of time (10 ± 4 min and 14 ± 4 min for MDCK cells in G1 or S/G2; respectively. Figure 3 n) as compared to the corresponding values measured in HeLa cells (35 ± 4 min and 42 ± 4 min; for HeLa cells in G1 or S/G2; respectively. Figure 3 n) supporting more active shape changes. The temporal analysis of tractions exerted on pillars by MDCK cells revealed shorter correlation distances (Figure 3 m, n and Supplementary Figure 7) with no significant differences between the G1 and S/G2 phase.
Altogether, the on-the-fly representation of tractions exerted by cells on pillar arrays was compatible with the temporal and spatial analysis of force correlation. Forces exerted by HeLa cells displayed stable correlations over long distances, particularly extended in the G1 phase of the cell cycle. On the contrary, MDCK cells generated a more dynamic pattern of tractions resulting in limited force correlation along the entire cell cycle. This pattern supported higher motility and active shape changes consistent with a mesenchymal phenotype typical of subconfluent epithelial cells [40].
Discussion
The Cellogram algorithm applies to reference-free TFM methods. Quickly after the acquisition of a fluorescent image, it provides a full representation of traction forces computed from the displacement of fiducial markers (Figure 1). Therefore, the mechanical activity of cells becomes accessible at the pace of the biological phenomenon under study opening to high resolution and high-throughput TFM, reducing, and in most cases eliminating completely, the extensive manual labour required by previous algorithms for reference-free TFM. In addition to describing the algorithm and providing a public, reference implementation, we showcase these new possibilities in two applications based on complementary reference-free TFM technologies.
cTFM Approach [11]:
A temperature increase above 37°C affects membrane fluidity and permeability, leading to cell volume and surface reduction and eventually to cell death [41]. Cellogram was used to render the mechanical response of HeLa and REF-52 cells to increasing environmental temperature (Figure 2 and Supplementary Figures 7 and 8). The resulting population analysis revealed a threshold value at which the cytoskeleton and focal adhesions to the substrate were thermally destabilized (at 45°C) and cells mechanically annihilated. In cancer cells, this phase was preceded by a transient increase of substrate deformation, which may be caused by a rapid cell membrane retraction while cells are still holding on their adhesion to the substrate.
Micro-Pillar Arrays [23]:
Mechanically active stress fibers have a typical length between 10 and 100 μm, depending on the cell type and activity [37]. This specific architecture was never linked to the cell cycle phase. The application of Cellogram enabled the processing of large datasets reporting the dynamic deformation of elastomeric pillars interacting with HeLa and MDCK cells expressing a fluorescent reporter of the cell cycle phase (Figure 3). The resolved spatial and temporal cross-correlation analysis revealed a typical fingerprint of force generation which coincided with the extension of stress fibers. Specific variations along the cell cycle were revealed in cancer cells, whereby the G1 phase featured high correlation over longer distances (up to 40 μm) consistent a with high mechanical activity [9].
Materials and Methods
Cell Culture
Cells were cultured in an incubator at 37°C and in 5% CO2 humidified atmosphere. For the temperature series on the QD nanodisc array substrates HeLa cells (American Type Culture Collection; ATCC) and rat embryonic fibroblasts stably expressing YFP-Paxillin (REF-52; [35]) were used. They were cultured in high-glucose Dulbecco’s modified Eagle’s medium (DMEM) supplemented with 2 mM L-Glutamine, 100 U/ml penicillin, 100 μg/ml streptomycin, and 10% fetal bovine serum. For cell cycle synchronization, HeLa cells were pre-incubated overnight with the G2/M blocker RO-3306 [42] at a final concentration of 10 μm. The experiments were started at a temperature of 37°C degrees. The rate of temperature increase was set to one Celsius per hour. The temperature of the cell culture medium was measured with TSic temperature sensors (IST AG, Switzerland) and cells were imaged every 30 min.
For the cell cycle experiments we used HeLa [39] and MDCK [43] cells stably transfected with the Fucci2 biomarker and seeded them on micro-contact printed micropillars. The MDCK-Fucci stable cell line was a gift from A. Cavalcanti Adam. The cells were seeded onto the pillar array 12 to 18 h prior to the experiment. Images were taken every 4 min for a total of 160 min.
Live-cell imaging
Cells were allowed to spread on the target substrates overnight before imaging. Temperature, CO2 and humidity were controlled during imaging using an incubation chamber. QD nanodisc array imaging was performed with a Nikon TI N DIC with a 60x oil immersion objective with 1.35 NA. Micropillar array imaging was done with a Zeiss Axio Observer. Z1 and 40X (EC Plan-NEOFLUAR 40x/0.75) objective with 0.55 NA.
Substrate preparation
Arrays of QD nanodiscs were generated as reported in [11]. Briefly, the QDs were deposited on the substrate by electrohydrodynamic nanodrip-printing [44]. The colloidal ink containing the QDs is ejected from a micro-sized gold-coated nozzle in an electric field onto the elastomeric substrate. By modulating the electric field and position of the substrate the QDs are deposited in a controlled orderly fashion. The electro-hydrodynamic nanodrip-printing technology can be commercially obtained through an ETH Zurich spin-off company (http://www.scrona.ch). Before performing the experiments, the temperature dependence of the substrate mechanical properties was evaluated, resulting perfectly stable within the analyzed temperature range [45]. The surfaces were homogenously coated with fibronectin as previously reported [11].
The PDMS micropillar array was manufactured by a two-step molding process [46–49]. First, a Si, master mold was created using photo lithography. The master mold was used to create a negative mold using a 10:1 Polydimethylsiloxane (PDMS) solution, (w/w, base: curing agent Sylgard 184, Dow, Corning). This negative mold was functionalized with oxygen plasma and Trichloro (1H,1H,2H,2H-perfluorooctyl) silane and placed it on top of a cover glass with a drop of 10:1 PDMS and cured for 40 hours in 110 °C. The PDMS negative mold was then peeled off to recover the PDMS micropillar arrays.
To visualize and functionalize the PDMS micropillar, micro-contact printing was used to modify the top of PDMS micropillar with fluorescent ECM proteins to promote cell attachment. 7 mm x 7 mm 30:1 PDMS stamp were treated with 30 μL of mixed solution drops comprising of fibronectin (50 μg/ml; Sigma-Aldrich) and Alexa-Fluor 647-conjugated fibrinogen (25 μg/ml; Life Technologies) for 1 h at room temperature. Treated PDMS stamps were rinsed with distilled (DI) water and blown dry with nitrogen gas. Meanwhile, PDMS micropillar arrays were pre-treated with ultraviolet (UV) ozone for 7 min in a UVO cleaner (Jelight). Functionalized PDMS stamp was placed in contact with the top of the PDMS micropillar arrays. Through this process, the functionalization proteins were transferred from the PDMS stamps to the tops of PDMS micropillar. PDMS stamp was removed and the PDMS micropillar array was washed by pure ethanol, 70% ethanol and DI water. 0.2% Pluronic (Sigma-Aldrich) solution was used to block the un-stamped regions of the PDMS micropillar array. After 60 min of immersion, DI water and PBS (Life Technologies) was used to wash away the excess Pluronic solution.
Immunofluorescence
Cells were fixed with 4% paraformaldehyde in phosphate-buffered saline (PBS) for 10 min at room temperature (RT) and permeabilized with 0.5% Triton in PBS for 10 min. After blocking with 5% bovine serum albumin (BSA) in PBS for 1 h, samples were incubated at 4°C overnight with primary antibodies. The following commercial primary antibody was used: rabbit anti-phospho-paxillin Tyr118, Cell Signaling (#2541S), dilution: 1:100 [50]. Secondary antibody was Alexa Fluor 647 chicken anti-rabbit, Life Technologies (#A-21443), used at 1:200 for 1 h at RT. Actin cytoskeleton has been stained with Alexa Fluor 555 phalloidin, Life Technologies (#A34055), while nuclei were stained with Hoechst, Sigma (#H6024).
Temporal and spatial correlation
Temporal correlation calculations were performed using MATLAB’s ‘corrcoef’ function (Figure 3 f, g, l, m and Supplementary Figure 7). Here, the full temporal displacement profiles for pillars were correlated against each other to find the highest Pearson correlation coefficients. Pillars showing displacement profiles that deflect simultaneously with similar magnitudes have higher correlation coefficients.
For the spatial correlation (Figure 3 j, k) at a fixed time point, the correlation coefficient or similarity coefficient was defined as , where and are the displacement vectors for two pillars, respectively. This yields a value of 1 for displacements in the same direction and magnitude, −1 for opposite direction but same magnitude, and 0 for perpendicular vectors. Hence, two vectors with spatial correlation of −1 are being pulled together with the same force.
Statistics
Statistical comparison of population means was performed using a non-parametric Mann-Whitney U test (α = 0.05). All quantitative measurements reported are expressed as average values ± the standard error of the mean. The analysis was always based on three or more independent experiments.
Supplementary Material
Acknowledgements
We thank Francesca Michela Pramotton, Raoul Hopf, and Magaly Reyes for input during analysis and Sally Reynolds for her artistic interpretation of Cellogram leading to the app icon. We acknowledge the Computational Image Analysis in Cell and Developmental Biology in Woods Hole for providing T.L. with C code for the detection of particles.
Funding Sources
T.L. was supported by funding from the ETH-grant ETH-12 15-1. This work was partially supported by the NSF CAREER award 1652515, the NSF grant 1835712, the SNSF grant P2TIP2_175859, a gift from Adobe Research, the American Heart Association Scientist Development Grant (16SDG31020038).
REFERENCES
- [1].Barriga EH, Franze K, Charras G, Mayor R, Tissue stiffening coordinates morphogenesis by triggering collective cell migration in vivo, Nature 554(7693) (2018) 523–527. [DOI] [PMC free article] [PubMed] [Google Scholar]
- [2].Brugues A, Anon E, Conte V, Veldhuis JH, Gupta M, Colombelli J, Munoz JJ, Brodland GW, Ladoux B, Trepat X, Forces driving epithelial wound healing, Nature physics 10(9) (2014) 683–690. [DOI] [PMC free article] [PubMed] [Google Scholar]
- [3].Roca-Cusachs P, Conte V, Trepat X, Quantifying forces in cell biology, Nature cell biology 19(7) (2017) 742–751. [DOI] [PubMed] [Google Scholar]
- [4].Harris AK, Wild P, Stopak D, Silicone rubber substrata: a new wrinkle in the study of cell locomotion, Science 208(4440) (1980) 177–9. [DOI] [PubMed] [Google Scholar]
- [5].Oliver T, Dembo M, Jacobson K, Traction forces in locomoting cells, Cell Motil Cytoskeleton 31(3) (1995) 225–40. [DOI] [PubMed] [Google Scholar]
- [6].Colin-York H, Shrestha D, Felce JH, Waithe D, Moeendarbary E, Davis SJ, Eggeling C, Fritzsche M, Super-Resolved Traction Force Microscopy (STFM), Nano letters 16(4) (2016) 2633–8. [DOI] [PMC free article] [PubMed] [Google Scholar]
- [7].Escribano J, Sunyer R, Sanchez MT, Trepat X, Roca-Cusachs P, Garcia-Aznar JM, A hybrid computational model for collective cell durotaxis, Biomechanics and modeling in mechanobiology 17(4) (2018) 1037–1052. [DOI] [PubMed] [Google Scholar]
- [8].Han SJ, Oak Y, Groisman A, Danuser G, Traction microscopy to identify force modulation in subresolution adhesions, Nat Methods 12(7) (2015) 653–6. [DOI] [PMC free article] [PubMed] [Google Scholar]
- [9].Panagiotakopoulou M, Lendenmann T, Pramotton FM, Giampietro C, Stefopoulos G, Poulikakos D, Ferrari A, Cell cycle-dependent force transmission in cancer cells, Molecular biology of the cell 29(21) (2018) 2528–2539. [DOI] [PMC free article] [PubMed] [Google Scholar]
- [10].Park CY, Zhou EH, Tambe D, Chen B, Lavoie T, Dowell M, Simeonov A, Maloney DJ, Marinkovic A, Tschumperlin DJ, Burger S, Frykenberg M, Butler JP, Stamer WD, Johnson M, Solway J, Fredberg JJ, Krishnan R, High-throughput screening for modulators of cellular contractile force, Integr Biol (Camb) 7(10) (2015) 1318–24. [DOI] [PMC free article] [PubMed] [Google Scholar]
- [11].Bergert M, Lendenmann T, Zundel M, Ehret AE, Panozzo D, Richner P, Kim DK, Kress SJ, Norris DJ, Sorkine-Hornung O, Mazza E, Poulikakos D, Ferrari A, Confocal reference free traction force microscopy, Nature communications 7 (2016) 12814. [DOI] [PMC free article] [PubMed] [Google Scholar]
- [12].Polio SR, Parameswaran H, Canovic EP, Gaut CM, Aksyonova D, Stamenovic D, Smith ML, Topographical control of multiple cell adhesion molecules for traction force microscopy, Integr Biol (Camb) 6(3) (2014) 357–65. [DOI] [PubMed] [Google Scholar]
- [13].Tan JL, Tien J, Pirone DM, Gray DS, Bhadriraju K, Chen CS, Cells lying on a bed of microneedles: an approach to isolate mechanical force, Proceedings of the National Academy of Sciences of the United States of America 100(4) (2003) 1484–9. [DOI] [PMC free article] [PubMed] [Google Scholar]
- [14].Sniadecki NJ, Anguelouch A, Yang MT, Lamb CM, Liu Z, Kirschner SB, Liu Y, Reich DH, Chen CS, Magnetic microposts as an approach to apply forces to living cells, Proceedings of the National Academy of Sciences of the United States of America 104(37) (2007) 14553–8. [DOI] [PMC free article] [PubMed] [Google Scholar]
- [15].Sarangi BR, Gupta M, Doss BL, Tissot N, Lam F, Mege RM, Borghi N, Ladoux B, Coordination between Intra- and Extracellular Forces Regulates Focal Adhesion Dynamics, Nano letters 17(1) (2017) 399–406. [DOI] [PMC free article] [PubMed] [Google Scholar]
- [16].De Luca M, Polimeni A, Fonseka HA, Meaney AJ, Christianen PC, Maan JC, Paiman S, Tan HH, Mura F, Jagadish C, Capizzi M, Magneto-optical properties of wurtzite-phase InP nanowires, Nano letters 14(8) (2014) 4250–6. [DOI] [PubMed] [Google Scholar]
- [17].Paulitschke P, Keber F, Lebedev A, Stephan J, Lorenz H, Hasselmann S, Heinrich D, Weig EM, Ultraflexible Nanowire Array for Label- and Distortion-Free Cellular Force Tracking, Nano letters 19(4) (2019) 2207–2214. [DOI] [PubMed] [Google Scholar]
- [18].Sniadecki NJ, Lamb CM, Liu Y, Chen CS, Reich DH, Magnetic microposts for mechanical stimulation of biological cells: fabrication, characterization, and analysis, The Review of scientific instruments 79(4) (2008) 044302. [DOI] [PMC free article] [PubMed] [Google Scholar]
- [19].Zeng D, Ferrari A, Ulmer J, Veligodskiy A, Fischer P, Spatz J, Ventikos Y, Poulikakos D, Kroschewski R, Three-dimensional modeling of mechanical forces in the extracellular matrix during epithelial lumen formation, Biophysical journal 90(12) (2006) 4380–91. [DOI] [PMC free article] [PubMed] [Google Scholar]
- [20].D.B.a.E. Dufresne, The Matlab Particle Tracking Code Repository, 2019. http://site.physics.georgetown.edu/matlab/.
- [21].Kompenhans J, Reichmuth J, 2-D flow field measurements in wind tunnels by means of particle image velocimetry, International Congress on Applications of Lasers & Electro-Optics 1987(2) (1987) 119–126. [Google Scholar]
- [22].Tseng Q, Duchemin-Pelletier E, Deshiere A, Balland M, Guillou H, Filhol O, Thery M, Spatial organization of the extracellular matrix regulates cell-cell junction positioning, Proceedings of the National Academy of Sciences of the United States of America 109(5) (2012) 1506–11. [DOI] [PMC free article] [PubMed] [Google Scholar]
- [23].Weng S, Shao Y, Chen W, Fu J, Mechanosensitive subcellular rheostasis drives emergent single-cell mechanical homeostasis, Nature Materials 15 (2016) 961. [DOI] [PMC free article] [PubMed] [Google Scholar]
- [24].Malinverno C, Corallino S, Giavazzi F, Bergert M, Li Q, Leoni M, Disanza A, Frittoli E, Oldani A, Martini E, Lendenmann T, Deflorian G, Beznoussenko GV, Poulikakos D, Haur OK, Uroz M, Trepat X, Parazzoli D, Maiuri P, Yu W, Ferrari A, Cerbino R, Scita G, Endocytic reawakening of motility in jammed epithelia, Nat Mater 16(5) (2017) 587–596. [DOI] [PMC free article] [PubMed] [Google Scholar]
- [25].Goedecke N, Bollhalder M, Bernet R, Silvan U, Snedeker J.J.J.o.v.e.J., Easy and accurate mechano-profiling on micropost arrays, (105) (2015). [DOI] [PMC free article] [PubMed] [Google Scholar]
- [26].Lemmon CA, Sniadecki NJ, Ruiz SA, Tan JL, Romer LH, Chen CSJM, MCB c.o.b., Shear force at the cell-matrix interface: enhanced analysis for microfabricated post array detectors, 2(1) (2005) 1. [PMC free article] [PubMed] [Google Scholar]
- [27].Lam RH, Weng S, Lu W, Fu JJIB, Live-cell subcellular measurement of cell stiffness using a microengineered stretchable micropost array membrane, 4(10) (2012) 1289–1298. [DOI] [PMC free article] [PubMed] [Google Scholar]
- [28].Chu KF, Dupuy DE, Thermal ablation of tumours: biological mechanisms and advances in therapy, Nature reviews. Cancer 14(3) (2014) 199–208. [DOI] [PubMed] [Google Scholar]
- [29].Warters RL, Roti Roti JL, Hyperthermia and the cell nucleus, Radiation research 92(3) (1982) 458–62. [PubMed] [Google Scholar]
- [30].Nikfarjam M, Muralidharan V, Christophi C, Mechanisms of focal heat destruction of liver tumors, The Journal of surgical research 127(2) (2005) 208–23. [DOI] [PubMed] [Google Scholar]
- [31].Rico F, Chu C, Abdulreda MH, Qin Y, Moy V.T.J.B.j., Temperature modulation of integrin-mediated cell adhesion, 99(5) (2010) 1387–1396. [DOI] [PMC free article] [PubMed] [Google Scholar]
- [32].Wu Y, Pan S, Luo W, Lin SH, Kuang J, Hp95 promotes anoikis and inhibits tumorigenicity of HeLa cells, Oncogene 21(44) (2002) 6801–8. [DOI] [PubMed] [Google Scholar]
- [33].Wolfenson H, Bershadsky A, Henis YI, Geiger B, Actomyosin-generated tension controls the molecular kinetics of focal adhesions, Journal of cell science 124(Pt 9) (2011) 1425–32. [DOI] [PMC free article] [PubMed] [Google Scholar]
- [34].Butler JP, Tolic-Nørrelykke IM, Fabry B, Fredberg J.J.J.A.J.o.P.-C.P., Traction fields, moments, and strain energy that cells exert on their surroundings, 282(3) (2002) C595–C605. [DOI] [PubMed] [Google Scholar]
- [35].Cavalcanti-Adam EA, Volberg T, Micoulet A, Kessler H, Geiger B, Spatz JP, Cell spreading and focal adhesion dynamics are regulated by spacing of integrin ligands, Biophysical journal 92(8) (2007) 2964–74. [DOI] [PMC free article] [PubMed] [Google Scholar]
- [36].Sarangi BR, Gupta M, Doss BL, Tissot N, Lam F, Mege RM, Borghi N, Ladoux B, Coordination between Intra- and Extracellular Forces Regulates Focal Adhesion Dynamics, Nano letters 17(1) (2017) 399–406. [DOI] [PMC free article] [PubMed] [Google Scholar]
- [37].Livne A, Geiger B, The inner workings of stress fibers - from contractile machinery to focal adhesions and back, Journal of cell science 129(7) (2016) 1293–304. [DOI] [PubMed] [Google Scholar]
- [38].Panagiotakopoulou M, Bergert M, Taubenberger A, Guck J, Poulikakos D, Ferrari A, A Nanoprinted Model of Interstitial Cancer Migration Reveals a Link between Cell Deformability and Proliferation, ACS Nano 10(7) (2016) 6437–48. [DOI] [PubMed] [Google Scholar]
- [39].Sakaue-Sawano A, Kurokawa H, Morimura T, Hanyu A, Hama H, Osawa H, Kashiwagi S, Fukami K, Miyata T, Miyoshi HJC, Visualizing spatiotemporal dynamics of multicellular cell-cycle progression, 132(3) (2008) 487–498. [DOI] [PubMed] [Google Scholar]
- [40].du Roure O, Saez A, Buguin A, Austin RH, Chavrier P, Silberzan P, Ladoux B, Force mapping in epithelial cell migration, Proceedings of the National Academy of Sciences of the United States of America 102(7) (2005) 2390–5. [DOI] [PMC free article] [PubMed] [Google Scholar]
- [41].Fajardo LF, Egbert B, Marmor J, Hahn GM, Effects of hyperthermia in a malignant tumor, Cancer 45(3) (1980) 613–23. [DOI] [PubMed] [Google Scholar]
- [42].Vassilev LT, Tovar C, Chen S, Knezevic D, Zhao X, Sun H, Heimbrook DC, Chen L.J.P.o.t.N.A.o.S., Selective small-molecule inhibitor reveals critical mitotic functions of human CDK1, 103(28) (2006) 10660–10665. [DOI] [PMC free article] [PubMed] [Google Scholar]
- [43].Uroz M, Wistorf S, Serra-Picamal X, Conte V, Sales-Pardo M, Roca-Cusachs P, Guimera R, Trepat X, Regulation of cell cycle progression by cell-cell and cell-matrix forces, Nature cell biology 20(6) (2018) 646–654. [DOI] [PubMed] [Google Scholar]
- [44].Galliker P, Schneider J, Eghlidi H, Kress S, Sandoghdar V, Poulikakos D.J.N.c., Direct printing of nanostructures by electrostatic autofocussing of ink nanodroplets, 3 (2012) 890. [DOI] [PubMed] [Google Scholar]
- [45].Johnston I, McCluskey D, Tan C, Tracey M.J.J.o.M., Microengineering, Mechanical characterization of bulk Sylgard 184 for microfluidics and microengineering, 24(3) (2014) 035017. [Google Scholar]
- [46].du Roure O, Saez A, Buguin A, Austin RH, Chavrier P, Siberzan P, Ladoux B, Force mapping in epithelial cell migration, Proceedings of the National Academy of Sciences of the United States of America 102(7) (2005) 2390. [DOI] [PMC free article] [PubMed] [Google Scholar]
- [47].Fu J, Wang Y-K, Yang MT, Desai RA, Yu X, Liu Z, Chen CS, Mechanical regulation of cell function with geometrically modulated elastomeric substrates, Nature Methods 7 (2010) 733. [DOI] [PMC free article] [PubMed] [Google Scholar]
- [48].Saez A, Buguin A, Silberzan P, Ladoux B, Is the Mechanical Activity of Epithelial Cells Controlled by Deformations or Forces?, Biophysical journal 89(6) (2005) L52–L54. [DOI] [PMC free article] [PubMed] [Google Scholar]
- [49].Yang MT, Fu J, Wang Y-K, Desai RA, Chen CS, Assaying stem cell mechanobiology on microfabricated elastomeric substrates with geometrically modulated rigidity, Nature Protocols 6 (2011) 187. [DOI] [PMC free article] [PubMed] [Google Scholar]
- [50].Mekhdjian AH, Kai F, Rubashkin MG, Prahl LS, Przybyla LM, McGregor AL, Bell ES, Barnes JM, DuFort CC, Ou G.J.M.b.o.t.c, Integrin-mediated traction force enhances paxillin molecular associations and adhesion dynamics that increase the invasiveness of tumor cells into a three-dimensional extracellular matrix, 28(11) (2017) 1467–1488. [DOI] [PMC free article] [PubMed] [Google Scholar]
Associated Data
This section collects any data citations, data availability statements, or supplementary materials included in this article.