

Abstract
Chronic infections by hepatitis B virus (HBV) and hepatitis C virus (HCV) appear to be the most significant causes of hepatocellular carcinoma (HCC). Aberrant promoter methylation is known to be deeply involved in cancer, including in HCC. In this study, we analyzed aberrant promoter methylation by methylated DNA immunoprecipitation‐on‐chip analysis on a genome‐wide scale in six HCCs including three HBV‐related and three HCV‐related HCCs, six matched noncancerous liver tissues, and three normal liver tissues. Candidate genes with promoter methylation were detected more frequently in HCV‐related HCC. Candidate genes methylated preferentially to HBV‐related or HCV‐related HCCs were detected and selected, and methylation levels of the selected genes were validated by quantitative methylation analysis using MALDI‐TOF mass spectrometry using 125 liver tissue samples, including 61 HCCs (28 HBV‐related HCCs and 33 HCV‐related HCCs) and 59 matched noncancerous livers, and five normal livers. Among analyzed genes, preferential methylation in HBV‐related HCC was validated in one gene only. However, 15 genes were found to be methylated preferentially in HCV‐related HCC, which was independent from age. Hierarchical clustering of HCC using these genes stratified HCV‐related HCC as a cluster of frequently methylated samples. The 15 genes included genes inhibitory to cancer‐related signaling such as RAS/RAF/ERK and Wnt/β‐catenin pathways. Methylation of dual specificity phosphatase 4 (DUSP4), cytochrome P450, family 24, subfamily A, polypeptide 1 (CYP24A1), and natriuretic peptide receptor A (NPR1) significantly correlated with recurrence‐free survival. It was indicated that genes methylated preferentially in HCV‐related HCC exist, and that DNA methylation might play an important role in HCV‐related HCC by silencing cancer‐related pathway inhibitors, and might perhaps be useful as a prognostic marker. (Cancer Sci 2010)
Hepatocellular carcinoma (HCC) is the sixth most common malignancy and the third most common cause of cancer mortality in the world, accounting for 598 000 deaths in 2002.( 1 ) Among numerous causative factors suggested, chronic infection caused by hepatitis B virus (HBV) and/or hepatitis C virus (HCV) has been defined as the main risk factor for HCC development. Chronic HBV infection is the predominant risk factor for HCC in South‐East Asia and Africa, whereas chronic HCV infection is predominant in Western countries and Japan.( 2 ) HBV, DNA‐containing virus, and HCV, RNA‐containing virus, belong to two different viral families, Hepadnaviridae and Flaviviridae, respectively.( 3 ) They show different characteristics in carcinogenesis and clinical presentation of HCC. It is reported that about 10% of HBV‐carriers grow into chronic hepatitis patients, 20% of which transform into liver cirrhosis (LC) and HCC. Hepatitis B virus can also cause HCC in the absence of LC through the pathway of integration into the human genome.( 4 , 5 ) On the other hand, more than 60% of HCV‐carriers grow into LC and mostly develop to HCC over several decades. The onset of HCV‐related HCC is later than that of HBV‐related HCC.( 4 , 5 )
Hepatocellular carcinoma is caused by genetic or epigenetic alterations.( 6 , 7 , 8 ) The genetic alterations include chromosomal instability with point mutations and deletions. Chromosomal instability of CDKN2A and TP53 loci was observed in HCC, and mutations of AXIN1 and PIK3CA were more frequently seen in HBV‐related HCC than in HCV‐related HCC.( 9 )
Aberrant DNA methylation of promoter CpG islands has been described as one of the major epigenetic alterations in human cancers,( 10 , 11 ) including HCC.( 12 , 13 ) It has been reported that methylation of promoter CpG islands of the p16 tumor suppressor gene occur in 73% of HCC tissues,( 14 ) and in 56% of HBV‐related HCC and 84% of HCV‐related HCC.( 15 ) Yang et al. reported that methylation of suppressor of cytokine signaling 1 (SOCS1), adenomatous polyposis coli (APC), and p15 was more frequently observed in HCV‐related HCC than in HBV‐related HCC.( 16 ) This may be a consequence of the involvement of different genetic/epigenetic pathways in the process of carcinogenesis in HBV‐ and HCV‐related HCC, and the occurrence of HBV‐related HCC mainly through chromosomal instability, whereas HCV‐related HCC may be more involved with aberrant DNA methylation,( 17 , 18 ) and there may be genes methylated preferentially to HCV‐related HCC.
To enable high‐resolution mapping of DNA methylation, we reported methylated DNA immunoprecipitation (MeDIP)‐chip analysis on short oligonucleotide array using unbiased amplification of MeDIP products by in vitro transcription,( 19 ) and applied the method to genome‐wide DNA methylation analysis of colorectal cancer.( 20 ) In the present study, we analyzed aberrant promoter methylation in six HCC clinical samples (including three HBV‐related HCCs and three HCV‐related HCCs) and noncancerous tissues on a genome‐wide scale by the method. Candidate regions of promoter methylation preferentially to HBV‐related HCC and HCV‐related HCC were selected, and the methylation levels of these genes were measured quantitatively using MALDI‐TOF mass spectrometry (MassARRAY).
Materials and Methods
Clinical samples and cell lines. Twenty‐eight HBV‐related HCC and 26 matched noncancerous liver tissues, and 33 HCV‐related HCC and 33 matched noncancerous liver tissues, were obtained from HCC patients, and five normal liver samples were obtained from colorectal cancer patients with liver metastasis, who underwent surgical liver resection at Tokyo University Hospital from August 1998 to June 2006, with written informed consent. Clinicopathological information is shown in Table 1. Tissues were kept frozen at −80°C until use. Normal liver tissue was extracted with enough margins from cancer and it was confirmed microscopically that no cancer cells were included. Five liver cancer cell lines, Huh7, Huh6, HepG2, Alex, and Hep3B, were obtained from the American Tissue Culture Collection (Manassas, VA, USA). Human peripheral lymphocyte DNA was obtained from Coriell Cell Repositories (Camden, NJ, USA). DNA was extracted using a QIAamp DNA Micro Kit (Qiagen, Hilden, Germany), and RNA using TRIzol (Invitrogen, Carlsbad, CA, USA). This study was certified by Ethics Committee of the University of Tokyo.
Table 1.
Clinicopathological features in HBV‐ and HCV‐related HCC patients
| Features | HBV+ (n = 28) | HCV+ (n = 33) | Normal liver (n = 5) | P‐value |
|---|---|---|---|---|
| Gender | ||||
| Male/female | 23/5 | 20/13 | 4/1 | 0.093 |
| Age (years) | ||||
| Mean ± SE | 58.1 ± 1.9 | 67.1 ± 1.3 | 59.8 ± 2.2 | <0.0001* |
| Background | ||||
| Normal | 1 | 0 | 0.44 | |
| Hepatitis | 13 | 13 | ||
| Liver cirrhosis | 14 | 20 | ||
| Tumor size (cm) | ||||
| <3.0 | 7 | 15 | 0.18 | |
| ≥3.0 | 20 | 18 | ||
| NA | 1 | |||
| Differentiation | ||||
| Well | 8 | 15 | 0.29 | |
| Moderate | 16 | 16 | ||
| Poor | 4 | 2 | ||
| AFP (ng/mL) | ||||
| >60 | 10 | 14 | 0.61 | |
| <60 | 18 | 19 | ||
| PIVKAII (mAU/mL) | ||||
| >40 | 15 | 14 | 0.45 | |
| <40 | 13 | 19 | ||
*P < 0.05. Background, surrounding liver tissue around hepatocellular carcinoma (HCC). AFP, alpha fetoprotein; HBV+, serum hepatitis B virus surface antigen (+); HCV+, serum anti‐hepatitis C virus antibody (+); NA, information not available; PIVKAII, protein induced by vitamin K absence or antagonist II.
5‐Aza‐2′‐deoxycytidine and Trichostatin A treatment. Liver cancer cell lines were seeded at a density of 3 × 10⁵ cells/10‐cm dish on Day 0, and exposed to 1, 3, or 10 μM 5‐aza‐2′‐deoxycytidine on Days 1, 2, and 3. Trichostatin A treatment was performed on Day 3 at a dose of 300 nM. Medium was changed every 24 h, and cells were harvested on Day 4.
Methylated DNA immunoprecipitation‐chip analysis. Methylated DNA immunoprecipitation‐chip using Human Promoter 1.0R tiling array (Affymetrix, Santa Clara, CA, USA), which covered 199 543 165 bp and 4 071 296 CpG sites around over 25 500 promoter regions, was performed as we previously reported.( 19 , 20 ) Briefly, 6 μg each of genomic DNA of six clinical HCC samples, six matched noncancerous liver tissues, and three normal livers were fragmented by sonication, and immunoprecipitated by anti 5‐methylcytocine monoclonal antibody (kindly supplied by Dr K. Watanabe, Toray Research Center, Tokyo, Japan). MeDIP and input samples underwent unbiased amplification by in vitro transcription. Amplified cRNA was converted into cDNA. cDNA was hybridized by promoter tiling array twice for both MeDIP and input samples (i.e. 60 arrays in total for the 15 samples). Within a window of 550 bp, the duplicated data from MeDIP DNA was compared with duplicated data from input DNA using the Wilcoxon rank sum test to calculate P‐values to detect candidate methylation sites. MeDIP‐chip data is available at GEO datasets (Nagae et al., #GSE19665).
Bisulfite treatment. Bisulfite conversion of DNA was performed as previously described.( 21 ) After ultrasonic fragmentation of DNA in 30 s, 1 μg of DNA was denatured in 0.3 N NaOH and then subjected to 15 cycles of 30 s at 95°C and 15‐min incubation in 3.6 M sodium bisulfite and 0.6 mM hydroquinone at 50°C. The samples were desalted with the Wizard DNA Clean‐Up system (Promega, Madison, WI, USA), desulfonated in 0.3 N NaOH at room temperature for 5 min, and then purified by ethanol precipitation. Finally, bisulfite‐treated DNA was dissolved in 80 μL of distilled water.
Quantitative methylation analysis. Methylation levels were measured using MassARRAY (Sequenom, San Diego, CA, USA).( 20 , 22 ) Bisulfite‐treated DNA was amplified by PCR, PCR product was transcribed by in vitro transcription (IVT) and the RNA was cleaved by RNaseA. Unmethylated cytosine was converted to uracil by bisulfite treatment, that is thymine in PCR product and finally adenine (A) in IVT product. Methylated cytosine was not converted, that is cytosine in PCR product, and finally guanine (G) in IVT product. Methylation status was determined by the mass difference between A and G in cleaved RNA product. Quantitative methylation scores were obtained at each analytic unit of a cleaved product, referred to as “CpG unit”, which could comprise one to several CpG sites.
Primers were designed to include no CpG site or only one CpG site in the 5′ region of primers; these are shown in Supporting information, Table S1. Human peripheral lymphocyte DNA was used as diploid human DNA, and amplified with the GenomiPhi v2 DNA amplification kit (GE Healthcare Lifescience, Piscataway, NJ, USA). The amplified DNA was not methylated at all in any CpG sites, and was used as unmethylated (0%) control. The amplified DNA was also methylated by SssI methylase (New England Biolabs, Beverly, MA, USA) and used as a fully methylated (100%) control. By mixing the 0% and 100% control samples, partially methylated control samples (25%, 50%, and 75%) were generated.( 20 )
Expression microarray analysis. mRNA expression in 10 HCCs and the 10 matched noncancerous liver samples was analyzed by GeneChip Human Genome U133 plus 2.0 oligonucleotide arrays (Affymetrix). For global normalization, the average signal in an array was made equal to 100. Expression array data for the 20 samples is available at GEO datasets (#GSE19665).
Quantitative PCR analysis. Real‐time reverse transcription‐polymerase chain reaction (RT‐PCR) was performed as previously reported.( 23 ) cDNA was synthesized from 1 μg of total RNA treated with DNase I (Ambion, Austin, TX, USA) with a Superscript III kit (Invitrogen). Real‐time RT‐PCR was done with SYBR Green PCR Core Reagents (PE Biosystems, Foster City, CA, USA) and an iCycler Thermal Cycler (Bio‐Rad Laboratories, Hercules, CA, USA). The quantity of mRNA of each gene in a sample was measured by comparing with standard samples that contained 101 to 106 copies of the genes, and was normalized to that of actin, beta (ACTB). The PCR primers and conditions are shown in Supporting information, Table S2.
Statistical analysis. Correlation between HBV‐ or HCV‐related HCC and clinicopathological features was analyzed by Fisher’s exact test for all except age, for which the t‐test was used. Methylation levels of HBV‐ and HCV‐related HCC were compared by t‐test. The frequency of methylation was compared with clinicopathological features by Fisher’s exact test. Fisher’s exact test and t‐test were performed with JMP 8 software (http://www.jmp.com). Hierarchical clustering was analyzed based on uncentered correlation and average linkage clustering algorism in sample direction using Cluster 3.0 software based on DNA methylation level. The dendrogram and heat map were constructed using TreeView software (http://rana.lbl.gov/EisenSoftware.htm). Disease‐free survival analysis by Kaplan–Meier method was performed with JMP 8 software and P‐values were calculated by log‐rank test. The end of the follow‐up period was 60 months from the primary surgery and the mean follow‐up time of the cases was 51 months (n = 58). HCC recurrence was the primary end point and deaths by other causes were censored.
Results
Methylated DNA immunoprecipitation‐chip analysis. Six clinical HCC samples and their matched noncancerous liver tissues and three normal livers were analyzed by MeDIP‐chip. Genes that possessed regions with P < 10−2 within 1 kb ± transcription start site were regarded as candidate genes with promoter methylation (Fig. 1).
Figure 1.
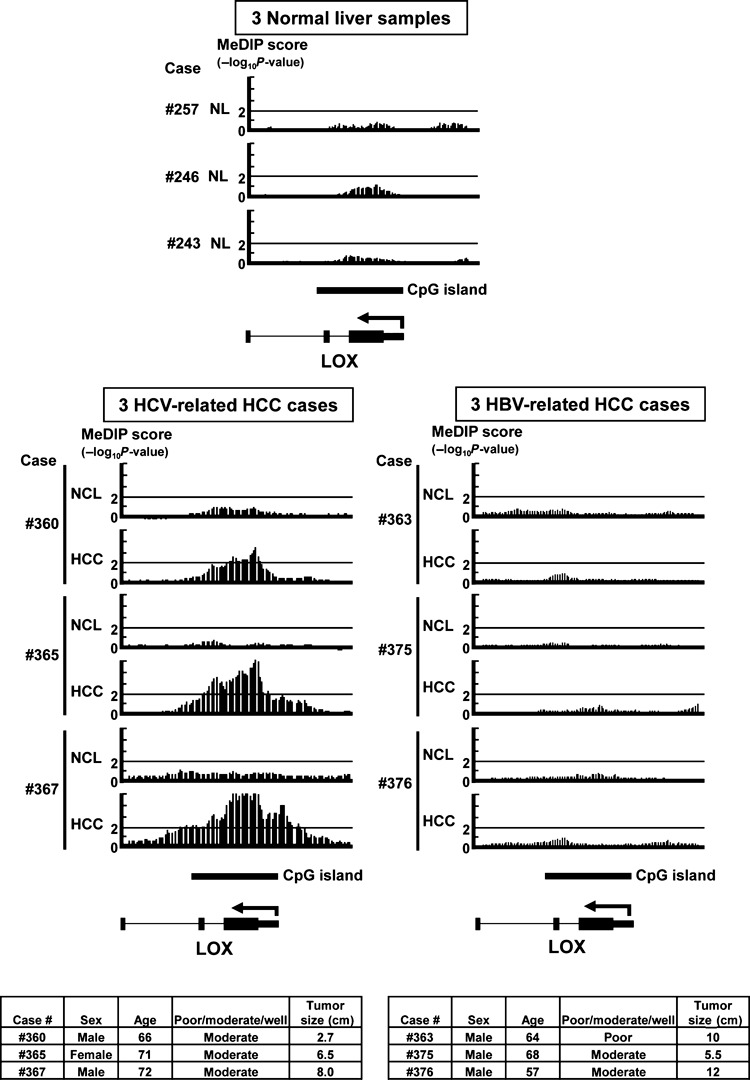
Representative data from methylated DNA immunoprecipitation (MeDIP)‐chip analysis. NCL, noncancerous liver tissue; NL, normal liver. MeDIP‐chip score (y‐axis) was shown by −log10 P‐value, and regions with score >2 (i.e. P < 10−2) were regarded to be candidate methylation regions. LOX possessed regions with P < 10−2 within 1 kb ± transcription start site, and was regarded as a candidate gene with promoter methylation in three hepatitis C virus (HCV)‐related hepatocellular carcinomas (HCCs), but not in the remaining samples. Clinical information for six HCC cases used for MeDIP‐chip analysis are shown at the bottom.
Among candidate genes with promoter methylation, 1421 genes were methylated in at least two of six HCCs but not in any matched noncancerous liver tissues nor in any normal liver tissues (Fig. 2a). Among these 1421 genes, 666 genes showed methylation only in HCV‐related HCC, 696 genes showed methylation in both HBV‐ and HCV‐related HCC, and 59 genes showed methylation only in HBV‐related HCC. Candidate methylation was detected more frequently in HCV‐related HCC than in HBV‐related HCC.
Figure 2.
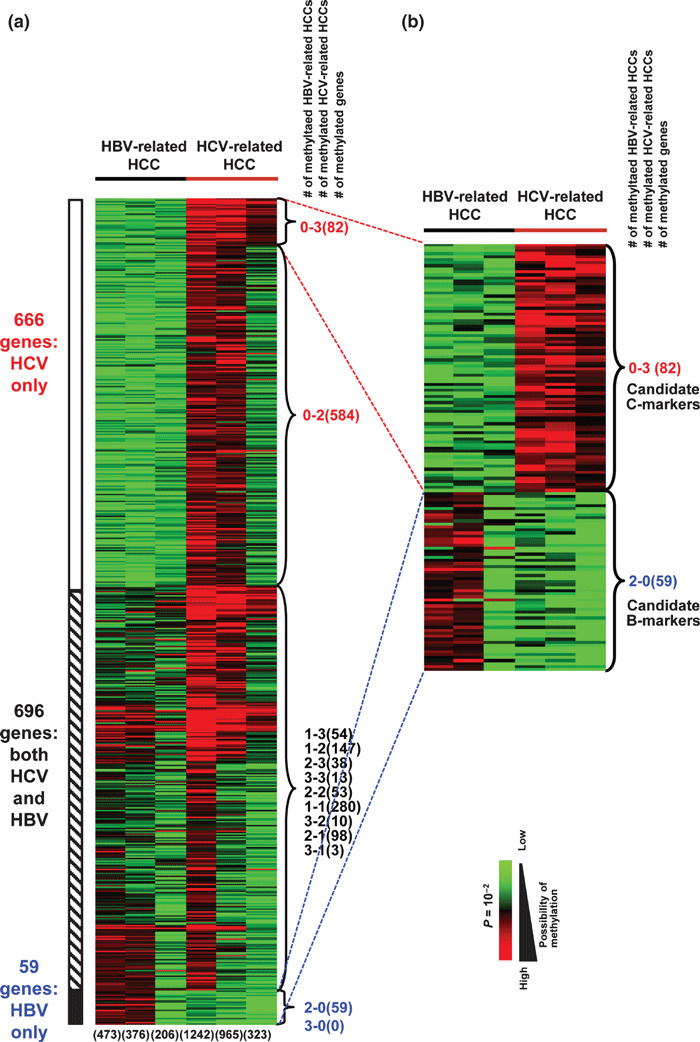
Heat map of genes methylated in methy‐lated DNA immunoprecipitation (MeDIP)‐chip. (a) Heat map of 1421 genes that were methylated in at least two of six hepatocellular carcinomas (HCCs) but unmethylated in matched noncancerous liver tissues and normal liver tissues. The six numbers at the bottom show the number of genes methylated in each case. The three numbers at the right side of heat map show the numbers of hepatitis B virus (HBV)‐ and hepatitis C virus (HCV)‐related HCC cases with methylation, and the number of genes included (in parentheses). (b) Heat map of 82 candidate C‐marker genes and 59 candidate B‐marker genes.
Among 666 candidate genes with methylation only in HCV‐related HCC, 82 genes were methylated in three HCV‐related HCCs but no HBV‐related HCC, and were regarded as candidate genes methylated preferentially in HCV‐related HCC (C‐markers, hereafter) (Fig. 2b). Among 59 candidate genes with methylation only in HBV‐related HCC, however, we did not detect any genes methylated in three HBV‐related HCCs but no HCV‐related HCC. Instead, the 59 genes methylated in two of three HBV‐related HCCs but no HCV‐related HCC were regarded as candidate genes methylated preferentially in HBV‐related HCC (B‐markers, hereafter) (Fig. 2b). Among these 82 and 59 genes, 26 and 14 candidate C‐ and B‐markers, respectively, were selected for further analysis (Supporting information Fig. S1 and Supporting information Table S3).
Quantitative methylation analysis in clinical samples. We first analyzed methylation levels of control samples (0%, 25%, 50%, 75%, 100% methylation) by MassARRAY and validated the quantitativity of each primer set (Supporting information Fig. S2). Among 40 genes, primer sets for 31 genes including 23 candidate C‐markers and eight candidate B‐markers were validated in regard to quantitativity and used for further analysis (Supporting information Fig. S1). The amplicons of 31 analyzed regions included 6902 bp and 334 CpG units derived from 548 CpG sites. Methylation scores were measurable at 200 CpG units derived from 310 CpG sites by MassARRAY (Supporting information Table S1).
Comparison of promoter methylation with mRNA expression of the candidate genes. For methylation validation, promoter methylation levels of the 31 genes were measured by MassARRAY for the six pairs of HCC and matched noncancerous livers used in MeDIP, as well as four additional pairs. The average methylation rates in HBV‐ and HCV‐related HCC were compared. Eighteen of the 23 candidate C‐markers showed a methylation difference >20% (Fig. 3a). Using the methylation increase value of HCC compared to the matched noncancerous livers, hierarchical clustering analysis stratified a group of five HCV‐related HCCs as samples with higher methylation (Fig. 3b). Expression of these genes was analyzed in 10 pairs of HCC by expression microarrays, and we observed a decrease of expression to <0.5‐fold mainly in HCV‐related HCC samples, suggesting gene silencing by promoter methylaion (Fig. 3c). To confirm gene silencing by promoter methylation, methylation levels in five liver tumor cell lines were analyzed by MassARRAY (Fig. 4a). If the methylation level of a gene was >75% in a cell line, the expression level of the gene in the methylated cell line and its re‐expression after 5‐aza‐2′‐deoxycytidine/Trichostatin A treatment were analyzed by real‐time RT‐PCR. All analyzed genes showed very low expression level in methylated cell lines, and showed up‐regulation after 5‐aza‐2′‐deoxycytidine treatment alone or with Trichostatin A treatment, suggesting that the genes were silenced by promoter methylation in HCC (Fig. 4b).
Figure 3.
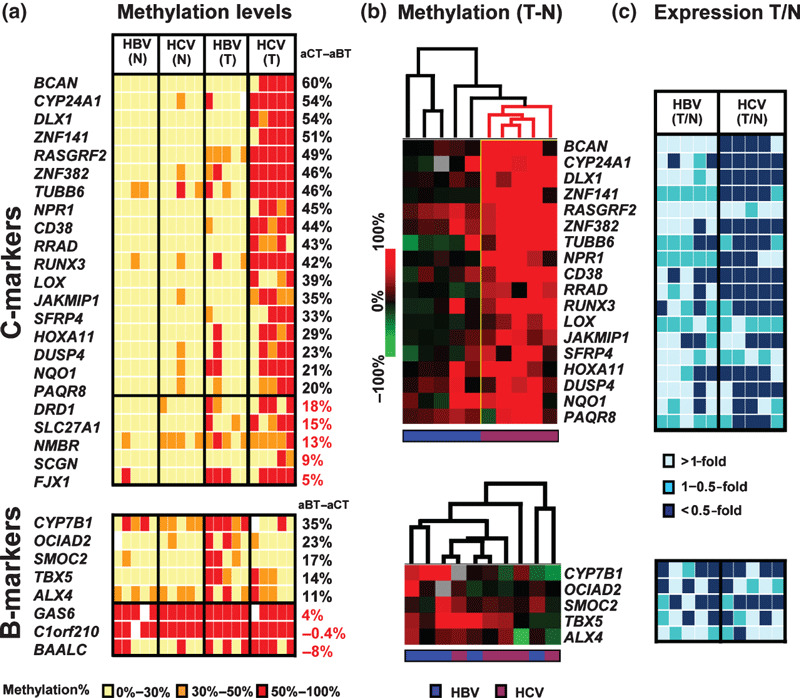
Relationship between promoter methy‐lation and mRNA expression of the candidate genes. (a) Methylation levels measured by MassARRAY in 10 pairs of hepatocellular carcinoma (HCC) (T) and matched noncancerous liver samples (N) including the six pairs analyzed by methylated DNA immunoprecipitation (MeDIP). Yellow, orange, red, white boxes: methylation rate 0–30%, 30–50%, 50–100%, no data, respectively. aCT, aBT: average methylation level of hepatitis C virus (HCV)‐related HCC, and that of hepatitis B virus (HBV)‐related HCC, respectively. (b) Heat map of the 18 genes with aCT–aBT values ≥20% (upper) and six genes with aBT–aCT values ≥10% (lower). Methylation data was shown by methylation increase in the HCC sample compared to matched noncancerous liver. Blue, HBV‐related HCC. Violet, HCV‐related HCC. (c) Levels of mRNA expression detected by GeneChip in 10 pairs of HCC and matched noncancerous liver. Light‐blue, blue, dark‐blue: >1‐fold, 0.5–1‐fold, <0.5‐fold expression (calculated using GeneChip scores) in HCC compared to matched noncancerous liver, respectively.
Figure 4.
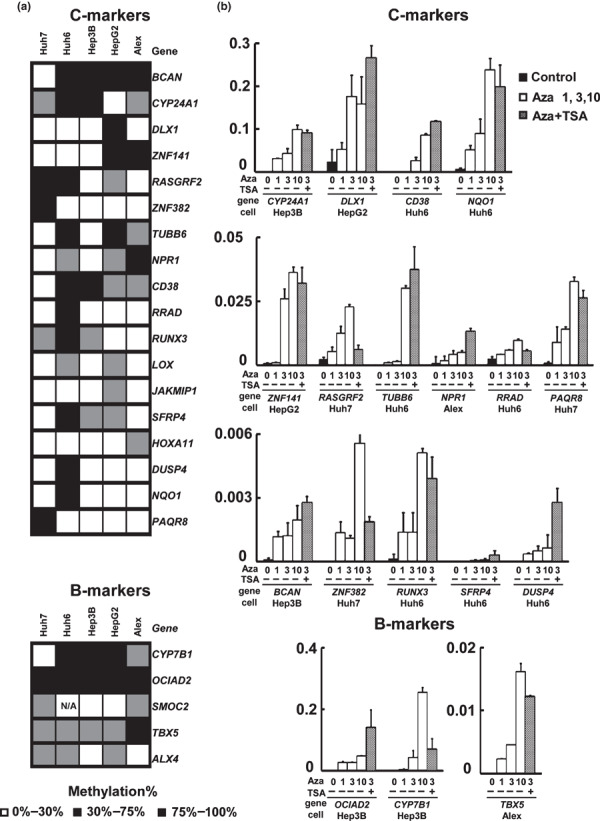
Re‐expression analysis by treatment with 5‐aza‐2′‐deoxycytidine/Trichostatin A. (a) Methylation levels in five liver tumor cell lines. White, 0–30%; gray, 30–75%; black, 75–100%. (b) Gene expression levels analyzed by quantitative reverse transcription‐polymerase chain reaction (RT‐PCR). Gene re‐expression was analyzed in cell lines with gene methylation level >75% if any, and normalized to that of ACTB. All the analyzed genes showed very low expression level in methylated cell lines, and showed up‐regulation after 5‐aza‐2′‐deoxycytidine treatment or with additional Trichostatin A treatment. Aza 1, 3, 10 refers to treatment by 1, 3, 10 μM of 5‐aza‐2′‐deoxycytidine. TSA+, 300 nM of Trichostatin A.
On the other hand, only two of eight candidate B‐markers showed >20% as a difference of methylation rate (Fig. 3a). Though five of the eight genes showing a difference >10% were used as tentative B‐markers for clustering and expression analyzes (Fig. 3b,c), we did not observe a cluster of methylated HBV‐related HCC nor decreased expression preferentially to HBV‐related methylation.
DNA methylation status in 125 clinical samples. Methylation levels were measured by MassARRAY in an expanded number of samples, that is 33 pairs of HCV‐related HCC and matched noncancerous liver tissues, 28 HBV‐related HCCs and 26 matched noncancerous liver samples, and five normal liver samples (Fig. 5a). All the 18 validated C‐markers were significantly more methylated in HCV‐related HCC compared with HBV‐related HCC (P < 0.05, t‐test). As for the five tentative B‐markers, however, only two genes, cytochrome P450, family 7, subfamily B, polypeptide 1 (CYP7B1) and T‐box 5 (TBX5), showed significantly more frequent hypermethylation in HBV‐related HCC (P < 0.05, t‐test).
Figure 5.
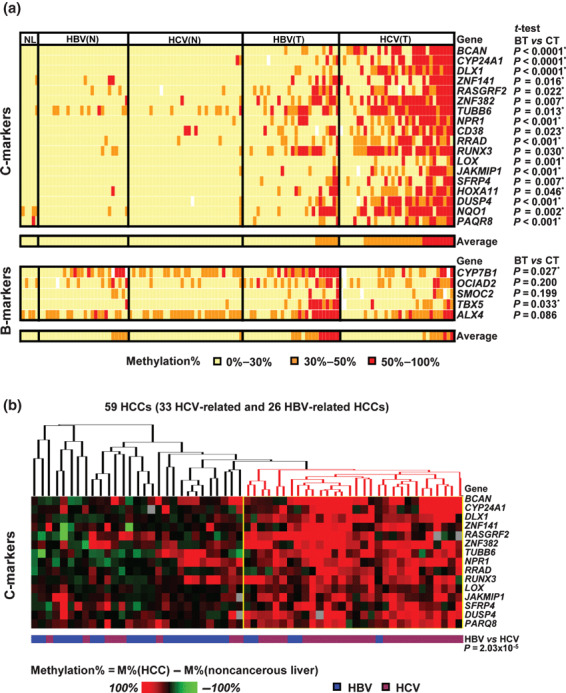
Analysis of DNA promoter methylation in an expanded number of hepatocellular carcinoma (HCC) cases. (a) Methylation analysis of 125 liver samples including 33 pairs of hepatitis C virus (HCV)‐related HCC and matched noncancerous livers, 28 hepatitis B virus (HBV)‐related HCCs and 26 HBV‐related matched noncancerous livers, and five normal liver samples. BT, HBV‐related HCC; CT, HCV‐related HCC; NL, normal liver. Average methylation rate of all markers in each sample is shown at the bottom. Significant difference of methylation level between HBV‐ and HCV‐related HCC was analyzed by t‐test (right). (b) Heat map of methylation increase in 15 age‐independent C‐makers in 59 HCCs compared to matched noncancerous liver tissues. Red dendrogram, a cluster of HCC with frequent methylation.
Since HCV‐related HCC patients were significantly older (Table 1), methylation levels were compared between age‐matched (51–69 years) HBV‐ and HCV‐related HCC samples. Among 18 C‐markers, 15 markers still showed significant difference of methylation levels (Supporting information Table S4), and were therefore considered to be preferentially methylated in HCV‐related HCCs independent from age. Among the two B‐markers, CYP7B1 and TBX5, only CYP7B1 showed significant difference of methylation in comparison to age‐matched HCCs.
Hierarchical clustering of 59 HCC samples was performed using the methylation difference values in the 59 HCC samples compared to the matched noncancerous liver samples (Fig. 5b). When the 15 age‐independent C‐markers were used, a cluster of frequently methylated HCC was detected, which was significantly correlated to HCV‐related HCC (P < 10−5, χ2‐test). The cluster and its significant correlation to HCV‐related HCC indicated that genes methylated preferentially in HCV‐related HCC exist, including the 15 identified C‐markers at least.
Correlation between DNA methylation status and clinico‐pathological features. DNA methylation status of the 15 C‐markers was compared with clinicopathological features including gender, age, background liver tissue, tumor size, tumor differentiation, serum alpha fetoprotein, and serum protein induced by vitamin K absence or antagonist II (PIVKAII) (Supporting information Table S5). Methylation of cytochrome P450, family 24, subfamily A, polypeptide 1 (CYP24A1), distal‐less homeobox 1 (DLX1), natriuretic peptide receptor A (NPR1), secreted frizzled‐related protein 4 (SFRP4), dual specificity phosphatase (DUSP4), and progestin and adipoQ receptor family member VIII (PAQR8) significantly correlated with older age (>60 years). As for gender, female correlated with SFRP4 methylation (P = 0.03, Fisher’s exact test). The other features did not correlate with the methylation of any C‐markers.
Regarding prognosis, correlation between disease‐free survival and methylation statuses of the 15 C‐markers was analyzed by the Kaplan–Meier method. When whole HCC cases were analyzed, HCCs with DUSP4 methylation and CYP24A1 methylation showed significant correlation with survival without recurrence (P = 0.038 and 0.013, respectively, log‐rank test) (Fig. 6a), and methylation of three other genes, zinc finger protein 141 (ZNF141), Ras‐related associated with diabetes (RRAD), and SFRP4, showed tendency toward better prognosis (P = 0.084, 0.052, and 0.088, respectively) (Supporting information Table S6). Gene methylation did not correlate with poorer prognosis. When correlation was analyzed among HCC‐related HCCs only, methylation of DUSP4 and NPR1 significantly correlated with better prognosis (P = 0.042 and 0.007, respectively) (Fig. 6b). CYP24A1 methylation tended to correlate with better prognosis among HCV‐related HCCs (P = 0.050) (Supporting information Table S6). There was no significant difference between prognoses of HBV‐related and HCV‐related HCCs (Supporting information Fig. S3).
Figure 6.
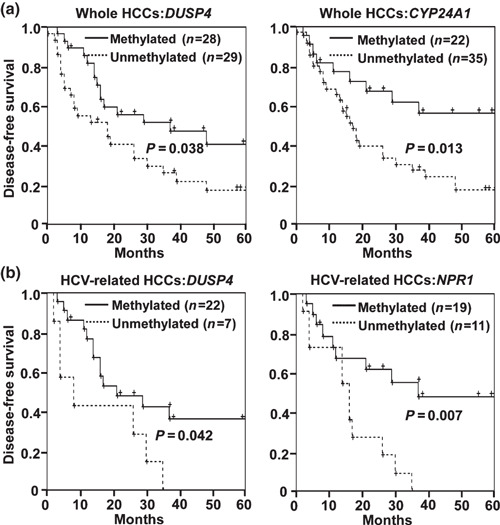
Disease‐free survival analysis by Kaplan–Meier method. Methylated, methylation level >30%. Unmethylated, methylation level ≤30%. (a) Analysis among whole hepatocellular carcinoma (HCC) cases. Methylation of DUSP4 and CYP24A1. significantly correlated with survival without recurrence. (b) Analysis among hepatitis C virus (HCV)‐related HCCs. Methylation of DUSP4 and NPR1 significantly correlated with survival without recurrence.
Discussion
Our results demonstrated that HCV‐related HCC and HBV‐related HCC could be classified into different groups according to DNA methylation information. It was indicated that C‐markers exist, at least 15 genes, and that DNA methylation might be an important cause of hepatic carcinogenesis resulting from HCV infection. HCV‐related HCC patients were significantly older than patients with HBV‐related HCC or metastatic liver tumor (Table 1), so age‐dependent methylation may have to be considered (Supporting information Table S5).( 24 ) But 15 among 18 C‐marker genes were methylated in age‐matched HCV‐related HCC significantly more than in HBV‐related HCC (Supporting information Table S3). As for HBV, only one gene, CYP7B1, was found to be methylated in age‐matched HBV‐related HCC significantly more than in HCV‐related HCC, and involvement of promoter methylation was suggested to be smaller in this study. But detection of candidate methylation genes was started using three HBV‐related and three HCV‐related HCCs, and further study is necessary to clarify the involvement and importance of DNA methylation in HBV‐related HCC, including the absence/existence of B‐markers.
The 15 genes identified as age‐independent C‐markers included brevican (BCAN), CYP24A1, DLX1, ZNF141, Ras protein‐specific guanine nucleotide‐releasing factor 2 (RASGRF2), ZNF382, tubulin, beta 6 (TUBB6), NPR1, RRAD, RUNX3, lysyl oxidase (LOX), janus kinase and microtubule interacting protein 1 (JAKMIP1), SFRP4, DUSP4, and PAQR8. Genes inhibitory to Ras/Raf/ERK signaling (NPR1, DUSP4, LOX, and RRAD) and inhibitory to Wnt/β‐catenin signaling (SFRP4 and RUNX3) were included, suggesting that while methylation of some C‐markers may be passenger methylation, methylation of a part of C‐markers might contribute to genesis of HCC by disrupting cancer‐related pathways through the silencing of a variety of genes.
The Ras/Raf/ERK signaling cascade is frequently deregulated in tumorigenic diseases, promoting cell proliferation and transformation.( 25 ) While oncogenic mutation of Ras or Raf was reported to be rare in HCC,( 26 ) MAPK/ERK activity level was increased in 58–75% of HCC.( 27 , 28 ) It was also reported that Ras and its downstream effector were activated in all HCC, and that at least one of the genes involved in the inhibition of the Ras pathway was affected by methylation in all HCC.( 29 ) Correlation of increase of Ras/Raf/ERK activity to HCV‐related HCC, however, has not been reported. When HCV core gene was co‐trancfected, HRAS‐transfected rat embryonic fibroblasts showed more accelerated growth compared with c‐myc‐transfected rat embryonic fibroblasts, suggesting a possible mechanism of HCV core protein cooperating with Ras in tumorigenesis.( 30 ) NPR1 has an inhibitory role against the Ca2+/CaM/PKC/MAPK/ERK pathway through inhibiting its upstream Ca2+/Calmodulin.( 31 ) DUSP4 inactivates the Ras pathway by dephosphorylation of ERK and increasing protein kinase C (PKC).( 32 ) LOX inhibits the transforming activity of Ras in NIH3T3 fibroblasts by inhibiting activities of Akt, Erk, and nuclear factor‐κB.( 33 , 34 ) RRAD has been reported to be a mediator that inhibits cardiac hypertrophy through down‐regulation of CaMKII as calcium‐calmodulin‐dependent kinase in Ras the pathway.( 35 ) Methylation of these Ras inhibitors, involved specifically in HCV‐related HCC, might play a role in Ras signaling activation and the carcinogenesis of HCC with HCV infection.
The aberrant Wnt/β‐catenin signaling and increased nuclear expression of β‐catenin have been detected in cancer,( 36 ) including HCC.( 37 ) Though a correlation between the Wnt/β‐catenin pathway and HCV infection is still unknown, it was reported that HCV core protein could induce Huh7 liver cancer cell line proliferation by transcriptional up‐regulation of Wnt‐1.( 38 ) SFRP4 is a secreted protein competing with the frizzled receptor for Wnt ligands and antagonizes the Wnt signaling pathway.( 39 ) Wnt signaling up‐regulated by APC inactivation or β‐catenin activation was reported to be attenuated by RUNX3 through its interaction with the β‐catenin/TCF4 complex.( 40 ) Methylation of SFRP4 and RUNX3 may also contribute to the genesis of HCV‐related HCC, involving Wnt signal activation.
C‐markers also included the detoxification enzyme genes. CYP24A1 was included in 15 age‐independent C‐markers; NAD(P)H dehydrogenase, quinone 1 (NQO1) was included in 18 C‐markers and its hypermethylation was reported in HCC.( 41 ) These two genes belong to the phase I/II xenobiotic‐metabolizing enzyme family and these enzymes play an important role in protecting cells from cytotoxic and carcinogenic agents.( 42 , 43 ) Disruption of the detoxification enzymes might cause excessive reactive oxygen species and result in the initiation of HCC.( 41 )
The reason why genes, at least C‐markers, were preferentially methylated in HCV‐related HCC is still unknown. HCV core protein was reported to down‐regulate expression of E‐cadherin correlated with CpG island methylation of E‐cadherin promoter through activation of DNA methyltransferase 1 (DNMT1) and DNA methyltransferase 3B (DNMT3B) in the HCV core protein‐expressing HepG2 cell line.( 44 ) Frequent methylation may occur through activation of DNMT by HCV core protein, or it may be explained by the longer infection period. HCV patients develop HCC with chronic infection for several decades. HBV can cause HCC at earlier onsets, in the absence of LC through integration into the human genome.( 4 , 5 , 45 ) Actually HCV‐related HCC patients were significantly older than HBV‐related HCC patients (Table 1), so methylation of C‐markers was confirmed in age‐matched patients (Supporting information Table S4). But a longer period from infection could give more chances to methylation alteration and still should be considered.
Methylation of three C‐markers, DUSP4, NPR1, and CYP24A1, correlated with recurrence‐free survival (Fig. 6). Two possibilities may be suggested. First, this may be because C‐markers in this study were extracted as genes methylated in tumors only but not in background liver tissues. HCC recurrence could be caused either by intrahepatic metastasis or multicentric occurrence.( 46 ) Specific gene expression patterns in cancerous tissues of HCC could predict early recurrence,( 47 ) whereas expression in the background tissues has also been studied based on the idea of field cancerization and multicentric carcinogenesis.( 48 , 49 ) Genes methylated in tumor only are considered to contribute to the genesis of the resected tumor and its intrahepatic metastasis, but not to the genesis of the multicentric recurrent tumor. The correlation with better prognosis might suggest the importance of multicentric recurrence, and methylation alteration accumulated in the background liver as well as tumor might be a determinant of early multicentric recurrence. Second, accumulation of DNA methylation may contribute to carcinogenesis but cause HCC with better prognosis, while HCCs due to other mechanisms, for example chromosomal instability, may perhaps cause cancer with poorer prognosis; colorectal cancer with highly frequent methylation correlated with microsatellite instability and therefore with better prognosis.( 20 , 50 ) Additional studies are necessary to investigate these possibilities, and to clarify the prognostic significance of C‐marker methylation itself using a larger cohort of patients.
In summary, genome‐wide MeDIP‐chip analysis of clinical samples and quantitative DNA methylation analysis using MassARRAY were performed, and it was found that at least genes that methylate preferentially in HCV‐related HCC exist. Promoter methylation might play an important role in HCV‐related HCC, possibly by inactivating inhibitors for cancer‐related pathway, and might perhaps be useful as a prognostic marker.
Disclosure Statement
The authors have no conflict of interest.
Supporting information
Table S1. Primer sequences for methylation analysis.
Table S2. Reverse transcription‐polymerase chain reaction (RT‐PCR) primers.
Table S3. Candidate C‐ and B‐markers and their MeDIP scores.
Table S4. Methylation levels in age‐matched HBV‐ and HCV‐related HCCs.
Table S5. Association between gene methylation and clinicopathological features.
Table S6. Association between disease‐free survival and methylation.
Fig. S1. The numbers of marker genes detected or selected in each experimental step.
Fig. S2. (a) Demonstration of raw methylation data of HCT116 and control samples analyzed by MassARRAY. CpG sites represented by circles in dotted line were not analyzed because the mass of cleaved RNA product was out of the measurable range. (b) Validation of the quantitative analysis and revision of the methylation score. Raw data acquired by MassARRAY was revised as follows: (i) by duplicative analyses of control samples (0%, 25%, 50%, 75%, 100%): correlation coefficient (R2) and standard curve were calculated at each CpG unit. CpG units with R2 ≤ 0.9 were excluded for further analysis. Primer pairs whose amplicon contained less than three CpG units with R2 > 0.9 were also excluded. (ii) Raw methylation scores at each CpG unit were revised by standard curve. (iii) Methylation rate (%) of the genes/loci was decided by calculating weighted average of revised methylation score of CpG units, considering the number of CpG sites in each CpG unit.
Fig. S3. Disease‐free survival analysis by Kaplan–Meier method to compare hepatitis B virus (HBV)‐ and hepatitis C virus (HCV)‐related HCCs. There was no significant difference in recurrence.
Please note: Wiley‐Blackwell are not responsible for the content or functionality of any supporting materials supplied by the authors. Any queries (other than missing material) should be directed to the corresponding author for the article.
Supporting info item
Supporting info item
Supporting info item
Supporting info item
Supporting info item
Acknowledgments
We thank Dr Kazuaki Watanabe and Toray Research Center for kind supply of anti‐5‐methylcytocine monoclonal antibody, Dr Shingo Tsuji for assistance with statistic analyzes, and Kaoru Nakano and Hiroko Meguro for technical assistance. This work was supported by Grants‐in‐Aid for Scientific Research (B) 19390345 (A.K.) and (S) 20101006 (H.A.), by a grant for Translational Systems Biology and Medicine Initiative (TSBMI) from the Ministry of Education, Culture, Sports, Science and Technology of Japan, by a Grant‐in‐Aid for Cancer Research from the Ministry of Health, Labor and Welfare of Japan, and by JST PRESTO program.
Y.‐B. Deng and G. Nagae contributed equally to this work.
References
- 1. Parkin DM, Bray F, Ferlay J, Pisani P. Global cancer statistics, 2002. CA Cancer J Clin 2005; 55: 74–108. [DOI] [PubMed] [Google Scholar]
- 2. Llovet JM, Bruix J. Novel advancements in the management of hepatocellular carcinoma in 2008. J Hepatol 2008; 48 (Suppl 1): S20–37. [DOI] [PubMed] [Google Scholar]
- 3. Gurtsevitch VE. Human oncogenic viruses: hepatitis B and hepatitis C viruses and their role in hepatocarcinogenesis. Biochemistry (Mosc) 2008; 73: 504–13. [DOI] [PubMed] [Google Scholar]
- 4. But DY, Lai CL, Yuen MF. Natural history of hepatitis‐related hepatocellular carcinoma. World J Gastroenterol 2008; 14: 1652–6. [DOI] [PMC free article] [PubMed] [Google Scholar]
- 5. Marcellin P. Hepatitis B and hepatitis C in 2009. Liver Int 2009; 29 (Suppl 1): 1–8. [DOI] [PubMed] [Google Scholar]
- 6. Feitelson MA. Parallel epigenetic and genetic changes in the pathogenesis of hepatitis virus‐associated hepatocellular carcinoma. Cancer Lett 2006; 239: 10–20. [DOI] [PubMed] [Google Scholar]
- 7. Kondoh N, Wakatsuki T, Hada A et al. Genetic and epigenetic events in human hepatocarcinogenesis. Int J Oncol 2001; 18: 1271–8. [DOI] [PubMed] [Google Scholar]
- 8. Nishida N, Nagasaka T, Nishimura T, Ikai I, Boland CR, Goel A. Aberrant methylation of multiple tumor suppressor genes in aging liver, chronic hepatitis, and hepatocellular carcinoma. Hepatology 2008; 47: 908–18. [DOI] [PMC free article] [PubMed] [Google Scholar]
- 9. Boyault S, Rickman DS, De Reynies A et al. Transcriptome classification of HCC is related to gene alterations and to new therapeutic targets. Hepatology 2007; 45: 42–52. [DOI] [PubMed] [Google Scholar]
- 10. Jones PA, Baylin SB. The epigenomics of cancer. Cell 2007; 128: 683–92. [DOI] [PMC free article] [PubMed] [Google Scholar]
- 11. Feinberg AP, Ohlsson R, Henikoff S. The epigenetic progenitor origin of human cancer. Nat Rev Genet 2006; 7: 21–33. [DOI] [PubMed] [Google Scholar]
- 12. Tischoff I, Tannapfe A. DNA methylation in hepatocellular carcinoma. World J Gastroenterol 2008; 14: 1741–8. [DOI] [PMC free article] [PubMed] [Google Scholar]
- 13. Gao W, Kondo Y, Shen L et al. Variable DNA methylation patterns associated with progression of disease in hepatocellular carcinomas. Carcinogenesis 2008; 29: 1901–10. [DOI] [PubMed] [Google Scholar]
- 14. Wong IH, Lo YM, Zhang J et al. Detection of aberrant p16 methylation in the plasma and serum of liver cancer patients. Cancer Res 1999; 59: 71–3. [PubMed] [Google Scholar]
- 15. Narimatsu T, Tamori A, Koh N et al. p16 promoter hypermethylation in human hepatocellular carcinoma with or without hepatitis virus infection. Intervirology 2004; 47: 26–31. [DOI] [PubMed] [Google Scholar]
- 16. Yang B, Guo M, Herman JG, Clark DP. Aberrant promoter methylation profiles of tumor suppressor genes in hepatocellular carcinoma. Am J Pathol 2003; 163: 1101–7. [DOI] [PMC free article] [PubMed] [Google Scholar]
- 17. Herath NI, Leggett BA, MacDonald GA. Review of genetic and epigenetic alterations in hepatocarcinogenesis. J Gastroenterol Hepatol 2006; 21: 15–21. [DOI] [PubMed] [Google Scholar]
- 18. Katoh H, Shibata T, Kokubu A et al. Epigenetic instability and chromosomal instability in hepatocellular carcinoma. Am J Pathol 2006; 168: 1375–84. [DOI] [PMC free article] [PubMed] [Google Scholar]
- 19. Hayashi H, Nagae G, Tsutsumi S et al. High‐resolution mapping of DNA methylation in human genome using oligonucleotide tiling array. Hum Genet 2007; 120: 701–11. [DOI] [PubMed] [Google Scholar]
- 20. Yagi K, Akagi K, Hayashi H et al. Three DNA methylation epigenotypes in human colorectal cancer. Clin Cancer Res 2010; 16: 21–33. [DOI] [PubMed] [Google Scholar]
- 21. Kaneda A, Wakazono K, Tsukamoto T et al. Lysyl oxidase is a tumor suppressor gene inactivated by methylation and loss of heterozygosity in human gastric cancers. Cancer Res 2004; 64: 6410–5. [DOI] [PubMed] [Google Scholar]
- 22. Ehrich M, Nelson MR, Stanssens P et al. Quantitative high‐throughput analysis of DNA methylation patterns by base‐specific cleavage and mass spectrometry. Proc Natl Acad Sci U S A 2005; 102: 15785–90. [DOI] [PMC free article] [PubMed] [Google Scholar]
- 23. Kaneda A, Kaminishi M, Yanagihara K, Sugimura T, Ushijima T. Identification of silencing of nine genes in human gastric cancers. Cancer Res 2002; 62: 6645–50. [PubMed] [Google Scholar]
- 24. Toyota M, Issa JP. CpG island methylator phenotypes in aging and cancer. Semin Cancer Biol 1999; 9: 349–57. [DOI] [PubMed] [Google Scholar]
- 25. McCormick F. Signalling networks that cause cancer. Trends Cell Biol 1999; 9: M53–6. [PubMed] [Google Scholar]
- 26. Schubbert S, Shannon K, Bollag G. Hyperactive Ras in developmental disorders and cancer. Nat Rev Cancer 2007; 7: 295–308. [DOI] [PubMed] [Google Scholar]
- 27. Ito Y, Sasaki Y, Horimoto M et al. Activation of mitogen‐activated protein kinases/extracellular signal‐regulated kinases in human hepatocellular carcinoma. Hepatology 1998; 27: 951–8. [DOI] [PubMed] [Google Scholar]
- 28. Yea S, Narla G, Zhao X et al. Ras promotes growth by alternative splicing‐mediated inactivation of the KLF6 tumor suppressor in hepatocellular carcinoma. Gastroenterology 2008; 134: 1521–31. [DOI] [PMC free article] [PubMed] [Google Scholar]
- 29. Calvisi DF, Ladu S, Gorden A et al. Mechanistic and prognostic significance of aberrant methylation in the molecular pathogenesis of human hepatocellular carcinoma. J Clin Invest 2007; 117: 2713–22. [DOI] [PMC free article] [PubMed] [Google Scholar]
- 30. Ray RB, Lagging LM, Meyer K, Ray R. Hepatitis C virus core protein cooperates with ras and transforms primary rat embryo fibroblasts to tumorigenic phenotype. J Virol 1996; 70: 4438–43. [DOI] [PMC free article] [PubMed] [Google Scholar]
- 31. Ellmers LJ, Scott NJ, Piuhola J et al. Npr1‐regulated gene pathways contributing to cardiac hypertrophy and fibrosis. J Mol Endocrinol 2007; 38: 245–57. [DOI] [PubMed] [Google Scholar]
- 32. Caunt CJ, Rivers CA, Conway‐Campbell BL, Norman MR, McArdle CA. Epidermal growth factor receptor and protein kinase C signaling to ERK2: spatiotemporal regulation of ERK2 by dual specificity phosphatases. J Biol Chem 2008; 283: 6241–52. [DOI] [PMC free article] [PubMed] [Google Scholar]
- 33. Contente S, Kenyon K, Rimoldi D, Friedman RM. Expression of gene rrg is associated with reversion of NIH 3T3 transformed by LTR‐c‐H‐ras. Science 1990; 249: 796–8. [DOI] [PubMed] [Google Scholar]
- 34. Jeay S, Pianetti S, Kagan HM, Sonenshein GE. Lysyl oxidase inhibits ras‐mediated transformation by preventing activation of NF‐kappa B. Mol Cell Biol 2003; 23: 2251–63. [DOI] [PMC free article] [PubMed] [Google Scholar]
- 35. Chang L, Zhang J, Tseng YH et al. Rad GTPase deficiency leads to cardiac hypertrophy. Circulation 2007; 116: 2976–83. [DOI] [PMC free article] [PubMed] [Google Scholar]
- 36. Bernards R. Cancer: entangled pathways. Nature 2008; 455: 479–80. [DOI] [PubMed] [Google Scholar]
- 37. Ishizaki Y, Ikeda S, Fujimori M et al. Immunohistochemical analysis and mutational analyses of beta‐catenin, Axin family and APC genes in hepatocellular carcinomas. Int J Oncol 2004; 24: 1077–83. [PubMed] [Google Scholar]
- 38. Fukutomi T, Zhou Y, Kawai S, Eguchi H, Wands JR, Li J. Hepatitis C virus core protein stimulates hepatocyte growth: correlation with upregulation of wnt‐1 expression. Hepatology 2005; 41: 1096–105. [DOI] [PubMed] [Google Scholar]
- 39. Jones SE, Jomary C. Secreted Frizzled‐related proteins: searching for relationships and patterns. Bioessays 2002; 24: 811–20. [DOI] [PubMed] [Google Scholar]
- 40. Ito K, Lim AC, Salto‐Tellez M et al. RUNX3 attenuates beta‐catenin/T cell factors in intestinal tumorigenesis. Cancer Cell 2008; 14: 226–37. [DOI] [PubMed] [Google Scholar]
- 41. Tada M, Yokosuka O, Fukai K et al. Hypermethylation of NAD(P)H: quinone oxidoreductase 1 (NQO1) gene in human hepatocellular carcinoma. J Hepatol 2005; 42: 511–9. [DOI] [PubMed] [Google Scholar]
- 42. Josephy PD, Gruz P, Nohmi T. Recent advances in the construction of bacterial genotoxicity assays. Mutat Res 1997; 386: 1–23. [DOI] [PubMed] [Google Scholar]
- 43. Guengerich FP, Hosea NA, Parikh A et al. Twenty years of biochemistry of human P450s: purification, expression, mechanism, and relevance to drugs. Drug Metab Dispos 1998; 26: 1175–8. [PubMed] [Google Scholar]
- 44. Arora P, Kim EO, Jung JK, Jang KL. Hepatitis C virus core protein downregulates E‐cadherin expression via activation of DNA methyltransferase 1 and 3b. Cancer Lett 2008; 261: 244–52. [DOI] [PubMed] [Google Scholar]
- 45. Fung J, Lai CL, Yuen MF. Hepatitis B and C virus‐related carcinogenesis. Clin Microbiol Infect 2009; 15: 964–70. [DOI] [PubMed] [Google Scholar]
- 46. Ko S, Nakajima Y, Kanehiro H et al. Significant influence of accompanying chronic hepatitis status on recurrence of hepatocellular carcinoma after hepatectomy. Result of multivariate analysis. Ann Surg 1996; 224: 591–5. [DOI] [PMC free article] [PubMed] [Google Scholar]
- 47. Iizuka N, Oka M, Yamada‐Okabe H et al. Oligonucleotide microarray for prediction of early intrahepatic recurrence of hepatocellular carcinoma after curative resection. Lancet 2003; 361: 923–9. [DOI] [PubMed] [Google Scholar]
- 48. Kim JW, Ye Q, Forgues M et al. Cancer‐associated molecular signature in the tissue samples of patients with cirrhosis. Hepatology 2004; 39: 518–27. [DOI] [PubMed] [Google Scholar]
- 49. Okamoto M, Utsunomiya T, Wakiyama S et al. Specific gene‐expression profiles of noncancerous liver tissue predict the risk for multicentric occurrence of hepatocellular carcinoma in hepatitis C virus‐positive patients. Ann Surg Oncol 2006; 13: 947–54. [DOI] [PubMed] [Google Scholar]
- 50. Popat S, Hubner R, Houlston RS. Systematic review of microsatellite instability and colorectal cancer prognosis. J Clin Oncol 2005; 23: 609–18. [DOI] [PubMed] [Google Scholar]
Associated Data
This section collects any data citations, data availability statements, or supplementary materials included in this article.
Supplementary Materials
Table S1. Primer sequences for methylation analysis.
Table S2. Reverse transcription‐polymerase chain reaction (RT‐PCR) primers.
Table S3. Candidate C‐ and B‐markers and their MeDIP scores.
Table S4. Methylation levels in age‐matched HBV‐ and HCV‐related HCCs.
Table S5. Association between gene methylation and clinicopathological features.
Table S6. Association between disease‐free survival and methylation.
Fig. S1. The numbers of marker genes detected or selected in each experimental step.
Fig. S2. (a) Demonstration of raw methylation data of HCT116 and control samples analyzed by MassARRAY. CpG sites represented by circles in dotted line were not analyzed because the mass of cleaved RNA product was out of the measurable range. (b) Validation of the quantitative analysis and revision of the methylation score. Raw data acquired by MassARRAY was revised as follows: (i) by duplicative analyses of control samples (0%, 25%, 50%, 75%, 100%): correlation coefficient (R2) and standard curve were calculated at each CpG unit. CpG units with R2 ≤ 0.9 were excluded for further analysis. Primer pairs whose amplicon contained less than three CpG units with R2 > 0.9 were also excluded. (ii) Raw methylation scores at each CpG unit were revised by standard curve. (iii) Methylation rate (%) of the genes/loci was decided by calculating weighted average of revised methylation score of CpG units, considering the number of CpG sites in each CpG unit.
Fig. S3. Disease‐free survival analysis by Kaplan–Meier method to compare hepatitis B virus (HBV)‐ and hepatitis C virus (HCV)‐related HCCs. There was no significant difference in recurrence.
Please note: Wiley‐Blackwell are not responsible for the content or functionality of any supporting materials supplied by the authors. Any queries (other than missing material) should be directed to the corresponding author for the article.
Supporting info item
Supporting info item
Supporting info item
Supporting info item
Supporting info item