

Abstract
Plasma cell myelomas (PMs) have a poor prognosis. Cancer‐testis (CT) antigens are immunogenic proteins, representing potential targets for tumor vaccination strategies. The expression of the CT antigens GAGE, MAGE‐A4, MAGE‐C1/CT‐7, and NY‐ESO‐1 was investigated on paraffin‐embedded bone marrow biopsies from 219 PM and 8 monoclonal gammopathy of undetermined significance (MGUS) patients. The frequency and prognostic impact of these CT antigens were compared with known morphological prognostic markers (i.e. Mib1 labeling index) and the presence of the translocations t(4;14)(p16.3; q32) and t(11;14)(q13;q32). We show that MAGE‐C1/CT‐7 is the most prevalent CT antigen, expressed in 57% of PMs in a high percentage of tumor cells. While MAGE‐C1/CT‐7 was absent in non‐malignant plasma cells, plasma cells of patients with MGUS did express MAGE‐C1/CT‐7, but no other CT antigens. MAGE‐C1/CT‐7 was more frequently expressed in PMs with an elevated proliferation rate (Mib1 >10%) compared to PMs with a low proliferation rate (Mib1 ≤10%, 71%versus 29%, P < 0.001) and correlated with overall survival, depending on its subcellular distribution. PMs with pure cytoplasmic MAGE‐C1/CT‐7 expression showed a better prognosis (48 months versus 33 months, P < 0.05) than PMs with combined nuclear‐cytoplasmic or nuclear expression only. Thus, expression of MAGE‐C1/CT‐7 in patients with monoclonal gammopathies represents a predictor of outcome and overt malignant transformation. (Cancer Sci 2008; 99: 720–725)
Plasma cell myelomas (PMs) are one of the most frequent malignant lymphatic neoplasms accounting for more than 10% of all hematologic malignancies. High‐dose melphalan therapy with autologous stem cell support has emerged as the treatment of choice for the primary care of younger patients but does not offer the prospect of a cure.( 1 , 2 ) There is increasing evidence that the immune system, particularly T cells, can target malignant plasma cells. After allogeneic stem cell transplantation, donor‐derived T cells can reject myeloma cells, eventually leading to long‐term complete remission.( 3 , 4 ) Similarly, donor lymphocyte infusions in patients with relapsed PM after allogeneic transplantation can induce a clinically meaningful graft‐versus‐myeloma effect.( 4 , 5 ) These therapeutic strategies, however, are at the expense of a significant treatment‐related morbidity and mortality, in part due to the fact that immune responses derived from the allogeneic graft are not strictly myeloma‐specific. Thus, the efficacy and safety of myeloma‐specific immunotherapy will be dependent on the identification of antigens that are selectively expressed on tumor cells.
Among the currently known tumor antigens, one of the most relevant for the development of cancer vaccines is the group of cancer‐testis (CT) antigens which were originally discovered in patients with malignant melanoma by virtue of their ability to elicit specific cellular and humoral immune responses (see( 6 ) for review). The expression of these antigens is restricted to the human germ line and a broad variety of tumor cells. Based on their immunogenicity and restricted tissue expression, CT antigens are the main candidates for vaccination of cancer patients. Therefore, numerous clinical trials using CT antigen‐derived immunogens have recently been undertaken.
Previously, the expression of several CT antigens including MAGE, SSX, and NY‐ESO‐1, has been described in malignant plasma cells from patients with PM and transformed plasma cell lines.( 7 , 8 , 9 , 10 ) Importantly, these antigens spontaneously induce specific humoral and cellular immune responses in patients with PM, indicating that CT antigens might represent natural targets for graft‐versus‐myeloma effects.( 11 , 12 )
In addition to their role as a vaccine target, MAGE‐C1/CT‐7 (later CT‐7) has been reported to be associated with a disadvantageous biological behavior.( 13 ) To date, morphology and immunohistochemistry on bone marrow trephines are of limited value to stratify patients into different prognostic categories. Therefore, the goal of our study was to investigate the protein expression of the CT antigens GAGE, MAGE‐A4, CT‐7, and NY‐ESO‐1 using the tissue microarray (TMA) approach on a large retrospective series of bone marrow biopsy samples of PM patients in order to correlate their expression with well‐known morphological, immuno‐phenotypical, and molecular prognostic factors for PM( 14 ) and the clinical outcome of these patients.
Materials and Methods
Tumor samples. Tissue of patients with PM collected at the University Hospital Zurich and the hospitals Zurich‐Triemli, St. Gallen, and Winterthur were constructed by acquiring two 0.6 mm punches of each of the formalin‐fixed, decalcified, paraffin‐embedded trephine biopsies. The construction of a PM TMA has been recently reported.( 14 ) Only punches containing at least 10% of tumor cells were selected for further investigations. The study was approved by the local Ethical Committees of the hospitals.
Immunohistochemistry. Immunohistochemical stainings on TMA sections were performed using an automated immunostainer (Ventana Medical Systems, Tucson, AZ, USA), utilizing the antibodies anti‐CD20 (Clone M0755; Dako Glostrup, Denmark), CD79a (clone M7050; Dako, Glostrup, Denmark), CD138 (clone MI15; Dako, Glostrup, Denmark), VS38c (clone M7077; Dako, Glostrup, Denmark), GAGE (clone 26; BD Biosciences Pharmingen, San Jose, CA, USA), MAGE‐A4 (clone 57B; G. Spagnoli, Department of Surgery, Basel University, Switzerland), MAGE‐C1 (clone CT‐7–33; Dako, Glostrup, Denmark), and NY‐ESO‐1 (clone E978; Zymed Laboratories, South San Francisco, CA, USA). The plasma cell myeloma cell line ARK (J. Epstein; University of Arkansas, Little Rock, AR, USA) was paraffin‐embedded and identically processed for immunofluorescence labeling as a testicular biopsy which served as normal control. For this purpose, MAGE‐C1 and NY‐ESO‐1 were fluorescence labeled with antimouse antibodies coupled to Cy3 (MAGE‐C1) and fluorescein‐isothiocyanate (FITC) (NY‐ESO‐1) (Jackson ImmunoResearch Laboratories, East Baltimore West Grove, PA, USA). After staining the first antigen, a blocking step with Mouse Ig Blocking Reagent (Vector Laboratories, Burlingame, CA, USA) was introduced. The samples were then analyzed on a Olympus BX61 microscope (Schwerzenbach, Switzerland) for conventional fluorescence imaging. Confocal image aquisition was done in sequential mode on a Leica TCS SP5 confocal laser scanning microsope (Mannheim, Germany). Colocalization studies were conducted using IMARIS software (Bitplane, Zurich, Switzerland). Double staining was performed for CD138‐Mib1 and CD138‐Cyclin D1 with an alkaline phosphatase surface staining for CD138 and a nuclear peroxidase staining for Mib1. The percentage of positive tumor cells expressing CT antigens was estimated on the basis of tumor cells stained and graded as follows: up to 25% (+), 25% to 50% (++), 50% to 75% (+++), and greater than 75% (++++). Moreover, staining intensity (absent, faint, moderate, strong), as well as the subcellular localization (cytoplasmic [c], nuclear [n] or cytoplasmic and nuclear [n/c]), was determined. The subcellular localization pattern was defined as >10% of tumor cells stained either cytoplasmic, nuclear, or combined cytoplasmic and nuclear. For all other markers, any expression of at least 10% of tumor cells was scored positive. The exact evaluation of plasma cell proliferation was assessed by staining TMA for both CD138 and Mib1. Plasma cell proliferation was calculated as the percentage of double positive plasma cells for CD138+ Mib1+ within the total of CD138+ cells. The proliferation rate, Mib1 labeling index (Mib1 LI), was assessed as follows: negative (<10%), + (10–30%), ++ (31–50%), and +++ (> 50%). For statistical analysis, PMs were categorized as PMs with a low proliferation rate (Mib1 LI <10%) and a high proliferation rate (Mib1 LI >10%).( 14 )
Interphase fluorescent in situ hybridization (FISH) and fluorescence immunophenotyping and interphase cytogenetics as a tool for the investigation of neoplasms (FICTION). Interphase FISH was combined with immunofluorescence staining for cytoplasmic light chain immunoglobulins to identify the chromosomal abnormalities exclusively in the malignant plasma cell clone.( 15 , 16 ) For technical reasons, FISH could only be applied to samples of three out of four institutes. For the detection of these chromosomal abnormalities on the TMA, dual fusion translocation probes for t(4;14) (p16.3q32) and t(11;14)(q13q32) (LSI IgH/FGFR3 and LSI IgH/CCND1 XT; Vysis, Downers Grove, IL, USA) were used. The manufacturer's instructions were followed, modified for bone marrow biopsies as recently described.( 14 , 17 ) The analysis was performed as published recently.( 14 )
Statistical analysis. Analysis of morphological and immunohistochemical results was restricted to 210 patients with survival information. Due to the retrospective study only very few clinical data in a small proportion of patients were available. Complete morphological, immunohistochemical, and survival information for univariate statistical analysis was obtained from a different number of subjects, mainly due to loss of TMA tissue cylinders. In 31 patients additional information about the translocation t(4;14)(p16.3; q32) and t(11;14)(q13;q32) was available. Overall and subgroup specific survival was estimated by the Kaplan–Meier method. Differences in survival were assessed by the log rank test.( 18 ) P‐values <0.05 were considered significant. The Fisher's exact test was used for assessing the association between categorical variables. The independent effect of molecular markers on survival was determined by the Cox proportional hazard model. Multivariate analysis regarding survival was also performed using the Cox method. The following parameters (cut‐off points) were included in the model: age (<65 years versus≥65 years), sex (male versus female), morphology (mature versus immature), proliferation index (Mib1 LI <10%versus Mib1 LI ≥10%), MAGE‐C1, and NY‐ESO‐1 (positive cytoplasmic staining [c]versus nuclear [n], or nuclear and cytoplasmic [n/c] staining versus no staining), t(4;14) (p16.3;q32), and t(11;14) (q13;q32). Statistical analysis was performed using the software package SPSS (Version 12.0.1 for Windows; SPSS Inc, Chicago, USA).
Results
Patients. A total of 257 biopsies from 219 patients with PM diagnosed between 1983 and 2003 were retrieved from the archives of the collaborating institutes, and reviewed and graded according to the histological grading criteria described by the World Health Organization.( 19 )
Survival data was available for 210 patients. Median follow up time was 32.5 months; the mean survival time was 42.6 months. Morphology of PM (47 months with mature versus 22 months with immature, P < 0.05), proliferation rate (MIb1 LI <10%, 60 months versus Mib1 LI 22 months; P < 0.001) and age (<65 years, 57 months versus >65 years, 26 months; P < 0.001) were significantly associated with a worse prognosis. Cytogenetic analysis using interphase FISH translocation status for the t(4;14) (p16.3q32) and t(11;14)(q13;q32) was interpretable in only 31 PMs with additional complete information about the expression of all CT antigens tested and survival data. Translocation or low level amplification of t(11;14)(q13;q32) and t(4;14)(p16.3;q32) was found in seven of 31 (22%) and four of 31 (12%) of PM patients. Patients with a low level amplification of FGFR3 or a t(4;14)(p16.3;q32) had a worse prognosis than those with aberrations of the CCND1 gene or a t(11;14) (q13; q32) (24 months versus 46 months). Both frequency and difference in survival in PM patients with chromosomal aberrations were consistent with our previous study.( 14 )
Morphology and proliferation index. On the TMA, 240 of 257 PMs (93%) were mature, and 17 of 257 (7%) immature or plasmablastic. Ninety‐eight of 206 PMs (48%) had a high proliferation rate (Mib1 expression >10%), while in 108 PMs (52%) proliferation index was lower than 10%.
Cancer‐testis antigens: Expression pattern and proliferation rate. Immunhistochemistry for protein expression using mAb CT‐7‐33 (CT‐7), E978 (NY‐ESO‐1), 57B (MAGE‐A4), and 26 (GAGE) showed the most prevalent immunostaining for CT‐7‐33 in 97 of 169 (57%). In contrast, mAb 57B was positive in 18 of 160 (11%), clone 26 in 20 of 166 (12%), and E978 in 17 of 203 (8%) (Table 1). None of the mAb stained non‐malignant plasma cells in bone marrow biopsy specimens (n = 7) and in reactive tonsils (n = 10), both from non‐myeloma patients (data not shown); however, there was expression of CT‐7 in scattered plasma cells of two of eight monoclonal gammopathy of undetermined significance (MGUS) (Fig. 1a), indicating that CT‐7‐antigen expression is limited to malignant plasma cells. Immunohistochemical scoring for mAb CT‐7‐33 revealed a high extent of CT‐7 expression in 82 of 97 (85%) PMs (+++, ++++). In particular, two of 13 extranodal PMs exhibited strong (++++) CT‐7 expression. Only 15 of 97 (16%) showed a lower expression rate (+, ++). If the PMs were positive for CT, the staining intensity was either moderate (24 of 97 [25%]) or strong (66 of 97 [68%]), and in only few cases (seven of 97 [7%]) faint. The extent and the distribution of the staining intensity was similar for the other CT‐antigens tested (data not shown). A concomitant expression of MAGE‐C1 and NY‐ESO‐1 was found in 14 of 169 (8%) patients.
Table 1.
Comparison of the number of plasma cell myeloma cases expressing different cancer testis antigens
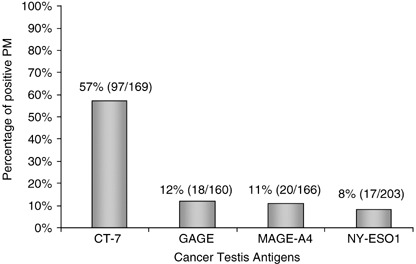
Figure 1.

MAGE‐C1/CT‐7 expression in monoclonal gammopathy of unknown significance (MGUS) and in plasma cell myeloma (PM). (a) MAGE‐C1/CT‐7 expression in scattered plasma cells of MGUS; the inset shows an immunostain using the plasma cell marker VS38c. (b–e) (b) MAGE‐C1 (CT‐7) staining pattern in mature PM: no expression of MAGE‐C1/CT‐7 in a mature PM. (c) Cytoplasmic (c) expression. (d) Combined cytoplasmic and nuclear (nc) expression. (e) Nuclear (n) expression of MAGE‐C1/CT‐7.
Immunohistochemical analysis of all CT‐antigen expression in malignant plasma cells exhibited either a cytoplasmic (c), nuclear (n), or combined cytoplasmic and nuclear (n/c) pattern. A combined cytoplasmic and nuclear expression of CT‐7 was identified in 60 of 97 (62%), while 30 of 97 (31%), and seven of 97 (7%) of the PMs showed a pure cytoplasmic or nuclear positivity, respectively (Fig. 1c–e). A combined nuclear and cytoplasmic staining pattern was also observed in the ARK cell line, but contrasted to the predominating cytoplasmic expression in normal spermatogonia (Fig. 2). For NY‐ESO‐1, we observed a cytoplasmic (c) and combined cytoplasmic and nuclear (n/c) expression in eight of 17 (47%) and nine of 17 (53%) of PMs, respectively.
Figure 2.

Subcellular localization of NY‐ESO1 and MAGE‐C1 (CT‐7) in normal testis. (a) Fluorescence immunohistochemistry for NY‐ESO1 (fluorescein‐isothiocyanate [FITC] labeled, green. (b) MAGE‐C1/CT‐7 (Cy3‐labeled, red). (c) Overlay of NY‐ESO1 and MAGE‐C1 (yellow) assessed by conventional fluorescence microsope and (d) colocalization by scanning microscope showing expression of both markers in the cytoplasm (yellow). Additionally, NY‐ESO1 (green) is faintly expressed in the nucleus. Plasma cell myeloma cell line ARK. (e) Confocal laser scanning microscopy showing Nuclear DAPI staining (blue). (f) Fluorescence immunohistochemistry for NY‐ESO1 (FITC‐labeled, green. (g) MAGE‐C1 (Cy3‐labeled, red) and overlay of NY‐ESO1 and MAGE‐C1 (colocalizations shown in yellow). (i) Colocalization assessment by IMARIS showing variable nuclear (DAPI) coexpression (white) of MAGE‐C1 (red) and nuclear DAPI stain (blue) (g) with an example of only focal nuclear overlap (inset).
Plasma cell proliferation rate was associated with CT‐7 expression. The CT‐7 was more frequently expressed in PMs with a high proliferation rate than in PMs with a low proliferation rate (71%versus 29%, P < 0.001). Mib1 LI was not related to expression of other CT antigens. These results indicate that CT‐7‐positive myeloma cells are characterized by a high tumor cell proliferation rate independent of the morphological subtype (Fig. 3).
Figure 3.

MAGE‐C1 (CT‐7) expression and proliferation rate. High proliferation rate. (Mib1 >10%) was more frequently observed in plasma cell myeloma (PM) with strong nuclear and cytoplasmic CT‐7 expression than in CT‐7‐negative cases or those with a pure cytoplasmic expression (33%versus 15%). (a) PM with strong cytoplasmic and nuclear (nc) MAGE‐C1 (CT‐7) expression in all tumor cells. (b) PM as in 3(a) with a high proliferation rate (Mib1 >10%) in a double staining for CD138 (cytoplasmic, red) and Mib1 (nuclear, brown). (c) PM with no expression for MAGE‐C1/CT‐7 and a proliferation rate Mib1 <10% in a double stain for CD138/Mib1.
Cancer‐testis antigens and prognosis. CT‐7‐antigen expression was not correlated with overall survival of PM patients if global CT‐7‐antigen expression was calculated independent of the subcellular distribution. Importantly however, PMs with CT‐7 expression restricted to the cytoplasm had a significantly better prognosis compared to those with a nuclear or a combined nuclear‐cytoplasmic expression (48 months versus 33 months, P < 0.05) (Fig. 4). We did not observe any correlation with overall survival regarding the expression of all the other CT antigens tested. Due to the small number of PMs with simultaneous expression of all CT antigens, we were not able to perform a multivariate analysis.
Figure 4.

Overall survival according to the subcellular localization of MAGE‐C1 (CT‐7). Plasma cell myeloma patients with cytoplasmic (c) expression; PM patients with a nuclear or a combined cytoplasmic and nuclear (n/c) expression.
For the correlation of molecular alterations and CT‐antigen expression, 31 patients with a complete set of evaluable FISH results and expression data for all CT antigens, as well as survival information, were analyzed (Table 2). Mean survival in PM patients with expression of one of the CT antigens presenting either one of the chromosomal abnormalities (six of 31) was shorter than survival in CT‐positive cases without presenting these chromosomal abnormalities (14 of 31) (32 months versus 44 months). A low level amplification of the CCND1 gene or a t(11;14) (q13;q32) with a concomitant CT expression (three of seven) was associated with a slightly shorter survival than those without CT expression (four of seven) (43 months versus 48 months). The difference was more important for the low level amplification of the FGFR3 gene or for a t(4;14) (p16.3q32) in patients with CT‐antigen‐expressing PM (three of four), where survival was shorter compared to CT‐antigen‐negative PM (22 months versus 32 months). All these trends did not reach statistical significance, probably due to the low number of cases with availability of all necessary data.
Table 2.
CT‐antigen expression, the translocation t11;14) and t4;14), and patient survival data
| Patient | CT‐7 | NY‐ESO‐1 | GAGE | MAGE 57B | MIB‐1 | t(11;14) | t(4;14) | Follow‐up (Mo) | Live status |
|---|---|---|---|---|---|---|---|---|---|
| 1 | – | – | – | – | – | ampl. | 52 | † | |
| 2 | ++++ | – | – | – | – | – | – | 34 | † |
| 3 | – | + | + | – | – | – | transl. | 62 | † |
| 4 | – | – | – | – | – | – | – | 43 | † |
| 5 | – | – | – | – | – | – | – | 60 | † |
| 6 | – | – | – | – | – | – | – | 32 | † |
| 7 | ++++ | – | ++++ | + | ++ | – | – | 32 | † |
| 8 | ++++ | + | – | ++ | ++ | transl. | – | 60 | † |
| 9 | ++++ | ++++ | ++++ | ++++ | + | – | – | 172 | † |
| 10 | ++++ | + | ++ | ++++ | + | – | – | 69 | † |
| 11 | – | – | ++ | – | + | – | – | 54 | † |
| 12 | ++++ | – | – | – | + | – | – | 47 | † |
| 13 | – | – | – | – | – | transl. | – | 53 | α |
| 14 | – | – | – | – | – | ampl. | – | 51 | α |
| 15 | – | – | – | – | + | – | – | 26 | † |
| 16 | ++++ | ++ | ++++ | – | ++ | transl. | – | 14 | † |
| 17 | – | – | – | – | – | – | transl. | 32 | α |
| 18 | – | – | – | – | – | – | – | 46 | † |
| 19 | – | – | – | – | + | transl. | – | 37 | † |
| 20 | ++++ | + | ++ | – | ++++ | – | – | 33 | α |
| 21 | ++++ | – | – | – | – | – | – | 26 | † |
| 22 | ++ | – | – | – | + | – | – | 0 | † |
| 23 | – | – | ++++ | ++ | + | – | transl. | 2 | † |
| 24 | ++++ | – | ++++ | – | ++ | – | ampl. | 1 | † |
| 25 | ++++ | – | – | – | – | – | – | 62 | † |
| 26 | – | ++ | – | – | ++++ | – | – | 12 | † |
| 27 | ++++ | – | – | – | + | transl. | – | 55 | α |
| 28 | ++++ | – | ++++ | ++++ | ++++ | – | – | 11 | † |
| 29 | – | – | – | – | – | – | – | 53 | α |
| 30 | +++ | – | – | – | + | – | – | 35 | α |
| 31 | +++ | ++ | – | – | ++ | – | – | 31 | α |
Staining intensities for CT antigens: – negative, + faint, ++ moderate, ++++ strong. MIB1‐labeling index in plasma cell nuclei: – negative (<10%), + (10–30%), ++ (31–50%), ++++ (>50%).
ampl, low level amplification of CCND1 or FGFR3 gene; transl, translocation; α, alive; † dead.
Discussion
Due to their tumor‐restricted expression pattern and immunogenicity, CT antigens are actively pursued as targets of T‐cell based immunotherapy. In this study we investigated a large cohort of plasma cell myelomas for the expression of different CT antigens. CT‐7 is the most dominant CT antigen in malignant gammopathies. Importantly, the expression of CT‐7 bears a prognostic potential depending on its subcellular distribution.
The expression pattern of CT‐7 in plasma cell myelomas is remarkable for several reasons. First, as shown in this study and by others, CT‐7 protein is expressed in a high proportion of samples from patients with multiple myeloma.( 7 , 13 ) Our study identified a homogenous CT protein expression in 97 of 169 (57%) plasma cell myelomas. Slight differences of reported CT‐7 expression( 13 ) might be explained by the fewer cases analyzed in this former study or inclusion of patients with different clinical stages in our study. However, it is unlikely that the lower incidence reported here is based on the use of the TMA approach. We have previously confirmed the incidence of CT‐7 expression on whole tissue sections (A. Curioni Fontecedro et al. manuscript submitted). Still, this is in striking contrast to CT‐antigen expression in solid tumors, where it is heterogeneously expressed and restricted to a small subgroup of tumors.( 20 ) For example, CT‐7 is expressed in only 10% of colon cancer and NY‐ESO‐1 in only 2% of breast cancer.( 20 , 21 ) Importantly, the expression of CT‐7 is limited to malignant plasma cells, while no expression is detectable in mature B‐cells. Aside from plasma cell myeloma, we observed a purely cytoplasmic (c) expression of CT‐7 only in patients with MGUS.
Second, the expression of CT is associated with signs of increased aggressive behavior of PM. We observed a higher proliferation rate of CT‐7‐positive myeloma cells. Similarly, Jungbluth et al. observed higher CT expression in patients with advanced clinical stage.( 7 , 13 ) Though the function of CT antigens is unknown, these findings might indicate the role of CT‐7 in cell‐cycle regulation and clonal evolution. This speculation might also be supported by the nuclear shift of CT antigens, especially of CT‐7, demonstrated in the cell line ARK as well as in primary myeloma tissue.
Third, the biological behavior of PM might be related to the subcellular protein expression pattern. A purely cytoplasmic expression of CT‐7 is associated with a significantly better prognosis as compared to a nuclear (n) or a combined nuclear‐cytoplasmic (n/c) expression. The former expression pattern is observed in normal spermatogonia, but also on malignant melanoma cells.( 22 ) Moreover, a predominant cytoplasmic expression of CT‐7 was observed in some cells of the plasma cell myeloma line ARK. Expression of other CT antigens in the nucleus as well as in the cytoplasm has also been described for NY‐ESO‐1 in breast cancer and melanomas.( 20 , 23 ) Though the nuclear function of CT remains unclear, our data suggest that CT expression in the nucleus might contribute to the transformation from precursor lesions, i.e. MGUS, to overt plasma cell myeloma. In other words, the function of CT‐7 might also be regulated through its intracellular localization. This nuclear‐cytoplasmic shuttling has been previously shown for CTCFL/BORIS (Brother Of the Regulator of Imprinted Sites), which shares properties of cancer‐testis antigens and plays an important role as chromatin regulator and transcription factor.( 24 , 25 ) Indeed, accumulating data indicate that regulated nuclear transport may govern cellular differentiation and cell cycle progression.( 26 ) Using laser scanning microscopy we were not able to confirm the recently reported surface staining of CT.( 7 ) However, our findings in normal testis, in PM, and in the myeloma cell line ARK, indicate that subcellular localization of CT is relevant for the biologically more aggressive characteristics in CT‐positive PM with a nuclear expression pattern as indicated by the poor overall survival in these patients.
Apart from the subcellular localization of CT‐7, our data suggest a relationship between CT‐antigen expression and presence of chromosomal alterations. CT expression seems to deteriorate prognosis of the structural and numerical chromosomal changes. This effect is observed independently for molecular prognosticators with reported ‘favorable’ (CCND1) and ‘un‐favorable’ (FGFR3) impact.( 14 )
Using the clone E978 we observed only 8% NY‐ESO‐1‐positive PM. This contrasts the findings of Jungbluth et al. who found NY‐ESO‐1 in 21% and 27% of the investigated PMs by using the antibody clones E978 and ES121.( 7 , 13 ) Therefore, the discrepancy cannot be explained by different clones used for NY‐ESO‐1 detection.( 13 ) However, the authors describe a low score for immunohistochemical NY‐ESO‐1 expression in a significant number of PMs. Therefore, variable staining intensity and subcellular expression pattern may explain the differing prevalence of NY‐ESO‐1. Hence, the majoritiy of our cases (12 of 17 [71%]) showed a moderate to strong NY‐ESO‐1 positivity in a high extent of tumor cells with a combined cytoplasmatic and nuclear expression pattern (c/n) in nine of 17 (53%) PMs.
In conclusion, our study documents an association between CT‐7 expression and un‐favorable prognostic factors in PM. Due to the tumor‐restricted expression pattern of CT antigens, our observation of scattered CT‐antigen positive plasma cells in MGUS could indicate an early sign of transformation. Further studies need to address the impact of CT‐7 expression in plasma cells of patients with MGUS. Therefore, future investigations will show whether the subcellular localization of CT‐antigen expression is a reliable marker for disease progression and outcome.
Acknowledgments
We are grateful to Silvia Behnke, Martina Storz, Helene Steinmann, and Andreas Kofler for excellent technical support and to Silvia Morf, Brigitte Steinauer, Danielle Schüler, and Silvia M. Ess for their help during tumor registry.
The work was supported in part by the Novartis Foundation for Medicine and Biology (No. 04C58), the Cancer Research Institute/Ludwig Institute for Cancer Research Cancer Vaccine Collaborative, the Terry‐Fox, Hanne‐Liebermann, and Claudia‐von‐Schilling Foundation, and UBS Wealth Management. M.T. was supported by the SAKK and the G. Hagmann Foundation, and A.Z. was supported in part by the Emmy‐Noether Program (Zi685–2/3) of the Deutsche Forschungsgemeinschaft and the Swiss National Science Foundation.
References
- 1. Attal M, Harousseau JL, Facon T et al . Single versus double autologous stem‐cell transplantation for multiple myeloma. N Engl J Med 2003; 349: 2495–502. [DOI] [PubMed] [Google Scholar]
- 2. Child JA, Morgan GJ, Davies FE et al . High‐dose chemotherapy with hematopoietic stem‐cell rescue for multiple myeloma. N Engl J Med 2003; 348: 1875–83. [DOI] [PubMed] [Google Scholar]
- 3. Reynolds C, Ratanatharathorn V, Adams P et al . Allogeneic stem cell transplantation reduces disease progression compared to autologous transplantation in patients with multiple myeloma. Bone Marrow Transplant 2001; 27: 801–7. [DOI] [PubMed] [Google Scholar]
- 4. Zeiser R, Finke J. Allogeneic haematopoietic cell transplantation for multiple myeloma: reducing transplant‐related mortality while harnessing the graft‐versus‐myeloma effect. Eur J Cancer 2006; 42: 1601–11. [DOI] [PubMed] [Google Scholar]
- 5. Lokhorst HM, Wu K, Verdonck LF et al . The occurrence of graft‐versus‐host disease is the major predictive factor for response to donor lymphocyte infusions in multiple myeloma. Blood 2004; 103: 4362–4. [DOI] [PubMed] [Google Scholar]
- 6. Simpson AJ, Caballero OL, Jungbluth A et al . Cancer/testis antigens, gametogenesis and cancer. Nat Rev Cancer 2005; 5: 615–25. [DOI] [PubMed] [Google Scholar]
- 7. Dhodapkar MV, Osman K, Teruya‐Feldstein J et al . Expression of cancer/testis (CT) antigens MAGE‐A1, MAGE‐A3, MAGE‐A4, CT‐7, and NY‐ESO‐1 in malignant gammopathies is heterogeneous and correlates with site, stage and risk status of disease. Cancer Immun 2003; 3: 9. [PubMed] [Google Scholar]
- 8. Pellat‐Deceunynck C, Mellerin MP, Labarriere N et al . The cancer germ‐line genes MAGE‐1, MAGE‐3 and PRAME are commonly expressed by human myeloma cells. Eur J Immunol 2000; 30: 803–9. [DOI] [PubMed] [Google Scholar]
- 9. Van Baren N, Brasseur F, Godelaine D et al . Genes encoding tumor‐specific antigens are expressed in human myeloma cells. Blood 1999; 94: 1156–64. [PubMed] [Google Scholar]
- 10. Van Rhee F, Szmania SM, Zhan F et al . NY‐ESO‐1 is highly expressed in poor‐prognosis multiple myeloma and induces spontaneous humoral and cellular immune responses. Blood 2005; 105: 3939–44. [DOI] [PMC free article] [PubMed] [Google Scholar]
- 11. Goodyear O, Piper K, Khan N et al . CD8+ T cells specific for cancer germline gene antigens are found in many patients with multiple myeloma, and their frequency correlates with disease burden. Blood 2005; 106: 4217–24. [DOI] [PubMed] [Google Scholar]
- 12. Atanackovic D, Arfsten J, Cao Y et al . Cancer‐testis antigens are commonly expressed in multiple myeloma and induce systemic immunity following allogeneic stem cell transplantation. Blood 2007; 109: 1103–12. [DOI] [PubMed] [Google Scholar]
- 13. Jungbluth AA, Ely S, DiLiberto M et al . The cancer‐testis antigens CT7 (MAGE‐C1) and MAGE‐A3/6 are commonly expressed in multiple myeloma and correlate with plasma‐cell proliferation. Blood 2005; 106: 167–74. [DOI] [PubMed] [Google Scholar]
- 14. Tinguely M, Jenni B, Reineke T et al . Chromosomal translocations t(4; 14), t(11;14) and proliferation rate stratify patients with mature plasma cell myelomas into groups with different survival probabilities – a molecular epidemiologic study on tissue microarrays. Am J Surg Pathol 2007; 31: 690–6. [DOI] [PubMed]
- 15. Cady FM, Muto DN, Ciabeterri G et al . Utility of interphase FISH panels for routine clinical cytogenetic evaluation of chronic lymphocytic leukemia and multiple myeloma. J Assoc Genet Technol 2004; 30: 77–81. [PubMed] [Google Scholar]
- 16. Martinez‐Ramirez A, Cigudosa JC, Maestre L et al . Simultaneous detection of the immunophenotypic markers and genetic aberrations on routinely processed paraffin sections of lymphoma samples by means of the FICTION technique. Leukemia 2004; 18: 348–53. [DOI] [PubMed] [Google Scholar]
- 17. Reineke T, Jenni B, Abdou MT et al . Ultrasonic decalcification offers new perspectives for rapid FISH, DNA, and RT‐PCR analysis in bone marrow trephines. Am J Surg Pathol 2006; 30: 892–6. [DOI] [PubMed] [Google Scholar]
- 18. Lee ET. Statistical Methods for Survival Data Analysis. Belmont, California: Woodsworth Inc, 1980. [Google Scholar]
- 19. Jaffe E, Harris NL, Stein H, Vardiman W. Pathology and Genetics of Tumours of Haematopathopoietic and Lymphoid Tissue. France: iARC Press, 2001. [Google Scholar]
- 20. Theurillat JP, Ingold F, Frei C et al . NY‐ESO‐1 protein expression in primary breast carcinoma and metastases‐correlation with CD8+ T‐cell and CD79a+ plasmacytic/B‐cell infiltration. Int J Cancer 2007; 120: 2411–7. [DOI] [PubMed] [Google Scholar]
- 21. Chen YT, Gure AO, Tsang S et al . Identification of multiple cancer/testis antigens by allogeneic antibody screening of a melanoma cell line library. Proc Natl Acad Sci USA 1998; 95: 6919–23. [DOI] [PMC free article] [PubMed] [Google Scholar]
- 22. Cho HJ, Caballero OL, Gnjatic S et al . Physical interaction of two cancer‐testis antigens, MAGE‐C1 (CT7) and NY‐ESO‐1 (CT6). Cancer Immun 2006; 6: 12. [PubMed] [Google Scholar]
- 23. Vaughan HA, Svobodova S, Macgregor D et al . Immunohistochemical and molecular analysis of human melanomas for expression of the human cancer‐testis antigens NY‐ESO‐1 and LAGE‐1. Clin Cancer Res 2004; 10: 8396–404. [DOI] [PubMed] [Google Scholar]
- 24. Robertson KD. DNA methylation and human disease. Nat Rev Genet 2005; 6: 597–610. [DOI] [PubMed] [Google Scholar]
- 25. Hoffmann MJ, Muller M, Engers R, Schulz WA. Epigenetic control of CTCFL/BORIS and OCT4 expression in urogenital malignancies. Biochem Pharmacol 2006; 72: 1577–88. [DOI] [PubMed] [Google Scholar]
- 26. Hogarth C, Itman C, Jans DA, Loveland KL. Regulated nucleocytoplasmic transport in spermatogenesis: a driver of cellular differentiation? Bioessays 2005; 27: 1011–25. [DOI] [PubMed] [Google Scholar]