

Abstract
BRCA2 is a multifunctional tumor suppressor protein which plays critical roles in DNA repair, transcription, and cell proliferation, and the loss of which has been linked to the biology of several types of cancers. Here, on prostate adenocarcinoma specimens from 80 patients, we demonstrate that BRCA2 protein is lost in carcinoma cells compared to normal and hyperplastic prostate epithelium. Using highly metastatic prostate cancer PC‐3 cells, we show that while BRCA2 depletion by small‐interfering RNA promoted migration onto the extracellular matrix proteins fibronectin, laminin, and collagens, as well as invasion through the reconstituted basement membrane matrix Matrigel by more than 140%, recombinant BRCA2 overexpression decreased both phenomena by 57–80% and changed cell morphology from angular and spindle to round and compact. The BRCA2 inhibitory effect on cancer cell migration and invasion resulted from down‐regulation of matrix metalloproteinase (MMP)‐9 protein levels due to increased MMP‐9 proteolysis, and was signaled through inhibition of PI3‐kinase/AKT and activation of MAPK/ERK pathway. In BRCA2‐overexpressing PC‐3 cells, transient transfection with a constitutively active PI3‐kinase mutant or treatment with the MAPK/ERK inhibitor PD98059 rescued MMP‐9 levels and restored the migratory and invasive capabilities. Consistently, PI3‐kinase inhibition with a dominant‐negative mutant or MAPK/ERK activation with a gain‐of‐function mutant reduced MMP‐9 levels and prevented migration and invasion in wild‐type PC‐3 cells. These results provide novel evidence showing that a functional BRCA2 protein may limit the metastatic potential of neoplastic cells by down‐regulating MMP‐9 production through inhibition of PI3‐kinase/AKT and activation of MAPK/ERK, effectively hindering cancer cell migration and invasion. (Cancer Sci 2008; 99: 553–563)
- Abbreviations: AEC, 3‐amino‐9‐ethylcarbazole; BM
basement membrane
- COL1
collagen type I
- COL4
collagen type IV
- ECM
extracellular matrix
- FN
fibronectin
- LN‐1
laminin‐1
- MMP
matrix metalloproteinase; TBS, Tris‐buffered saline; TMA, tissue microarray.
Although mortality from prostate cancer has been declining over the past decade, the development of metastatic disease substantially shortens survival and remains a major challenge in maintaining quality of life.( 1 ) Consequently, the elucidation of the mechanisms governing prostate cancer metastasis has been the focus of intense research during the past several years. Cancer metastasis results from the newly acquired ability of tumor cells to detach from the primary tumor, breach through extracellular matrix (ECM), lymphatic, and blood vessels, and thrive in distant organs.( 2 ) In prostate cancer, progression to a metastatic phenotype has been associated with increased phosphorylation of AKT, suppression of apoptosis pathways, and decreased phosphorylation of ERK at the invasive edge.( 3 ) Activation of the phosphatidyl inositol 3‐kinase (PI3‐kinase)/AKT pathway is thought to play a critical role in the progression from a relatively quiescent state to a highly invasive phenotype,( 4 ) partly through downstream activation of the Rho signaling cascade that effectively controls actin cytoskeletal organization and cell motility, and promoting the secretion of matrix metalloproteinases (MMPs), which would facilitate cell invasion through ECM.( 5 , 6 , 7 )
BRCA2 is a tumor suppressor gene that when mutated confers an increased susceptibility to developing breast and prostate carcinoma.( 8 , 9 , 10 ) Inheritance of one defective allele confers cancer predisposition, and neoplastic cells from predisposed individuals frequently exhibit loss of heterozygosity in the wild‐type allele,( 11 ) consistent with a critical role of BRCA2 in tumor suppression. The major identified function of the BRCA2 protein is to form complexes with Rad51 in the nuclei, which orchestrate homologous recombinational repair of double‐strand DNA breaks.( 12 ) Besides its role in mediating DNA repair, BRCA2 also plays a role in the stabilization of stalled DNA replication forks, centrosome duplication, mammalian gametogenesis, cytokinesis, and transcriptional regulation.( 13 , 14 ) More recently, evidence has been provided that loss of BRCA2 may also play a role in facilitating cancer cell proliferation.( 15 , 16 , 17 , 18 , 19 ) In prostate carcinoma cells, we have recently shown that down‐regulation of BRCA2 expression triggers a proliferative response upon cancer cell interaction with basement membrane (BM) proteins. A similar phenomenon takes place after cancer cell interaction with collagen type I (COL1), a major ECM component present mainly in bone, a preferred metastatic site for prostate carcinoma.( 16 , 18 , 19 ) In both circumstances, the down‐regulatory effect upon BRCA2 results from aberrant activation of the PI3‐kinase pathway, which promotes Skp2‐mediated BRCA2 ubiquitination and degradation in the proteasome.( 16 , 18 ) This abnormal behavior is exclusive to cancer cells as normal prostate cell adhesion to ECM proteins has no inhibitory effect upon BRCA2 protein levels.( 16 , 18 , 19 )
In this study, we investigated whether loss of BRCA2 expression is a common phenomenon in vivo by performing BRCA2 immunohistochemical analysis in several cases of human prostate adenocarcinoma. We also investigated whether loss of BRCA2 may influence other crucial aspects of cancer cell behavior, such as invasion capabilities. Our results indicate that, besides its role in suppressing cancer cell proliferation,( 15 , 16 , 18 , 19 ) BRCA2 has a negative effect upon cancer cell migration and invasion through a mechanism that involves down‐regulation of MMP‐9 expression.
Materials and methods
Immunohistochemical studies. The construction of prostate TMAs was approved by the University of Rochester's Research Subjects Review Board and has been previously described.( 20 , 21 ) Briefly, archival prostatectomy cases (from 2002 to 2003) in the Department of Pathology at the University of Rochester Medical Center were reviewed and 80 cases selected for microarray construction. One or more cores were taken from areas of normal prostatic tissue (N, 50 cores), benign prostatic hyperplasia (BPH, 82 cores), and adenocarcinoma (186 cores) averaging 4–6 cores per case. Formalin‐fixed, paraffin‐embedded tissues were sectioned at 5 µm thickness, deparaffinized, and quenched with 3% hydrogen peroxide for 6 min. Antigen heat‐retrieval was accomplished in a steamer containing citrate buffer (pH 6.1, Dako) at 95–99°C for 30 min. After rinsing with TBS, rabbit polyclonal BRCA2 antibody against amino acids 3245–3418 of human BRCA2 (Calbiochem) at a dilution of 1:100 was applied overnight at 4°C, followed by 30 min each incubation of biotinylated secondary linking antibody and a streptavidin‐bound peroxidase enzyme complex. Slides were developed with AEC+ (Dako) for 10 min, rinsed in running distilled water, counterstained in Modified Mayer's Hematoxylin, stained blue in 0.3% ammonia water using an aqueous medium, and examined under a light microscope. For TMA examination, each tissue core was separately scored, and those having <50% of tissue present were discarded. Scoring included percentage of staining and staining intensity. Each core was assigned a score on a scale from 0 to 3 designated as 0 when negative, 1+ when 10–20% of cells stained, 2+ when 20–50% of cells stained and 3+ when >50% of cells stained. Results were recorded as positive (2+ to 3+) or negative (staining intensity 0–1+).
Cell lines and transfections. PC‐3 cells were kept in culture in RPMI medium as described previously.( 22 ) For the transfection experiments, cells were transfected using Lipofectamine 2000 (Invitrogen) according to the manufacturer's instructions. To generate stable transfectants, PC‐3 cells in three different 100‐mm dishes were transfected with 5 µg of BRCA2 cDNA (rBRCA2 cells) or empty vector (pcDNA3; mock cells) and, 48 h after transfection, added with 0.75 mg/mL G418 in growth medium for 20 days to select for transfected cells. The three independent populations of mock (Mock #1, 2, 3) and BRCA2‐overexpressing (rBRCA2 #1, 2, 3) stable transfectants obtained were screened for BRCA2 protein levels by Western blotting and kept in culture in the presence of 0.5 mg/mL G418. Transient transfections with BRCA2 cDNA, constitutively active MEK1 cDNA (ca‐MEK, a generous gift from Dr M. Cobb, University of Texas South‐western Medical Center, Dallas), Δp85, a dominant negative form of PI3‐kinase, ca‐p110, a constitutively active form of PI3‐kinase (generously provided by Dr R. Freeman, University of Rochester, Rochester, NY), or empty vector (pcDNA3) were performed as described previously.( 16 , 18 ) A single BRCA2‐specific siRNA sequence,( 16 ) or a pool of four target‐specific siRNAs for human BRCA2 (Santa Cruz Biotechnology, CA, USA) were used for transient transfections according to the manufacturer's instructions. Negative control (non‐specific) siRNAs (Santa Cruz Biotechnologies) were also transfected. siRNA‐mediated suppression of BRCA2 expression was confirmed by Western blotting analysis.
Cell migration assay. Cells (1 × 10⁵ cells) were seeded on 8‐µm pore‐sized transwell Boyden chamber (Corning Costar) coated overnight at 4°C with 3 µg/mL fibronectin (FN), 10 µg/mL laminin‐1 (LN‐1), 10 µg/mL collagen type IV (COL4) or 10 µg/mL COL1. The lower chambers were filled with RPMI with or without MMP‐9 in latent (92 kDa) form (33 ng/mL; Sigma). Where indicated, cells were pretreated for 24 h with the PI3‐kinase inhibitor LY294002 (10 µM; Calbiochem), or the MAPK/ERK kinase 1 (MEK1) inhibitor PD98059 (50 µM), or solvent alone (DMSO). After 6 h at 37°C, cells in the lower chamber were fixed with 3% paraformaldehyde, stained with crystal violet, photographed, and counted. Results were expressed as cells per square millimeter (average and SE of 10 random fields). Each experiment was performed in duplicate.
Western blotting. Total cell extracts were prepared as described previously.( 16 ) Where indicated, cells were pretreated for 24 h with the PI3‐kinase inhibitor LY294002 (10 µM; Calbiochem), or the MEK1 inhibitor PD98059 (50 µM), or solvent alone (DMSO), or incubated for the indicated time with the protein synthesis inhibitor cycloheximide (12.5 µg/mL; Sigma) or the vehicle alone (ethanol), before lysis. The protein content of each lysate was quantified using the Bio‐Rad Dc protein assay reagent. To prepare conditioned medium, PC‐3 cells exponentially growing in 100‐mm plates were changed to serum‐free RPMI and cultured for 24 h. The resultant culture supernatants were collected and 100 µL subjected to 10% sodium dodecyl sulfate – polyacrylamide gel electrophoresis (SDS‐PAGE). Equal loading was confirmed by Ponceau S stain (0.2% Ponceau S in 3% trichloroacetic acid). Protein levels in total cell extracts and conditioned media were analyzed by immunoblotting as described previously.( 16 ) Antibodies to BRCA2, phospho‐AKT‐Ser 473, AKT 1/2, phospho‐ERK, ERK2 and β‐tubulin have been described previously.( 16 , 19 ) Polyclonal antibodies to MMP‐9 and MMP‐2 were purchased from Chemicon.
Cell invasion assay. Invasion assays were performed by using a 24‐well invasion Boyden chamber coated with the BM matrix Matrigel (Sigma). Briefly, Matrigel (containing 10–12 mg protein/mL) was diluted 1:3 in RPMI medium (Invitrogen), 50 µL/well was added onto each transwell insert filter and allowed to polymerize for 30 min at 37°C, before plating the cells. Where indicated, MMP‐9 (92 kDa‐latent form; 33 ng/mL) was added to Matrigel prior polymerization. Cells were trypsinized and washed with PBS, suspended in RPMI containing 0.1% bovine serum albumin (BSA), and plated in the invasion chamber (1 × 10⁵ cells/well). Where indicated, cells were pretreated for 24 h with LY294002 (10 µM), PD98059 (50 µM), or solvent alone (DMSO). The lower chambers were filled with RPMI plus 10% fetal bovine serum serving as source of chemoattractants. After 48 h at 37°C, the cells remaining in the upper chamber were removed by scraping, whereas the cells that invaded through Matrigel and attached to the lower surface of the insert were stained with crystal violet, photographed and counted by microscopic visualization as described for migration assays.
Cell growth assay. PC‐3 cells, 48 h upon transient transfection with BRCA2 siRNA or non‐specific siRNAs, were plated at a density of 1 × 10⁴/well in 96‐well culture plates. Cells from three wells at each time point were washed once with phosphate‐buffered saline (PBS) and counted. Results were expressed as cells per square millimeter (average and SE of 30 random fields; 10 fields/well). The experiment was performed in duplicate.
Zymography. Culture supernatants (100 µL) were denatured in the absence of reducing agent and electrophoresed in a 7.5% polyacrylamide gel containing 0.1% (w/v) gelatin. Thereafter, gels were incubated at room temperature for 2 h in the presence of 2.5% Triton X‐100 and subsequently at 37°C overnight in a buffer containing 10 mM CaCl2, 0.15 M NaCl, and 50 mM Tris, pH 7.5. Gels were subsequently stained for proteins with 0.25% Coomassie Brilliant Blue, destained in methanol/acetic acid/water, and photographed on a light box. Proteolysis was visually detected as a white zone in a dark field.
Reverse transcription–polymerase chain reaction (RT‐PCR). Total RNA was isolated from cultured cells using the TRIZOL reagent (Invitrogen) according to the manufacturer's instructions. The amount of MMP‐9 mRNA present in the cells was measured by RT‐PCR on total cellular RNA using the Qiagen OneStep RT‐PCR kit (Qiagen), according to the manufacturer's instructions. Briefly, total RNA (1 µg) was reverse‐transcribed for 30 min at 50°C in 0.2 mM dNTPs (Qiagen), 10 units of RNase inhibitor (Promega, Milan, Italy), 1X RT‐PCR buffer (Qiagen), 0.6 µM forward primer (Operon), 0.6 µM reverse primer (Operon), and 1 µL of enzyme mix (avian myeloblastosis virus, Taq DNA polymerase, and a proofreading polymerase; Qiagen). After cDNA synthesis, a cycle of denaturation at 95°C for 15 min followed by 32 cycles of denaturation at 95°C for 1 min, annealing at 60°C for 1 min, and elongation at 72°C for 45 s were run. A final cycle of elongation at 72°C for 10 min was run. The primers used for MMP‐9 were: 5′‐GAGGTTCGACGTGAAGGCGCAGATG‐3′ and 5′‐CATAGGTCACGTAGCCCACTTGGTC‐3′ (PCR product size: 199 bp). Glyceraldehyde‐3‐phosphate dehydrogenase (GAPDH) was used as an internal control, as described previously.( 16 ) The PCR products were separated by electrophoresis on a 1.8% agarose gel and visualized by ethidium bromide staining under UV‐light transillumination.
Statistical analysis. Data are reported as the mean ± SE. Statistical analysis was performed by the Student's t‐test. All experiments were repeated at least twice. For the immunohistochemical study, Fisher's exact test was performed to compare the statistical significance of the staining results among groups.( 21 )
Results
BRCA2 protein expression is lost in prostate carcinoma. To assess whether down‐regulation of BRCA2 is a phenomenon that occurs in vivo, we analyzed BRCA2 protein expression by immunohistochemistry on a prostate tissue microarray containing cores from benign and neoplastic prostate tissue obtained from 80 patients with diagnosed prostate adenocarcinoma. After elimination of cores with significant tissue loss during processing, 48 cores of normal prostate (N), 79 cores showing benign prostate hyperplasia (BPH) and 140 cores with adenocarcinoma (PC) were examined (Table 1). Eighty‐one percent of normal prostate cores and 80% of cores with BPH displayed strong nuclear staining for BRCA2, which was particularly prominent at the nuclear membrane (Fig. 1, panel a). Nuclear BRCA2 staining was significantly lost in prostate cancer as compared with normal and hyperplastic prostate tissue (P < 0.0001, Fig. 1, panel b; Table 1).
Table 1.
Immunohistochemical study of prostate tissue microarray for the expression of BRCA2. BRCA2 protein expression was assessed in a prostate tissue microarray containing cores of normal prostate (N), benign prostatic hyperplasia (BPH), and prostate adenocarcinoma (PC) using a polyclonal antibody against the BRCA2 C‐terminal domain
| Total cores scored | Positive cores | Negative cores | % Positive cores | % Negative cores | P‐value* | |
|---|---|---|---|---|---|---|
| Normal (N) | 48 | 39 | 9 | 81 | 19 | |
| BPH | 79 | 63 | 16 | 80 | 20 | |
| Benign (N + BPH) | 127 | 102 | 25 | 80 | 20 | |
| PC | 140 | 32 | 108 | 23 | 77 | <0.0001 |
P‐value is compared with normal tissue. Identical P‐value was obtained when comparing with BPH.
Figure 1.
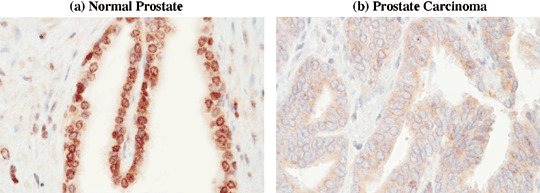
BRCA2 protein expression is lost in prostate carcinoma in vivo. BRCA2 protein expression was assessed in a prostate tissue microarray containing cores of normal prostate, BPH, and prostate adenocarcinoma using a polyclonal antibody against the BRCA2 C‐terminal domain. (a) Normal epithelial cells exhibited strong nuclear staining, but a faint diffuse cytoplasmic staining was also present (×400). (b) A significant number of carcinomas exhibited virtual loss of BRCA2 nuclear staining. A representative case is shown (×400).
BRCA2 expression inhibits prostate cancer cell migration onto ECM proteins. To assess whether loss of BRCA2 may have an influence upon prostate cancer cells’ abilities to move along ECM proteins, we analyzed the effect of BRCA2 siRNAs or wild‐type BRCA2 cDNA expression upon PC‐3 cell migration onto the ubiquitous stromal protein FN, the BM components LN‐1 or COL4, and onto the osseous matrix component COL1. Transfection with BRCA2 siRNA targeting a single BRCA2 sequence or with a pool of BRCA2‐siRNA molecules, resulted in ~60% protein knockdown over 4 days while transient transfection with wild‐type BRCA2 cDNA resulted in ~2.2‐fold protein increase (P < 0.001; Fig. 2a). No difference in BRCA2 expression was observed between wild‐type cells, and cells transfected with non‐specific siRNA or empty vector. As shown in Fig. 2b, wild‐type PC‐3 cells migrated very efficiently onto LN‐1 and COL1 while COL4 and FN were less efficient in eliciting cell migration by 5‐ and 6‐fold (P < 0.001), respectively. BRCA2 protein knockdown with siRNAs increased the number of cells migrating onto FN and COL4 by 1.8‐ and 1.4‐fold (P < 0.01), respectively, and had no discernible effect onto LN‐1 and COL1 since wild‐type cells rapidly reached confluence onto these ECM proteins. On the other hand, overexpression of BRCA2 reduced PC‐3 cell migration onto FN, LN‐1, COL4, and COL1 by 57%, 77%, 79%, and 80% (P < 0.001), respectively (Fig. 2b). No discernible difference was observed when cells were transfected with a single BRCA2‐siRNA sequence or a pool of BRCA2‐siRNAs (not shown).
Figure 2.
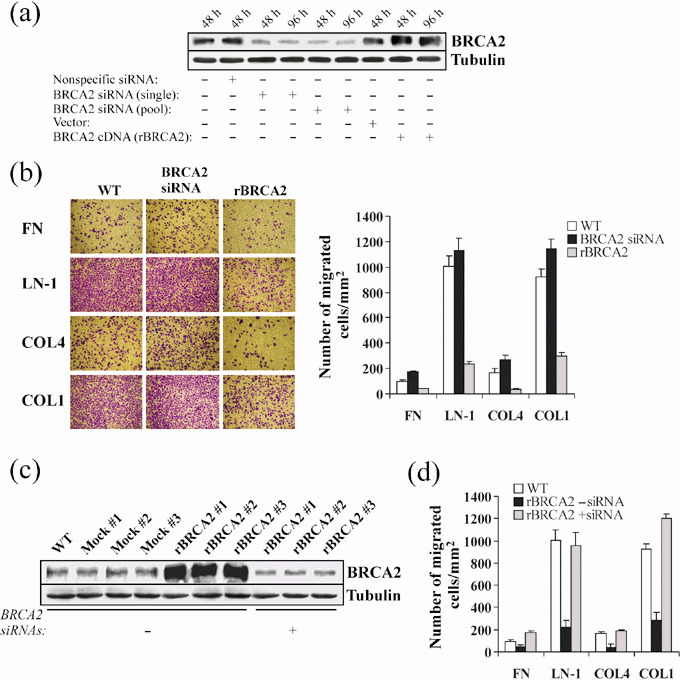
BRCA2 expression inhibits prostate cancer cell migration. (a) Wild‐type PC‐3 cells were transiently transfected for 48 or 96 h with non‐specific siRNAs, a single BRCA2 siRNA sequence, a pool of BRCA2 siRNAs, recombinant BRCA2 cDNA (rBRCA2) or empty vector, after which cells were lysed and BRCA2 protein levels measured by Western blotting analysis. Cell extracts from wild‐type cells kept in the same culture conditions as the transfected cells were included. β‐tubulin signals were used as loading controls. (b) Wild‐type PC‐3 cells (WT) were transiently transfected for 48 h with either siRNAs for BRCA2 (pool) or recombinant BRCA2 cDNA (rBRCA2), after which cell migration assays were performed by plating 1.0 × 10⁵ cells onto transwell insert filters coated with 3 µg/mL fibronectin (FN), 10 µg/mL laminin‐1 (LN‐1), 10 µg/mL collagen type IV (COL4) or 10 µg/mL collagen type I (COL1). After 6 h, cells at the lower side of the filter were fixed, stained with crystal violet, photographed and counted. A representative experiment of three is shown. Mean ± SE of 10 random fields is graphically depicted at the right. (c) BRCA2 protein was assessed in total protein extracts from wild‐type PC‐3 cells (WT), mock transfected (Mock #1, #2, #3), and stably transfected with BRCA2 cDNA (rBRCA2 #1, #2, #3) subjected to transient transfection with a pool of siRNAs for BRCA2 (+) or non‐specific siRNAs (–) for 48 h. β‐tubulin signals were used as loading controls. (d) Migration of PC‐3 cells stably expressing rBRCA2 was assessed 48 h after transient transfection with a pool of non‐specific siRNAs (–) or siRNAs for BRCA2 (+), as described in (b). A representative experiment of two is shown. Mean ± SE of 10 random fields is reported.
We proceeded to transfect wild‐type BRCA2 cDNA into PC‐3 cells in triplicate to generate populations stably expressing recombinant BRCA2 (rBRCA2 cells; Fig. 2c). For each transfection, clones that survived selection were pooled into three independent populations (rBRCA2 #1, 2 and 3), which similarly expressed BRCA2 protein at levels approximately 6‐fold above wild‐type. Mock‐transfected cells were indistinguishable from wild‐type PC‐3 cells (Fig. 2c). SiRNA‐transfection assays on rBRCA2 cells abated BRCA2 protein expression to levels below wild‐type PC‐3 (74%; P < 0.0001). All subsequent experiments were performed using two independent pools of transfectants, and results obtained with pools rBRCA2 #2 and Mock #1 are depicted throughout the manuscript. As shown in Fig. 2d, when tested onto ECM proteins, rBRCA2 PC‐3 cells were noticeably less motile than wild‐type cells (P < 0.002 for FN; P < 0.0001 for LN‐1, COL4, and COL1), a behavior that could be rescued by BRCA2 protein knockdown with siRNA.
BRCA2 expression prevents prostate cancer cell invasion. To investigate whether BRCA2 would also be able to influence PC‐3 cell invasion through BM layers, we performed in vitro invasion assays using transwell Boyden chambers coated with a 5‐mm‐thick layer of Matrigel, a reconstituted BM matrix. This assay allows the measurement of two important determinants of tumor aggressiveness: motility and invasiveness. Cells must first degrade the reconstituted BM that occludes the filter's pores and then move through these cleared pores to adhere and spread to the other side of the filter. As depicted in Fig. 3a, knockdown of BRCA2 by siRNA increased the number of invasive wild‐type PC‐3 cells by 50% (P < 0.02) whereas rBRCA2 expression decreased the number of invading cells by 80% (P < 0.001). As previously observed with isolated ECM proteins, the non‐invasive phenotype of rBRCA2 cells could be completely rescued by knocking down BRCA2 protein with siRNA transfection.
Figure 3.
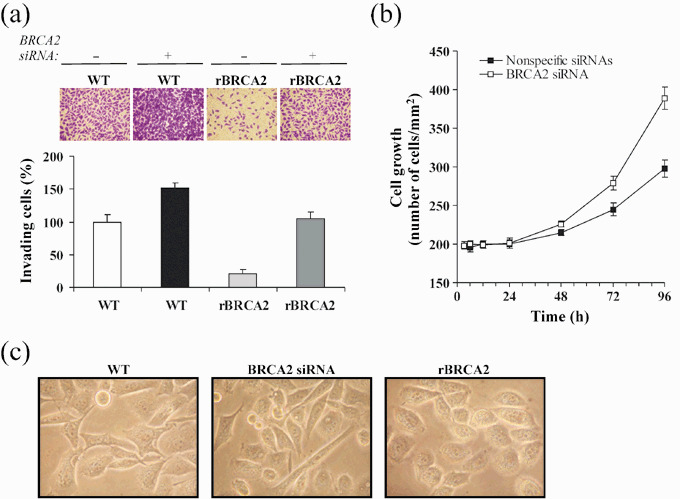
BRCA2 expression inhibits prostate cancer cell invasion. (a) Wild‐type PC‐3 cells (WT) and cells stably expressing BRCA2 cDNA (rBRCA2) were transiently transfected for 48 h with a pool of non‐specific siRNAs (–) or siRNAs for BRCA2 (+), after which cell invasion assays were performed by plating 1.0 × 10⁵ cells onto transwell insert filters coated with a 5‐mm thick Matrigel layer. After 48 h, cells at the lower side of the filter were fixed, stained with crystal violet, counted in 10 random fields, and reported as a percentage of WT invading cells that had received non‐specific siRNAs. A representative experiment of three is shown. (b) PC‐3 cells 48 h upon transient transfection with siRNAs for BRCA2 or non‐specific siRNAs, were plated on 96‐well plates (1.0 × 10⁴/well), and counted in 10 random fields/well at the indicated time. Mean ± SE from three wells in a representative experiment are reported. (c) Morphological changes induced by BRCA2 depletion or overexpression were noticeable by microscopic analysis. Representative pictures of wild‐type (WT) and PC‐3 cells transiently transfected for 48 h with BRCA2 siRNA or BRCA2 cDNA (rBRCA2) are shown (400×).
To investigate whether the increase in cell migration and invasion upon BRCA2 protein depletion could have been simply due to increased cell proliferation, we measured the effect of BRCA2 knockdown on cell growth rate. As shown in Fig. 3b, BRCA2 depletion increased PC‐3 cell growth by 1.2‐ and 1.4‐fold at 72 h (P < 0.02) and 96 h (P < 0.005), respectively, adding further support to previous evidences demonstrating that BRCA2 loss facilitates cancer cell proliferation.( 15 , 16 , 17 , 18 , 19 ) However, during the earlier migration (6 h) and invasion (48 h) assay periods the effect was negligible, confirming the specificity of BRCA2 loss in promoting the invasive phenotype of prostate cancer cells.
We then asked whether BRCA2‐dependent changes in the invasive abilities were accompanied by changes in cell morphology. As shown in Fig. 3c, BRCA2 knockdown resulted in a more elongated cellular shape, with an increased number of pseudopodia and invadopodia along the cell surface or at the end of a dominant leading edge pseudopodia, phenotypic characteristics that underline motility and invasive ability.( 23 ) On the contrary, overexpression of BRCA2 changed the cell morphology from spindle and angulated to round and devoid of pseudopodia and invadopodia, suggesting occurrence of profound changes in the actin cytoskeleton organization.( 24 ) In addition, BRCA2‐overexpressing PC‐3 cells were more compact and adherent to adjacent cells than wild‐type cells, reflecting a more ‘adhesive’ and less ‘motile’ cellular phenotype.( 25 ) Cells transfected with non‐specific siRNAs or empty vector were indistinguishable from wild‐type cells (data not shown).
BRCA2 modulates MMP‐9 protein levels. Cancer cells widely employ pericellular proteolysis to penetrate ECM and BM and to invade distant tissues.( 26 ) We hypothesized that in order for BRCA2 to have a meaningful effect upon the ability of neoplastic cells to overcome BM in vivo, there should be a negative regulatory effect upon proteolytic enzymes. We focused our attention upon MMP‐2 and MMP‐9, two gelatinases involved in ECM degradation that are thought to play an important role in prostate cancer metastasis.( 27 , 28 ) First, we analyzed MMP‐2 and MMP‐9 activity in conditioned media by gelatin zymography. As shown in Fig. 4a, a gelanolytic band identical in size (92 kDa) to latent MMP‐9 was increased by 41% upon siRNA‐induced BRCA2 protein knockdown (P < 0.01) but was diminished by 82% in conditioned media of rBRCA2 PC‐3 cells (P < 0.001). In contrast, the 72‐kDa gelanolytic band, representing the product of the MMP‐2 gene,( 29 ) was unchanged by BRCA2 expression. Because changes in MMP‐9 enzyme activity detected by zymography may be the result of increased activity by tissue metalloproteinase inhibitors,( 30 ) we assayed for immunoreactive MMP‐9 and MMP‐2 proteins in conditioned media by Western blotting analysis. As shown in Fig. 4b, the results were similar to the zymography data confirming that the BRCA2‐dependent reduction in MMP‐9 enzyme activity is due to diminished protein amounts. We also demonstrated that the reduction in MMP‐9 levels takes place prior to secretion by performing immunoblotting analysis of total cell extracts. As shown in Fig. 4c, while siRNA‐induced BRCA2 protein knockdown resulted in elevation of intracellular MMP‐9 protein by 43% (P < 0.008), BRCA2 overexpression diminished MMP‐9 levels by 62% (P < 0.002).
Figure 4.
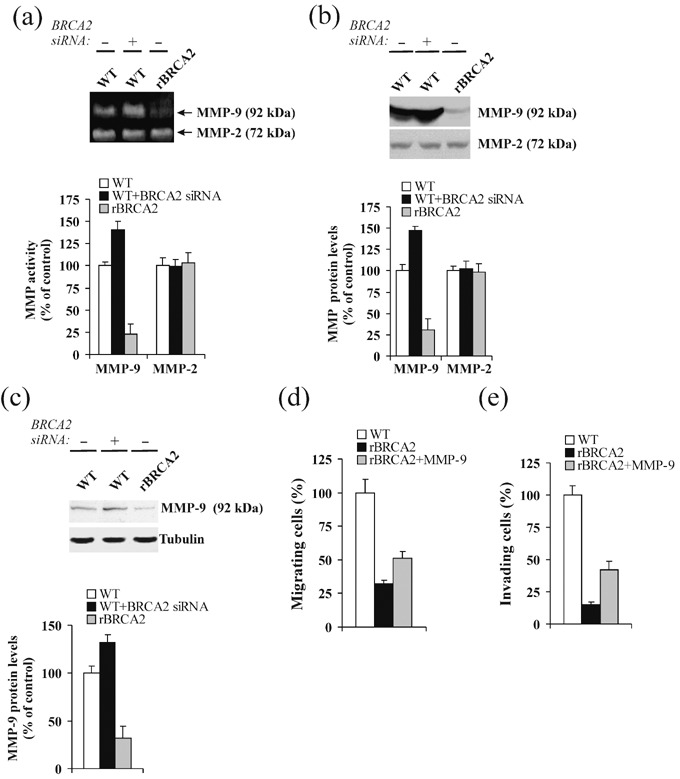
BRCA2 expression modulates matrix metalloproteinase‐9 (MMP‐9) protein levels. (a, b) Wild‐type PC‐3 cells (WT) and PC‐3 cells stably overexpressing BRCA2 (rBRCA2) were transiently transfected for 48 h with a pool of non‐specific siRNAs (–) or siRNAs for BRCA2 and afterwards changed to serum‐free medium. Conditioned medium was harvested after 24 h and 100 µL aliquots were subjected to gelatin zymography (a) or Western blotting analysis of MMP‐2 and MMP‐9 proteins (b). Protein levels were compared to wild‐type PC‐3 cells treated with non‐specific siRNAs, set at 100%. Mean ± SE of three independent experiments is shown. (c) MMP‐9 protein levels were assessed by Western blotting analysis of 100 µg total protein extracts from wild‐type PC‐3 cells (WT) or PC‐3 cells stably overexpressing BRCA2 (rBRCA2) after transient transfections with a pool of non‐specific siRNAs (–) or siRNAs for BRCA2. MMP‐9 levels were normalized to β‐tubulin signals and expressed as a percentage of wild‐type PC‐3 cells treated with non‐specific siRNAs, set at 100%. Mean ± SE of three independent experiments is shown. (d,e) Wild‐type PC‐3 cells (WT) or PC‐3 cells stably overexpressing BRCA2 (rBRCA2) were plated onto transwell insert filters coated with 10 µg/mL collagen type IV (COL4) (d) or Matrigel (e) and allowed to migrate (d) or invade (e) in presence or absence of MMP‐9 (33 ng/mL) in the lower chamber (d) or in the Matrigel matrix (e). After 6 h (d) or 48 h (e), cells at the lower side of the filter were fixed, stained with crystal violet, counted in 10 random fields, and reported (mean ± SE) as percentage of wild‐type PC‐3 cells. A representative experiment of two is shown.
To assess whether exogenous MMP‐9 would modify the non‐invasive phenotype of rBRCA2 cells, we performed migration and invasion assays in the presence of added MMP‐9 into the culture media. As shown in Fig. 4, MMP‐9 promoted rBRCA2 cell migration onto COL4 by 1.6‐fold (P < 0.01; Fig. 4d) and invasion through Matrigel by 2.8‐fold (P < 0.001; Fig. 4e).
BRCA2 reduces MMP‐9 protein stability. Since variations at the transcriptional level may provide an explanation for BRCA2‐dependent changes in MMP‐9 protein expression, we evaluated MMP‐9 mRNA levels by RT‐PCR. As shown in Fig. 5(a), changes in BRCA2 expression had no effect upon MMP‐9 mRNA levels. We then proceeded to investigate post‐transcriptional regulatory mechanisms that could affect MMP‐9 protein levels. To assess whether BRCA2 could modulate MMP‐9 protein stability, protein translation was inhibited with cycloheximide and MMP‐9 steady‐state protein levels were measured by immunoblotting analysis. Cell viability in the presence of cycloheximide was >97%, as measured by Trypan Blue exclusion. As depicted in Fig. 5b, while MMP‐9 protein levels were slightly reduced after 48 h in wild‐type PC‐3 cells (20% decrease; P < 0.02), they declined logarithmically upon BRCA2 overexpression (t 1/2: ~14 h). Conversely, MMP‐9 protein levels remained unchanged for up to 48 h in BRCA2‐depleted cells. Controls were performed to ensure that the solvent itself, as well as transfection with non‐specific siRNAs or empty vector, caused no difference in MMP‐9 steady‐state protein levels (data not shown).
Figure 5.
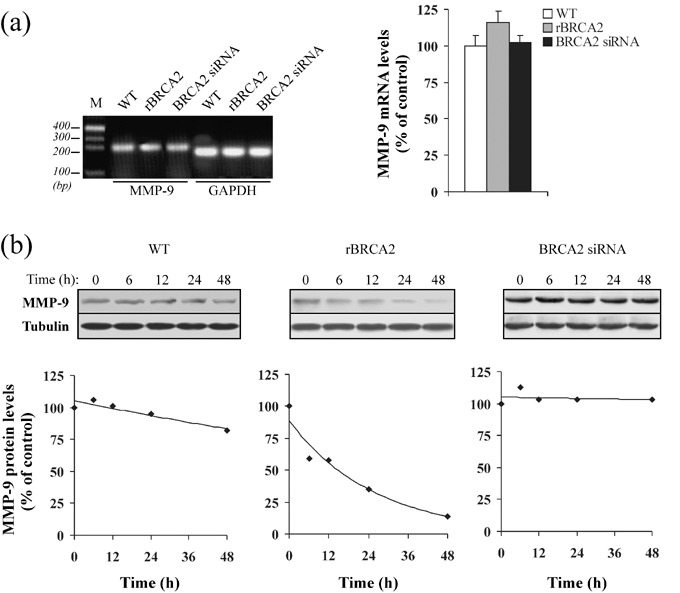
BRCA2 reduces metalloproteinase‐9 (MMP‐9) protein stability. (a) At 80% confluence, wild‐type (WT) and PC‐3 cells transiently transfected for 48 h with BRCA2 siRNA or recombinant BRCA2 cDNA (rBRCA2), were harvested, total RNA was extracted and subjected to reverse transcription – polymerase chain reaction (RT‐PCR) using primers specific for MMP‐9. RT‐PCR of glyceraldehyde‐3‐phosphate dehydrogenase (GAPDH) mRNA was used as internal control. M, molecular size marker. The bar graph on the right was obtained after normalization of MMP‐9 mRNA levels to the GAPDH signal and levels are expressed as a percentage of wild‐type cells. Mean ± SE of three independent experiments is shown. (b) Wild‐type PC‐3 cells (WT) were transiently transfected with either siRNAs for BRCA2 or rBRCA2 and 48 h after transfection the half‐life of MMP‐9 protein was evaluated by addition of cycloheximide (12.5 µg/mL). MMP‐9 steady‐state protein levels were determined by immunoblotting analysis up to 48 h after addition of cycloheximide. Total protein extracts (100 µg) were separated on 10% sodium dodecyl sulfate (SDS)‐polyacrylamide gels under reducing conditions, and immunostained using an antibody to MMP‐9. β‐tubulin was used to normalize the amount of total proteins loaded for each sample. At the bottom, degradation curves of MMP‐9 protein in the presence of cycloheximide are reported. MMP‐9 protein expression levels were calculated as percentage of the protein levels at time 0 (control), set at 100. Consistent results were obtained from two independent experiments.
BRCA2 modulates PI3‐kinase/AKT and MAPK/ERK signaling pathways. To investigate whether the antagonistic effect of BRCA2 upon PC‐3 cell invasive capabilities and MMP‐9 production could be related to modulation of PI3‐kinase/AKT and/or MAPK/ERK signaling pathways, we measured by Western blot analysis the phosphorylation levels of AKT and ERK, downstream targets of PI3‐kinase and MAPK, respectively. As depicted in Fig. 6, rBRCA2 cells exhibited a 61% reduction in Ser473‐AKT phosphorylation (P < 0.002) and concomitantly showed evidence of restored MAPK activation as measured by the presence of phospho‐ERK. On the other hand, wild‐type PC‐3 cells responded to BRCA2 siRNA by further increasing Ser473‐AKT levels by 39% (Fig. 6a; P < 0.02) while levels of phospho‐ERK remained undetectable (Fig. 6b). Mock transfections were performed to ensure that vector alone or non‐specific siRNAs had no effect upon AKT and ERK phosphorylation.
Figure 6.
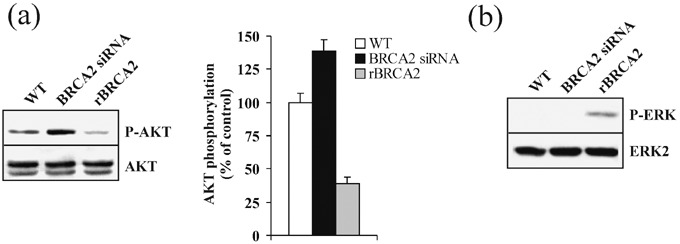
BRCA2 modulates PI3‐kinase/AKT and MAPK/ERK signaling pathways. (a, b) To assess the effect of BRCA2 upon PI3‐kinase/AKT and MAPK/ERK activity, wild‐type PC‐3 cells (WT) were transiently transfected with siRNAs for BRCA2 or recombinant BRCA2 cDNA (rBRCA2). After 48 h, cell protein extracts (100 µg) were separated by 10% sodium dodecyl sulfate – polyacrylamide gel electrophoresis, blotted, and membranes were probed with antiphospho‐Ser‐473 AKT (P‐AKT) (a) or antiphospho‐ERK (P‐ERK) (b). Antibodies against AKT 1/2 (AKT 1/2) and ERK2 (ERK2) were used as controls. Immunoblots are representative of three independent experiments. In (a), phosphorylated AKT levels are compared to wild‐type PC‐3 cell values, set at 100%. Data are expressed as mean ± SE.
Activation of PI3‐kinase/AKT and inactivation of MAPK/ERK promote prostate cancer cell migration and invasion. To assess whether BRCA2‐induced changes of PI3‐kinase and MAPK pathways were directly related to BRCA2‐dependent inhibition of PC‐3 cell invasion, we performed migration and invasion assays in wild‐type PC‐3 cells transiently transfected with a dominant negative PI3‐kinase (Δp85) or a constitutively active form of MEK1 (ca‐MEK), an ERK upstream kinase. As shown in Fig. 7, Δp85 and ca‐MEK inhibited PC‐3 cell migration onto COL4 by 91% and 64%, respectively (P < 0.001, Fig. 7a) and prevented cell invasion through Matrigel by 100% and 65%, respectively (P < 0.001, Fig. 7b). We subsequently performed complementary experiments on rBRCA2 cells transiently expressing a constitutively active form of PI3‐kinase (ca‐p110) or treated with the MEK1 inhibitor PD98059. As shown in Fig. 7, rBRCA2 cell migration onto COL4 was increased by 3‐ and 2‐fold, respectively (P < 0.004), and invasion through Matrigel increased by 6.2‐ and 4.3‐fold, respectively (P < 0.001). Of note, ca‐p110 rescued any effect that rBRCA2 expression had upon cell phenotype, conferring migratory and invasive capabilities similar to wild‐type PC‐3 cells.
Figure 7.
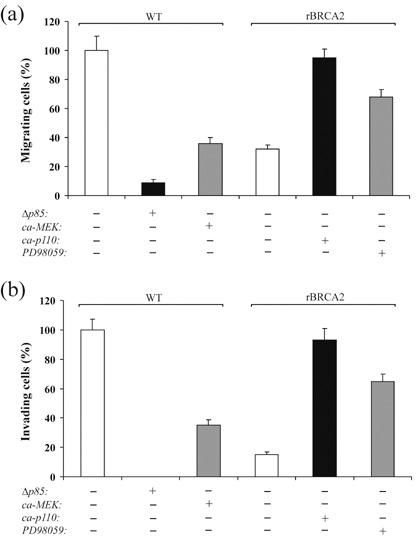
Activation of PI3‐kinase/AKT and inactivation of MAPK/ERK promote prostate cancer cell migration and invasion. (a, b) Wild‐type PC‐3 cells (WT) and PC‐3 cells stably expressing BRCA2 (rBRCA2) were transiently transfected for 24 h with either a dominant negative PI3‐kinase p85 subunit (Δp85), a constitutively active MEK1 (ca‐MEK), a constitutively active PI3‐kinase p110 subunit (ca‐p110) or empty vector, or treated for 24 h with the MEK1 inhibitor PD98059, after which cell migration (a) and invasion (b) assays were performed by plating 1.0 × 10⁵ cells onto transwell insert filters coated with 10 µg/mL collagen type IV (a) or Matrigel (b). After 6 h (a) or 48 h (b), cells at the lower side of the filter were fixed, stained with crystal violet, counted in 10 random fields, and reported (mean ± SE) as percentage of mock transfected WT cells, set at 100%. A representative experiment of two is shown.
PI3‐kinase/AKT and MAPK/ERK have opposing effect upon MMP‐9 levels in prostate cancer cells. PI3‐kinase and MAPK/ERK pathways have been shown to regulate MMP‐9 expression in a number of cell types.( 31 , 32 , 33 ) To determine whether PI3‐kinase/AKT and MAPK/ERK signaling are required for MMP‐9 expression in prostate carcinoma, wild‐type PC‐3 cells were transiently transfected with either Δp85 or ca‐MEK. As shown in Fig. 8a, inhibition of PI3‐kinase or activation of MAPK/ERK reduced MMP‐9 protein levels by 2.3‐ and 1.9‐fold, respectively (P < 0.001). A similar effect was obtained by using the PI 3‐kinase pharmacological inhibitor LY294002 (data not shown). The blots were stripped and subsequently probed with antibodies to phospho‐AKT Ser473 and phospho‐ERK. While constitutive activation of MEK did not affect AKT phosphorylation, inhibition of PI3‐kinase resulted in increased ERK phosphorylation. As expected,( 18 ) expression of dominant negative PI3‐kinase resulted in more than 80% inhibition of AKT phosphorylation (Fig. 8a; P < 0.0001). We subsequently performed complementary experiments on rBRCA2 cells transiently expressing ca‐p110 or treated with PD98059. As shown in Fig. 8b, activation of PI3‐kinase or inhibition of MAPK/ERK increased MMP‐9 protein levels by 2.1‐ and 1.8‐fold, respectively (P < 0.001). Expression of ca‐p110 resulted in a 3.2‐fold increase in phospho‐Ser473 AKT levels (P < 0.001) and 43% decrease in phospho‐ERK (P < 0.002). Control experiments did not show any variation in MMP‐9, phospho‐AKT, or phospho‐ERK levels after cell treatment with solvent alone or empty vector.
Figure 8.
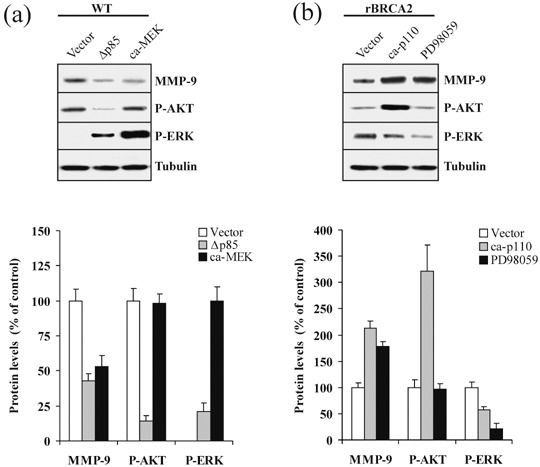
PI3‐kinase/AKT and MAPK/ERK have opposing effect upon metalloproteinase‐9 (MMP‐9) levels in prostate cancer cells. (a) To assess the effect of PI3‐kinase/AKT and MAPK/ERK upon MMP‐9 levels, wild‐type PC‐3 cells (WT) were transiently transfected with empty vector (Vector), dominant negative PI3‐kinase p85 subunit (Δp85), or constitutively active MEK1 (ca‐MEK). After 24 h, 100 µg of cell extracts were separated by 10% sodium dodecyl sulfate – polyacrylamide gel electrophoresis, blotted, and membranes were probed with antibodies against MMP‐9, phospho‐Ser‐473 AKT (P‐AKT), and phospho‐ERK (P‐ERK). β‐tubulin signals were used as loading controls. At the bottom, MMP‐9 and P‐AKT levels are reported as percentage of WT cells, set at 100%. Since WT cells have no detectable evidence of MAPK/ERK activity, P‐ERK levels are reported as percentage of ca‐MEK transfected cells, set at 100%. Mean ± SE of three independent experiments is shown. (b) PC‐3 cells stably overexpressing BRCA2 (rBRCA2) were transiently transfected with empty vector (Vector), constitutively active PI3‐kinase p110 subunit (ca‐p110) or treated with the MEK1 inhibitor PD98059. After 24 h, cell extracts were analyzed by immunoblotting with antibodies against MMP‐9, phospho‐Ser‐473 AKT (P‐AKT), and phospho‐ERK (P‐ERK). β‐tubulin signals were used as loading controls. At the bottom, MMP‐9, P‐AKT, and P‐ERK levels are reported as percentage of rBRCA2 cells, set at 100%. Mean ± SE of three independent experiments is shown.
Discussion
We have uncovered evidence demonstrating that BRCA2 intersects with a number of signaling pathways that appear crucial in determining the phenotypic characteristics commonly associated with the development of prostate cancer metastasis. Evidence has been provided showing that BRCA2 inhibits neoplastic cell proliferation in pancreatic, breast and prostate carcinoma cells.( 15 , 16 , 17 , 18 , 19 ) Our experiments now show that expression of BRCA2 is sufficient to markedly inhibit the ability of highly invasive PC‐3 prostate cancer cells to migrate along FN, BM proteins and COL1 as well as to invade through thick layers of Matrigel, a reconstituted BM matrix, thus unraveling for the first time the role of BRCA2 in limiting the metastatic potential of cancer cells.
In this study, we demonstrate that loss of BRCA2 expression is a relevant event in a significant number of prostate adenocarcinoma cases. In tissue microarrays, we show that while 80% of normal and BPH specimens showed strong nuclear BRCA2 expression, 77% of prostate adenocarcinomas exhibited decreased or absent nuclear BRCA2 protein. Immunohistochemical analysis using a different commercial antibody generated against the BRCA2 N‐terminal domain confirmed loss of nuclear BRCA2 protein in prostate cancer specimens (L. Moro, manuscript in preparation). These results are in agreement with a previous immunohistochemical analysis performed on the Noble rat model showing markedly decreased BRCA2 expression in dysplastic and neoplastic prostate lesions,( 34 ) and highlight the significance of the BRCA2 oncogenic pathway in the pathobiology of prostate cancer in vivo. Clinical evidence suggesting that the BRCA2 pathway may be relevant in neoplasms arising in other tissues besides prostate is also emerging, such as a recent study showing that loss of heterozygosity at the BRCA2 locus (13q12‐13) is a significant predictor for reduced long‐term survival and earlier metastatic disease in patients affected with sporadic breast cancer.( 35 )
The early events in cancer cell invasion and metastasis involve degradation of the basal lamina and surrounding ECM, a process mediated partly by MMPs.( 26 ) We demonstrate that loss of BRCA2 promotes MMP‐9 production but has no effect upon MMP‐2, another regulator of cancer invasion.( 36 ) Overexpression of MMP‐9 has been detected in prostate cancer specimens in vivo, ( 37 , 38 , 39 ) and it seems to be an important feature of the invasive phenotype as demonstrated by the ability of exogenous MMP‐9 to partly restore migratory and invasive capabilities to non‐invasive BRCA2‐overexpressing PC‐3 cells. This finding would provide a plausible mechanistic support to clinical studies demonstrating the usefulness of antisense strategies targeting MMP‐9 in limiting prostate cancer cell invasion.( 28 ) MMP‐9 expression is largely controlled by transcription,( 40 ) although mRNA stability,( 41 ) and translational efficiency,( 42 ) also play a role in regulating the amounts of the protein product. We show that the BRCA2‐dependent regulation of MMP‐9 production does not occur at the mRNA level, but involves a post‐translational mechanism through modulation of MMP‐9 protein degradation. Indeed, while BRCA2 overexpression causes a significant reduction of MMP‐9 protein half‐life, BRCA2 knockdown stabilizes the MMP‐9 protein, resulting in increased MMP‐9 levels. To our knowledge, this is the first time that MMP‐9 is shown to be regulated at the step of protein stability. Since MMP‐9 is tightly associated with invasion and metastasis, these findings suggest that promotion of BRCA2‐mediated degradation of MMP‐9 may provide new strategies for prevention of cancer metastasis.
Activation of PI3‐kinase/AKT is a critical event in human prostate cancer biology in vivo,( 3 , 43 , 44 ) since it promotes progression of prostate cancer cells to a more invasive phenotype.( 4 ) We have recently shown that β1‐integrin‐mediated prostate cancer cell interaction with BM proteins,( 18 ) or COL1,( 16 ) aberrantly triggers PI3‐kinase/AKT activation, resulting in BRCA2 degradation. Our experiments now unveil a new mechanism whereby BRCA2 itself would exercise an inhibitory influence upon PI3‐kinase/AKT signaling pathway as evidenced by decrease in AKT phosphorylation in BRCA2‐overexpressing PC‐3 cells and increase in phospho‐AKT upon BRCA2 depletion by siRNA. Thus, it is conceivable that BRCA2 might act as a regulatory element in an autocrine loop involving PI3‐kinase/AKT that would orchestrate cancer cell proliferation and stromal invasion. Whether BRCA2 may regulate the PI3‐kinase/AKT activity by modulating the expression levels of component/s of this pathway through its transcriptional regulator activity,( 13 ) or by direct association affecting protein stability,( 17 ) remains to be investigated. In our experiments, the decrease in PI3‐kinase activity allows for ERK phosphorylation to occur, supporting our previous conclusions of a cross‐talk between these two pathways in prostate cancer cells.( 19 ) However, the contribution of MAPK/ERK inactivation to the overall neoplastic transformation seems to be limited, as demonstrated by the limited success of a constitutively active MEK1 mutant in preventing PC‐3 cell invasion through Matrigel, compared to the virtual complete inhibition in response to a dominant negative form of PI3‐kinase, further supporting the pivotal role of PI3‐kinase/AKT in the progression of prostate cancer to a highly invasive phenotype.( 4 )
It has been reported that activation of the PI3‐kinase/AKT pathway may favor the transition to an invasive phenotype by promoting the secretion of MMPs, including MMP‐9.( 5 , 6 , 7 , 31 , 32 , 33 ) Our experiments show that genetic or pharmacological inhibition of PI3‐kinase or forced activation of MAPK/ERK are both able to inhibit MMP‐9 expression in PC‐3 cells, demonstrating that these signaling pathways may have opposite roles in the regulation of MMP‐9. However, this is not universally the case as it has been shown that MMP‐9 secretion in Balb 3T3 cells treated with the proinflammatory cytokine IL‐1β results from the synergistic activation of both AKT and ERK.( 31 ) In prostate cells, we show that changes in MMP‐9 production in response to BRCA2 levels result from changes in PI3‐kinase/AKT and MAPK/ERK activity, as demonstrated by the ability of a constitutively active form of PI3‐kinase or a MEK1 inhibitor to increase MMP‐9 production in PC‐3 cells overexpressing rBRCA2. We also show that BRCA2 overexpression results in pronounced alterations in cell morphology, from angulated and spindle, to round, compact and ‘adhesive’, suggesting the occurrence of changes in actin cytoskeleton organization.( 24 ) Since PI3‐kinase, besides increasing MMP‐9 production, may promote cell invasion partly by activating the Rho signaling cascade that effectively controls actin cytoskeletal organization and cell motility,( 5 , 6 , 7 ) it is conceivable that the BRCA2 antimetastatic effect may also involve a negative regulation of Rho‐family members.
In summary, we have uncovered evidence demonstrating that loss of BRCA2 may facilitate cancer cell migration and invasion, two important determinants of metastasis, through a mechanism that involves PI3‐kinase/AKT activation and MMP‐9 secretion. These results along with previous studies demonstrating that loss of BRCA2 stimulates cancer cell proliferation,( 15 , 16 , 18 ) make the BRCA2 oncogenic pathway an ideal target for innovative therapeutic strategies aimed at modifying the natural history of cancer.
Acknowledgments
This work was supported by the C.N.R.‐Short‐term Mobility Program 2006 (to L. M.) and the MIUR‐Contributi Straordinari di ricerca/aree obiettivo 1 grant (to E. M). We are grateful to Dr M. C. Hung for the BRCA2 cDNA construct and Dr M. Cobb for the constitutively active MEK1 cDNA.
References
- 1. Furuta E, Bandyopadhyay S, Iiizumi M, Mohinta S, Zhan R, Watabe K. The role of tumor metastasis suppressors in cancers of breast and prostate. Front Biosci 2006; 11: 2845–60. [DOI] [PubMed] [Google Scholar]
- 2. Friedl P, Wolf K. Tumour‐cell invasion and migration: diversity and escape mechanisms. Nat Rev Cancer 2003; 3: 362–74. [DOI] [PubMed] [Google Scholar]
- 3. Paweletz CP, Charboneau L, Bichsel VE et al . Reverse phase protein microarrays which capture disease progression show activation of pro‐survival pathways at the cancer invasion front. Oncogene 2001; 20: 1981–9. [DOI] [PubMed] [Google Scholar]
- 4. Shukla S, Maclennan GT, Hartman DJ, Fu P, Resnick MI, Gupta S. Activation of PI3K‐Akt signaling pathway promotes prostate cancer cell invasion. Int J Cancer 2007; 121: 1424–32. [DOI] [PubMed] [Google Scholar]
- 5. Thant AA, Nawa A, Kikkawa F et al . Fibronectin activates matrix metalloproteinase‐9 secretion via the MEK1‐MAPK and the PI3K‐Akt pathways in ovarian cancer cells. Clin Exp Metastasis 2000; 18: 423–8. [DOI] [PubMed] [Google Scholar]
- 6. Bonaccorsi L, Marchiani S, Muratori M, Carloni V, Forti G, Baldi E. Signaling mechanisms that mediate invasion in prostate cancer cells. Ann NY Acad Sci 2004; 1028: 283–8. [DOI] [PubMed] [Google Scholar]
- 7. Li L, Ittmann MM, Ayala G et al . The emerging role of the PI3‐K‐Akt pathway in prostate cancer progression. Prostate Cancer Prostatic Dis 2005; 8: 108–18. [DOI] [PubMed] [Google Scholar]
- 8. Venkitaraman AR. Cancer susceptibility and the functions of BRCA1 and BRCA2. Cell 2002; 108: 171–82. [DOI] [PubMed] [Google Scholar]
- 9. Edwards SM, Kote‐Jarai Z, Meitz J et al . Two percent of men with early‐onset prostate cancer harbor germline mutations in the BRCA2 gene. Am J Hum Genet 2003; 72: 1–12. [DOI] [PMC free article] [PubMed] [Google Scholar]
- 10. Liede A, Karlan BY, Narod SA. Cancer risks for male carriers of germline mutations in BRCA1 or BRCA2: a review of the literature. J Clin Oncol 2004; 22: 735–42. [DOI] [PubMed] [Google Scholar]
- 11. Gudmundsson J, Johannesdottir G, Bergthorsson JT et al . Different tumor types from BRCA2 carriers show wild‐type chromosome deletions on 13q12‐q13. Cancer Res 1995; 55: 4830–2. [PubMed] [Google Scholar]
- 12. Moynahan ME, Pierce AJ, Jasin M. BRCA2 is required for homology‐directed repair of chromosomal breaks. Mol Cell 2001; 7: 263–72. [DOI] [PubMed] [Google Scholar]
- 13. Yoshida K, Miki Y. Role of BRCA1 and BRCA2 as regulators of DNA repair, transcription, and cell cycle in response to DNA damage. Cancer Sci 2004; 95: 866–71. [DOI] [PMC free article] [PubMed] [Google Scholar]
- 14. Boulton SJ. Cellular functions of the BRCA tumour‐suppressor proteins. Biochem Soc Trans 2006; 34: 633–45. [DOI] [PubMed] [Google Scholar]
- 15. Wang SC, Shao R, Pao AY, Zhang S, Hung MC, Su LK. Inhibition of cancer cell growth by BRCA2. Cancer Res 2002; 62: 1311–14. [PubMed] [Google Scholar]
- 16. Moro L, Arbini AA, Marra E, Greco M. Down‐regulation of BRCA2 expression by collagen type I promotes prostate cancer cell proliferation. J Biol Chem 2005; 280: 22482–91. [DOI] [PubMed] [Google Scholar]
- 17. Tian XX, Rai D, Li J et al . BRCA2 suppresses cell proliferation via stabilizing MAGE‐D1. Cancer Res 2005; 65: 4747–53. [DOI] [PMC free article] [PubMed] [Google Scholar]
- 18. Moro L, Arbini AA, Marra E, Greco M. Up‐regulation of Skp2 after prostate cancer cell adhesion to basement membranes results in BRCA2 degradation and cell proliferation. J Biol Chem 2006; 281: 22100–7. [DOI] [PubMed] [Google Scholar]
- 19. Moro L, Arbini AA, Marra E, Greco M. Constitutive activation of MAPK/ERK inhibits prostate cancer cell proliferation through upregulation of BRCA2. Int J Oncol 2007; 30: 217–24. [DOI] [PubMed] [Google Scholar]
- 20. Huang J, Yao JL, Zhang L et al . Differential expression of interleukin‐8 and its receptors in the neuroendocrine and non‐neuroendocrine compartments of prostate cancer. Am J Pathol 2005; 166: 1807–15. [DOI] [PMC free article] [PubMed] [Google Scholar]
- 21. Ni J, Wen X, Yao J et al . Tocopherol‐associated protein suppresses prostate cancer cell growth by inhibition of the phosphoinositide 3‐kinase pathway. Cancer Res 2005; 65: 9807–16. [DOI] [PubMed] [Google Scholar]
- 22. Moro L, Perlino E, Marra E, Languino LR, Greco M. Regulation of beta1C and beta1A integrin expression in prostate carcinoma cells. J Biol Chem 2004; 279: 1692–702. [DOI] [PubMed] [Google Scholar]
- 23. Buccione R, Orth JD, McNiven MA. Foot and mouth. podosomes, invadopodia and circular dorsal ruffles. Nat Rev Mol Cell Biol 2004; 5: 647–57. [DOI] [PubMed] [Google Scholar]
- 24. Leung TH, Ching YP, Yam JW et al . Deleted in liver cancer 2 (DLC2) suppresses cell transformation by means of inhibition of RhoA activity. Proc Natl Acad Sci USA 2005; 102: 15207–12. [DOI] [PMC free article] [PubMed] [Google Scholar]
- 25. Zi X, Guo Y, Simoneau AR et al . Expression of Frzb/secreted Frizzled‐related protein 3, a secreted Wnt antagonist, in human androgen‐independent prostate cancer PC‐3 cells suppresses tumor growth and cellular invasiveness. Cancer Res 2005; 65: 9762–70. [DOI] [PubMed] [Google Scholar]
- 26. Gupta GP, Massague J. Cancer metastasis: building a framework. Cell 2006; 127: 679–95. [DOI] [PubMed] [Google Scholar]
- 27. Li Y, Kucuk O, Hussain M, Abrams J, Cher ML, Sarkar FH. Antitumor and antimetastatic activities of docetaxel are enhanced by genistein through regulation of osteoprotegerin/receptor activator of nuclear factor‐kappaB (RANK) /RANK ligand/MMP‐9 signaling in prostate cancer. Cancer Res 2006; 66: 4816–25. [DOI] [PubMed] [Google Scholar]
- 28. London CA, Sekhon HS, Arora V, Stein DA, Iversen PL, Devi GR. A novel antisense inhibitor of MMP‐9 attenuates angiogenesis, human prostate cancer cell invasion and tumorigenicity. Cancer Gene Ther 2003; 10: 823–32. [DOI] [PubMed] [Google Scholar]
- 29. Collier IE, Bruns GA, Goldberg GI, Gerhard DS. On the structure and chromosome location of the 72‐ and 92‐kDa human type IV collagenase genes. Genomics 1991; 9: 429–34. [DOI] [PubMed] [Google Scholar]
- 30. Van den Steen PE, Dubois B, Nelissen I, Rudd PM, Dwek RA, Opdenakker G. Biochemistry and molecular biology of gelatinase B or matrix metalloproteinase‐9 (MMP‐9). Crit Rev Biochem Mol Biol 2002; 37: 375–536. [DOI] [PubMed] [Google Scholar]
- 31. Ruhul Amin AR, Senga T, Oo ML, Thant AA, Hamaguchi M. Secretion of matrix metalloproteinase‐9 by the proinflammatory cytokine, IL‐1beta. A role for the dual signalling pathways, Akt and Erk. Genes Cells 2003; 8: 515–23. [DOI] [PubMed] [Google Scholar]
- 32. Jorda M, Olmeda D, Vinyals A et al . Upregulation of MMP‐9 in MDCK epithelial cell line in response to expression of the snail transcription factor. J Cell Sci 2005; 118: 3371–85. [DOI] [PubMed] [Google Scholar]
- 33. Iyer V, Pumiglia K, DiPersio CM. Alpha3beta1 integrin regulates MMP‐9 mRNA stability in immortalized keratinocytes: a novel mechanism of integrin‐mediated MMP gene expression. J Cell Sci 2005; 118: 1185–95. [DOI] [PubMed] [Google Scholar]
- 34. Yuen MT, Leung LK, Wang J, Wong YC, Chan FL. Enhanced induction of prostatic dysplasia and carcinoma in Noble rat model by combination of neonatal estrogen exposure and hormonal treatments at adulthood. Int J Oncol 2005; 27: 1685–95. [PubMed] [Google Scholar]
- 35. Hampl JA, Hampl M, Reiss G, Koch R, Saeger HD, Schackert HK. Loss of BRCA2 correlates with reduced long‐term survival of sporadic breast cancer patients. Anticancer Res 2004; 24: 281–90. [PubMed] [Google Scholar]
- 36. Trudel D, Fradet Y, Meyer F, Harel F, Tetu B. Significance of MMP‐2 expression in prostate cancer: an immunohistochemical study. Cancer Res 2003; 63: 8511–5. [PubMed] [Google Scholar]
- 37. Zhang L, Shi J, Feng J, Klocker H, Lee C, Zhang J. Type IV collagenase (matrix metalloproteinase‐2 and ‐9) in prostate cancer. Prostate Cancer Prostatic Dis 2004; 7: 327–32. [DOI] [PubMed] [Google Scholar]
- 38. Ishimaru H, Kageyama Y, Hayashi T, Nemoto T, Eishi Y, Kihara K. Expression of matrix metalloproteinase‐9 and bombesin/gastrin‐releasing peptide in human prostate cancers and their lymph node metastases. Acta Oncol 2002; 41: 289–96. [DOI] [PubMed] [Google Scholar]
- 39. Cardillo MR, Di Silverio F, Gentile V. Quantitative immunohistochemical and in situ hybridization analysis of metalloproteinases in prostate cancer. Anticancer Res 2006; 26: 973–82. 16619495 [Google Scholar]
- 40. Nair RR, Solway J, Boyd DD. Expression cloning identifies transgelin (SM22) as a novel repressor of 92‐kDa type IV collagenase (MMP‐9) expression. J Biol Chem 2006; 281: 26424–36. [DOI] [PubMed] [Google Scholar]
- 41. Sehgal I, Thompson TC. Novel regulation of type IV collagenase (matrix metalloproteinase‐9 and ‐2) activities by transforming growth factor‐beta1 in human prostate cancer cell lines. Mol Biol Cell 1999; 10: 407–16. [DOI] [PMC free article] [PubMed] [Google Scholar]
- 42. Jiang Y, Muschel RJ. Regulation of matrix metalloproteinase‐9 (MMP‐9) by translational efficiency in murine prostate carcinoma cells. Cancer Res 2002; 62: 1910–4. [PubMed] [Google Scholar]
- 43. Kreisberg JI, Malik SN, Prihoda TJ et al . Phosphorylation of Akt (Ser473) is an excellent predictor of poor clinical outcome in prostate cancer. Cancer Res 2004; 64: 5232–6. [DOI] [PubMed] [Google Scholar]
- 44. Malik SN, Brattain M, Ghosh PM et al . Immunohistochemical demonstration of phospho‐Akt in high Gleason grade prostate cancer. Clin Cancer Res 2002; 8: 1168–71. [PubMed] [Google Scholar]