

Abstract
Class A scavenger receptors (SR‐A, CD204) are highly expressed in tumor‐associated macrophages (TAM). To investigate the function of SR‐A in TAM, wild‐type and SR‐A‐deficient (SR‐A−/−) mice were injected with EL4 cells. Although these groups of mice did not differ in the numbers of infiltrating macrophages and lymphocytes and in neovascularization, SR‐A−/− mice had delayed growth of EL4 tumors. Expression of inducible nitric oxide (NO) synthase and interferon (IFN)‐γ mRNA increased significantly in tumor tissues from SR‐A−/− mice. Engulfment of necrotic EL4 cells induced upregulation of NO and IFN‐γ production by cultured macrophages, and production of NO and IFN‐γ increased in SR‐A−/− macrophages in vitro. IFN‐β production by cultured macrophages was also elevated in SR‐A−/− macrophages in vitro. These results suggested that the antitumor activity of macrophages increased in SR‐A−/− mice because of upregulation of NO and IFN‐γ production. These data indicate an important role of SR‐A in regulating TAM function by inhibiting toll‐like receptor (TLR)4–IFN‐β signaling. (Cancer Sci 2009); 00: 000–000)
The tumor microenvironment contains many non‐tumor cells such as fibroblasts, endothelial cells, and leukocytes.( 1 , 2 ) Among tumor‐infiltrated leukocytes, macrophages are the major component, and these infiltrated macrophages are referred to as tumor‐associated macrophages (TAM).( 1 , 2 , 3 , 4 , 5 ) TAM release many proangiogenic cytokines and growth factors, such as vascular endothelial growth factor, interleukin (IL)‐8, and basic fibroblast growth factor, that aid tumor progression.( 1 , 2 , 3 , 4 , 5 )
Class A scavenger receptors (SR‐A, CD204) are one class of principal receptors of macrophages.( 6 , 7 ) In the mouse, SR‐A are expressed on macrophages, dendritic cells, and sinusoidal endothelial cells in liver.( 6 , 8 ) The SR‐A bind various negatively charged macromolecules, such as modified low‐density lipoproteins, fucoidan, advanced glycation end‐products, denatured collagen, bacterial components, and apoptotic cells.( 6 , 8 ) SR‐A‐positive TAM play a pivotal role in the progression of ovarian and prostate cancers.( 9 , 10 ) We have also found SR‐A‐positive macrophages to be involved in tumor cell proliferation in human glioblastomas.( 11 )
SR‐A‐deficient (SR‐A−/−) mice are more susceptible to endotoxic mortality caused by overproduction of proinflammatory cytokines such as tumor necrosis factor (TNF)‐α.( 12 ) Several studies have also demonstrated that SR‐A regulate the production of cytokines, such as TNF‐α, IL‐6, and IL‐12, and inducible nitric oxide synthase (iNOS) in response to various inflammatory stimuli.( 11 , 13 , 14 ) These observations indicate that SR‐A may act as inhibitory receptors on activated macrophages; however, the mechanisms of these SR‐A‐related inhibitory signals have not been well elucidated. Recently, Seimon and colleagues demonstrated that suppression of the IFN regulatory factor‐3 branch of TLR4 signaling by SR‐A ligands correlates with apoptosis in endoplasmic reticulum‐stressed macrophages.( 15 ) In tumor tissues, endogenous (host‐derived) ligands for TLR have been identified.( 16 , 17 ) Heat shock protein 70 and chromatin component high mobility group box 1 protein released from necrotic cancer cells were found to activate macrophages through TLR4 and the receptor for advanced glycation end‐products, respectively.( 18 , 19 )
Although SR‐A are pattern recognition receptors, as is TLR4, it is not clear whether SR‐A expression in TAM is associated with downregulation of macrophage activation. In the present study, we report the delay of EL4 lymphoma growth in SR‐A−/− mice. Elevated production of nitric oxide (NO) and IFN‐γ in SR‐A−/− TAM is believed to suppress tumor growth. Our studies suggest that SR‐A plays an important role in regulating the antitumor activity of TAM.
Materials and Methods
Mice and cell lines. C57BL/6J (Clea Japan, Tokyo, Japan) and SR‐A−/− mice (C57BL/6J background)( 20 ) were maintained under specific‐pathogen‐free conditions at the Animal Resource Facility at Kumamoto University. Animal care and experiments were approved by the Animal Committee at Kumamoto University. The EL4 lymphoma cell line was maintained in RPMI‐1640 medium supplemented with 10% FBS. Mice received s.c. injections of 2 × 10⁵ tumor cells into the left flank. For the intraperitoneal tumor model, EL4 cells (4 × 10⁵ cells/mouse) were injected into the peritoneal cavity. TAM were isolated from ascites by using F4/80 and secondary antibody‐coupled magnet beads (Mylteny Biotec, Bergish Gladbach, Germany).
Antibodies. To detect macrophages in tumor tissues, antimouse CD68 antibody (FA11; Serotec, Oxford, UK) was used. CD31 was identified with rat‐antimouse CD31 (ER‐MP12; BMA Biomedicals, Augst, Switzerland). Lymphocytes were detected with anti‐CD8 antibody (KT15; Serotec). Natural killer (NK) cells were examined with anti‐NK1.1 antibody (FITC‐conjugated; BioLegend, San Diego, CA, USA). To visualize apoptotic cells, anti‐ssDNA polyclonal antibody (Dako, Glostrup, Denmark) was used. iNOS immunostaining was done with rabbit polyclonal anti‐iNOS antibody (Lab Vision, Fremont, CA, USA). To analyze IFN‐γ production, anti‐IFN‐γ antibody (XMG1.2; BioLegend, San Diego, CA) was used for immunostaining.
Measurement of proliferating activity. Tumor tissues were fixed in 10% neutral‐buffered formalin and embedded in paraffin. After initial deparaffinization, sections were microwaved in distilled water for 5 min to unmask the epitope and then treated with protein‐blocking solution (Block‐Ace; Yukijirushi, Tokyo, Japan). Sections were reacted with anti‐proliferating cell nuclear antigen (PCNA) antibody (Dako) and were then incubated with HRP‐labeled goat‐antimouse IgG (Nichirei, Tokyo, Japan). The reaction was visualized by use of diaminobenzidine. Slides were counterstained with hematoxylin. Control slides were incubated with normal mouse IgG (DAKO) instead of the primary antibody, and control results were invariably negative.
Macrophage culture. To generate mouse bone marrow‐derived macrophages, bone marrow cells were isolated from femurs and tibias of 8‐week‐old C57BL/6J WT mice and SR‐A−/− mice. Bone marrow cells were plated in 24‐well plates (1 × 10⁶ cells/well) in quadruplicate and were then cultured for 6 days with 10 ng/mL granulocyte‐macrophage colony‐stimulating factor (GM‐CSF) (PeproTech, Rocky Hill, NJ, USA).
Proliferation assay of EL4 cells. Proliferation of cells was assayed with standard [3H]thymidine incorporation and scintillation counting. Briefly, after macrophages differentiated with GM‐CSF were plated in 24‐well plates (1 × 10⁵/well), EL4 cells (4 × 10⁵/well) were added and cocultured for 72 h. Cells were labeled with [3H]thymidine for 18 h before terminating the culture. [3H]Thymidine incorporation in the presence or absence of EL4 was analyzed and was normalized to the level of incorporation measured in EL4 cultured with WT macrophages. N G‐Nitro‐l‐arginine methyl ester (l‐NAME) and its inactive enantiomer N G‐nitro‐d‐arginine methyl ester (d‐NAME) were purchased from Sigma (St Louis, MO, USA).
Immunohistochemical staining. Tumor tissues were fixed in a periodate–lysine–paraformaldehyde fixative. After tissues were embedded in OCT compound (Sakura Finetek, Tokyo, Japan), cryostat sections were cut, mounted on silane‐coated slides, and dried in air. Endogenous peroxidase activity was inhibited, after which the indirect immunoperoxidase method was used. After sections were incubated with one of the primary antibodies, HRP‐labeled goat‐anti‐rat IgG was used as a secondary antibody (Nichirei). For the immunofluorescence study, Alexa Fluor 488 goat‐antirat IgG or Alexa Fluor 546 goat‐antirabbit IgG (Molecular Probes, Eugene, OR, USA) was used as the secondary antibody.
Transmission electron microscopy. Tumors obtained on day 14 were fixed, embedded in Epon 812, cut, and evaluated as described previously.( 21 )
Real‐time PCR. To estimate the expression levels of IFN‐β, IFN‐γ, iNOS, TNF‐α, IL‐10, and IL‐12p40 in tumor tissue and cultured macrophages, we used ABI PRISM 7300 Sequence Detection System and Assay‐on‐Demand gene expression kits (Applied Biosystems, Foster City, CA, USA). Rodent 18S rRNA control reagent VIC was used as an endogenous control. To provide a relative standard curve, a serial dilution of activated macrophage cDNA was prepared. Relative quantification values of the target genes were standardized according to the value of endogenous 18S rRNA. Representative data are from two or three independent experiments done in triplicate.
RT‐PCR. Total RNA was extracted using an RNA STAT‐60 extraction kit (Tel‐Test, Friendswood, TX, USA). RNA was reversed transcribed using the ExScript RT kit (Takara Bio, Shiga, Japan). The primers used were as follows:
TNF‐α: sense 5′‐GGCAGGTCTACTTTGGAGTCATTGC‐3′, antisense 5′‐ACATTCGAGGCTCCAGTGAATTCGG‐3′;
IFN‐β: sense 5′‐TCCAAGAAAGGACGAACATTCG‐3′, antisense 5′‐TGAGGACATCTCCCACGTCAA‐3′;
IFN‐γ: sense 5′‐AGCGGCTGACTGAACTCAGATTGTAG‐3′, antisense 5′‐GTCACAGTTTTCAGCTGTATAGGG‐3′;
iNOS: sense 5′‐CCTTGTTCAGCTACGCCTTC‐3′, antisense 5′‐AAGGCCAAACACAGCATACC‐3′;
IL‐10: sense 5′‐TCCTTAATGCAGGACTTTAAGGGTT‐3′, antisense 5′‐GACACCTTGGTCTTGGAGCTTATT‐3′;
IL‐12p40: sense 5′‐CTCACCTGTGACACGCCTGA‐3′, antisense 5′‐CAGGACACTGAATACTTCTC‐3′; and
GAPDH: sense 5′‐GGAAAGCTGTGGCGTGATG‐3′, antisense 5′‐CTGTTGCTGTAGCCGTATTC‐3′.
NO assay and cytokine measurement. Dead EL4 (dEL4) cells were generated by using UV irradiation for 6–8 h, and 5 × 10⁶ dEL4 cells were added to each well containing macrophages with lipopolysaccharide (LPS) stimulation. dEL4 cells were analyzed via double staining with FITC‐labeled annexin V and propidium iodide (R&D Systems, Germany). Flow cytometric analysis revealed that dEL4 cells were stained positively with FITC‐labeled annexin V and propidium iodide (data not shown). They were shown to be necrotic cells. After incubation with LPS or dEL4 for 24 h, culture supernatant was collected for assay of NO, IFN‐β, and IFN‐γ production. NO was measured using Griess reagent according to the manufacturer’s protocol (Sigma). Levels of IFN‐β and IFN‐γ in culture supernatants were determined with an ELISA kit (R&D Systems).
Lactate dehydrogenase in vitro cytotoxicity assay and cell viability assay. Briefly, 1 × 10⁴ EL4 cells were cultured in a 96‐well plate in quadruplicate before treatment. EL4 cells were then cultured in the presence of IFN‐γ (PeproTech) for 6 or 24 h. The amount of lactate dehydrogenase (LDH) released into the culture supernatant was calculated by means of the LDH release assay (LDH‐cytotoxic test kit; Wako, Tokyo, Japan). Cell viability was determined using the WST assay (WST‐8 cell counting kit; Dojin Chemical, Kumamoto, Japan) according to the manufacturer’s protocol.
Statistical analysis. All results are expressed as means ± SD. Mann–Whitney’s U‐test was used for two‐group comparisons. A value of P < 0.05 was considered statistically significant.
Results
Tumor growth in WT and SR‐A−/− mice. To investigate the function of SR‐A in TAM, WT and SR‐A−/− mice received s.c. injections of EL4 lymphoma cells, and tumor growth was measured. As Figure 1(A) shows, growth of EL4 tumor was significantly delayed in SR‐A−/− mice compared with that in WT mice. Histological examination of tumor tissues (at day 14) revealed a decreased number of mitotic figures in tumors from SR‐A−/− mice compared with that in WT mice (Fig. 1B). The number of mitotic cells was significantly lower in SR‐A−/− mice than in WT mice (Fig. 1C). In addition, the percentage of PCNA‐positive tumor cells was significantly lower in sections from SR‐A−/− mice compared with sections from WT mice (Fig. 1D). These observations thus indicated that growth of tumor cells was impaired in SR‐A−/− mice. In vitro study revealed that the proliferation of EL4 cells was inhibited by coculture with SR‐A−/− macrophages (Fig. 1E), and this data suggested the involvement of TAM in tumor cell proliferation.
Figure 1.

Function of SR‐A in EL4 lymphoma. (A) Inhibition of EL4 lymphoma growth in SR‐A−/− mice (n = 7 for each group). *P < 0.05. (B) H&E staining of paraffin‐embedded tumor tissues. Arrows indicate irregular mitotic figures of transplanted EL4 cells. Scale bar = 50 μm. (C) Mitosis counts for histological sections of EL4 tumor from WT and SR‐A−/− mice (n = 7 for each group). (D) The percentage of proliferating cell nuclear antigen (PCNA)‐positive cells in tumor tissues from WT and SR‐A−/− mice (n = 7 for each group). (E) Proliferation assay of EL4 cells cocultured with bone marrow‐derived macrophages from WT and SR‐A−/− mice.
Inflammatory cell infiltration and angiogenesis in tumor tissues from WT and SR‐A−/− mice. We next evaluated infiltrating macrophages and angiogenesis to clarify the mechanism inhibiting tumor proliferation in SR‐A−/− mice. Our histological examinations showed no difference in the number of CD68+ TAM in WT mice (302 ± 72/mm2) and SR‐A−/− mice (310 ± 59/mm2) (Fig. 2A). There was no difference in the number of NK cells in WT mice (185 ± 45/mm2) and SR‐A−/− mice (189 ± 36/mm2). Assessment of angiogenesis by immunostaining with CD31 also indicated no significant differences in the density of CD31+ microvessels (data not shown). Few CD8+ T cells had infiltrated tumor samples from both WT and SR‐A−/− mice (data not shown).
Figure 2.

Engulfment of apoptotic or necrotic cells by tumor‐associated macrophages (TAM). (A) CD68 immunostaining of tumor specimens from WT and SR‐A−/− mice. CD68‐positive cells engulfed fragmented nuclei. Scale bar = 25 μm. (B) Electron micrograph showing a tumor macrophage engulfing a necrotic cell (N) and red blood cells (R). The nucleus of the necrotic cell showed pyknosis and karyolysis. Asterisk (*) indicates the macrophage nucleus. Scale bar = 4 μm. (C) Double immunofluorescent study of CD68 (green) and ssDNA (red) in tumor sections from WT and SR‐A−/− mice. Scale bar = 100 μm.
Engulfment of apoptotic or necrotic cells by infiltrating macrophages. As shown in Figure 2(A), most TAM phagocytosed dead cells, and the proportion of TAM that engulfed dead cells was not different in WT and SR‐A−/− mice (89 ± 5.6 and 91 ± 5.0%, respectively). Transmission electron microscopy revealed that many dead cells phagocytosed by TAM were necrotic cells or red blood cells (Fig. 2B). Double staining with CD68 and ssDNA was carried out (Fig. 2C), and the number of double‐positive cells that were believed to be macrophages that phagocytosed apoptotic cells was counted. The proportion of TAM that engulfed apoptotic cells was not different in WT and SR‐A−/− mice (15 ± 2.7 and 14 ± 4.1%, respectively). These observations indicated that approximately 75% of TAM phagocytosed necrotic cells in vivo.
iNOS and NO production in macrophages in vivo and in vitro. Several studies previously demonstrated that SR‐A regulates the production of cytokines and molecules, such as TNF‐α and IL‐12, and iNOS.( 13 , 14 ) To verify higher expression of iNOS in tumors from SR‐A−/− mice, immunostaining of iNOS was carried out. Double staining revealed iNOS protein in CD68+ macrophages in tumors from SR‐A−/− mice but not tumors from WT mice (Fig. 3A). Expression of iNOS mRNA was significantly higher in tumor tissues from SR‐A−/− mice compared with those from WT mice (Fig. 3B). The suppression of tumor cell proliferation by SR‐A−/− macrophages in coculture experiments was partly abrogated by l‐NAME, an iNOS inhibitor (Fig. 3C).
Figure 3.
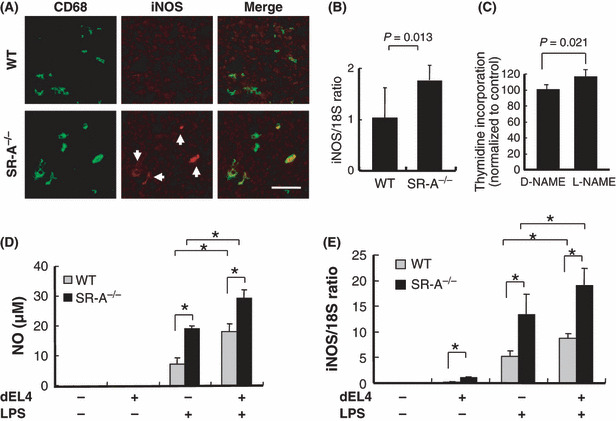
Nitric oxide (NO) and inducible NO synthase (iNOS) production in tumor‐associated macrophages (TAM). (A) Double immunofluorescent study of CD68 (green) and iNOS (red, arrows) in tumor sections from WT and SR‐A−/− mice. Scale bar = 50 μm. (B) Expression of iNOS mRNA in tumor tissues was calculated by means of real‐time PCR (n = 7 for each group). (C) Proliferation assay of EL4 cells cocultured with bone marrow‐derived macrophages from SR‐A−/− mice was carried out in the presence of iNOS inhibitor (N G‐Nitro‐l‐arginine methyl ester [l‐NAME], 10 μm). (D) NO production in cultured macrophages. After macrophages were cultured with dead EL4 (dEL4) cells and LPS for 24 h, NO production in the supernatant was evaluated via the Griess reaction. *P < 0.01 (n = 4 for each group). (E) After macrophages were cultured with dEL4 cells and LPS for 8 h, expression of iNOS mRNA was calculated by real‐time PCR (n = 4 for each group). *P < 0.01.
As shown in Figure 2, many macrophages in tumor tissues engulfed necrotic cells. We therefore hypothesized that engulfment of necrotic cancer cells may induce upregulation of iNOS and NO production and impair cancer cell proliferation in SR‐A−/− mice. To confirm this hypothesis, cultured macrophages were stimulated by LPS with or without dEL4 cells, and NO production was analyzed. As shown in Figure 3(D), engulfment of dEL4 cells induced upregulation of NO production. SR‐A−/− macrophages produced a higher amount of NO than did WT macrophages, independent of coculture with dEL4 cells (Fig. 3D). Similar results were obtained by real‐time PCR analysis of iNOS (Fig. 3E). Expression of iNOS mRNA in macrophages was elevated by engulfment of dEL4 cells even without LPS stimulation (Fig. 3E).
Quantitative real‐time PCR for expression of IFN‐γ, TNF‐α, IL‐10, IFN‐β, and IL‐12p40 in tumor tissues. To investigate which molecules produced by macrophages are involved in delayed growth of EL4 cells, we quantified IFN‐γ, IFN‐α, IL‐10, IFN‐β, and IL‐12p40 mRNA levels in tumor tissues from WT and SR‐A−/− mice. As Figure 4(A) shows, mRNA expression of IFN‐γ mRNA increased significantly in tumor tissues from SR‐A−/− mice compared with WT mice. Intratumor expression of IFN‐β (Fig. 4A), IL‐10 and IL‐12p40 (data not shown) mRNA was not significantly different in the two groups of mice. Because IFN‐γ mRNA expression was not detected in EL4 cells in vitro (Fig. 4B), these data indicated that TAM in EL4 lymphoma from SR‐A−/− mice produced iNOS and IFN‐γ and suggested that NO and IFN‐γ secreted by TAM impaired EL4 cell proliferation in vivo.
Figure 4.
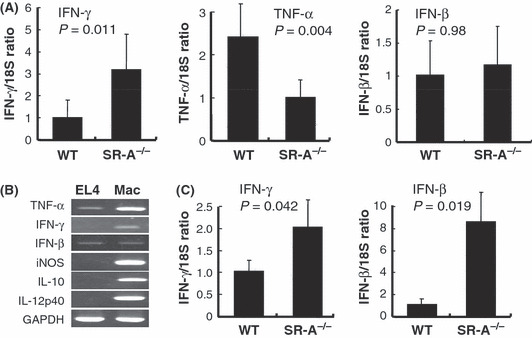
Cytokine expression in tumor tissues. (A) Quantitative real‐time RT‐PCR analysis for detection of interferon (IFN)‐β, IFN‐γ, and TNF‐α in EL4 tumors from WT and SR‐A−/− mice (n = 7 for each group). Relative values of these mRNA levels were normalized with respect to endogenous control 18S rRNA gene expression. (B) RT‐PCR results for TNF‐α, IFN‐γ, IFN‐β, iNOS, IL‐10, IL‐12p40, and GAPDH in cultured EL4 cells and macrophages stimulated with LPS. (C) EL4 cells were injected into the peritoneal cavity. Seven days later, tumor‐associated macrophages (TAM) were isolated from ascites by using F4/80 and secondary antibody‐coupled magnet beads. Quantitative real‐time RT‐PCR analysis for detection of IFN‐γ and IFN‐β and in purified TAM from ascites of WT and SR‐A−/− mice (n = 4 for each group).
The expression of TNF‐α mRNA increased significantly in tumor tissues from WT mice compared with those from SR‐A−/− mice (Fig. 4A). TNF‐α mRNA expression was detected in EL4 cells in vitro (Fig. 4B), so the higher expression of TNF‐α appeared to reflect higher activity of EL4 cells in WT mice. The mRNA expression of IFN‐β in tumor tissue was thought to be decreased in SR‐A−/− mice as well as that of TNF‐α; however, the mRNA expression was not different (Fig. 4A).
Next we purified TAM from intraperitoneal tumor models instead of subcutaneous tumors as the latter was too hard to be digested by collagenases. As Figure 4(C) shows, expression of IFN‐β and IFN‐γ mRNA increased significantly in TAM isolated from SR‐A−/− mice compared with WT mice.
IFN‐γ production in macrophages in vitro and inhibitory effect of IFN‐γ on EL4 cell proliferation. We also studied upregulation of IFN‐γ production by SR‐A−/− macrophages in vitro. SR‐A−/− macrophages with or without dEL4 stimulation had higher inducible IFN‐γ production compared with WT macrophages (Fig. 5A). Similar results were obtained by real‐time PCR (Fig. 5B).
Figure 5.
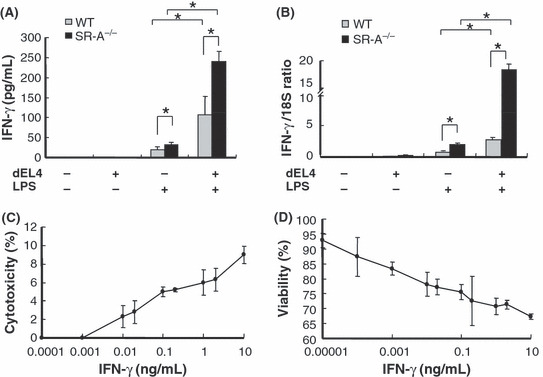
Interferon (IFN)‐γ secretion by macrophages and inhibitory effect of EL4 cells. (A) IFN‐γ production by cultured macrophages. After macrophages were cultured with dead EL4 (dEL4) cells and LPS for 24 h, IFN‐γ production in the supernatant was evaluated by ELISA (n = 4 for each group). *P < 0.05. (B) After macrophages were cultured with dEL4 cells and LPS for 8 h, expression of IFN‐γ mRNA was calculated by means of real‐time PCR. *P < 0.01. (C) EL4 cells were cultured with IFN‐γ for 6 h, and in vitro cytotoxicity was examined using the lactate dehydrogenase release assay. (D) EL4 cells were cultured with IFN‐γ for 24 h, and cell viability was evaluated using the WST assay.
IFN‐γ was previously shown to inhibit cancer cell proliferation and induce cancer cell apoptosis.( 22 , 23 ) We examined the antitumor effect of IFN‐γ on EL4 lymphoma in vitro. IFN‐γ was cytotoxic at concentrations as high as 10 pg/mL (Fig. 5C). In another experiment, EL4 cell growth showed dose‐dependent inhibition at IFN‐γ concentrations above 0.01 pg/mL (Fig. 5D). These observations were consistent with those of a previous report.( 24 )
IFN‐β production in macrophages in vivo and in vitro. Because Seimon et al. demonstrated that SR‐A inhibited the TLR4–IFN‐β signal,( 15 ) we expected that higher IFN‐β production would upregulate NO and IFN‐γ secretion in SR‐A−/− macrophages, and we compared IFN‐β production in WT and SR‐A−/− macrophages. As shown in Figure 6(A), LPS‐induced or dEL4‐induced IFN‐β production was significantly higher in SR‐A−/− macrophages than in WT macrophages. Similar results were obtained by real‐time PCR (Fig. 6B). However, intratumor expression of IFN‐β mRNA was not significantly different in WT and SR‐A−/− mice, and this discrepancy is likely due to IFN‐β expression by EL4 cells.
Figure 6.

Interferon (IFN)‐β production by macrophages in vitro and in vivo. (A) IFN‐β production by cultured macrophages. After macrophages were cultured with dead EL4 (dEL4) cells and LPS for 24 h, IFN‐β production in the supernatant was evaluated by ELISA (n = 4 for each group). *P < 0.01. (B) After macrophages were cultured with dEL4 cells and LPS for 8 h, expression of IFN‐β mRNA was calculated by real‐time PCR (n = 4 for each group). *P < 0.01.
Discussion
The results of our study indicated that growth of EL4 lymphoma was significantly delayed in SR‐A−/− mice and that increased production of NO and IFN‐γ may have induced suppression of tumor cell proliferation. Although elevated SR‐A expression in macrophages is reportedly induced by differentiation toward the anti‐inflammatory macrophage phenotype, the function of SR‐A in TAM has been less well studied. Here, we suggest that the inhibitory signal via SR‐A suppresses inflammatory responses of TAM and contributes to tumor progression.
In our previous study, SR‐A−/− mice were more sensitive to oxidative stress than were WT mice, and iNOS expression in macrophages was significantly higher in SR‐A−/− mice than in WT mice.( 13 ) In the present study, iNOS expression in macrophages was elevated in SR‐A−/− mice both in vitro and in vivo, observations that agreed with those of our previous study.
Many studies of the mechanisms of apoptotic cell uptake have been published, and many macrophage receptors including SR‐A are reportedly involved in apoptotic cell recognition and engulfment.( 21 , 25 ) Platt et al. demonstrated that thymic macrophages from SR‐A−/− mice showed a 50% reduction in phagocytosis of apoptotic thymocytes in vitro but not in vivo.( 26 , 27 ) Here, we investigated phagocytosis of apoptotic cells by cultured macrophages that were differentiated from bone marrow cells from SR‐A−/− mice. We found that the phagocytic activity of cultured macrophages from WT mice and SR‐A−/− mice did not differ significantly. The difference in macrophage cell type may have contributed to this inconsistency. In the present study, we generated macrophages from murine bone marrow precursors in the presence of GM‐CSF, because macrophages differentiated in the presence of M‐CSF produced culture supernatant with undetectable NO and IFN‐γ.
Phagocytosis of necrotic debris that contains high mobility group box 1 protein and heat shock protein 70 is well known to activate the p38 MAPK pathway and increase cytokine production.( 18 , 19 ) The effect of apoptotic cell clearance on production of iNOS, NO, or IFN‐γ has not previously been investigated, however. In the present study, we demonstrated that necrotic cells induced production of NO, IFN‐β, and IFN‐γ and that the SR‐A signal in macrophages inhibited production of these molecules. Endogenous IFN‐β expression accelerates NO production by LPS in macrophages.( 28 ) Because increased production of IFN‐β was observed in SR‐A−/− macrophages (Fig. 6), we believe that increased expression of iNOS and IFN‐γ in SR‐A−/− TAM is caused by activation of TLR4–IFN‐β signaling.
Heterogeneity of macrophages has been focused with regard to different responses to various cytokine stimuli. Macrophage activation in response to LPS and IFN is well known and called classical activation (M1 phenotype), whereas activation induced by anti‐inflammatory cytokines such as IL‐4 and IL‐10 is called alternative activation (M2 phenotype).( 2 , 3 , 29 ) TAM from SR‐A−/− mice produced higher expression of IFN‐β and IFN‐γ (Fig. 4) than that of WT mice, indicating their polarization toward the M1 phenotype. SR‐A expression increases in M2 macrophages and is considered to be one of the markers of M2 macrophages.( 30 ) The present data indicate that SR‐A itself may contribute to maintaining the character of the M2 phenotype.
Many studies have found that NO and IFN‐γ inhibit progression and metastasis of cancer cells.( 31 , 32 , 33 , 34 ) Activating macrophages have been shown to induce apoptosis in cancer cells in an NO‐dependent fashion.( 34 , 35 , 36 ) Ryoyama showed that the antitumor activity of macrophages induced with OK‐432 depended mainly on their ability to produce NO.( 37 ) Maekawa demonstrated an antitumor effect of recombinant IFN‐γ against EL4 lymphoma and B16 melanoma in vivo.( 24 ) They suggested that this antitumor activity was due to IFN‐γ‐activated effector cells such as NK cells and macrophages; however, they did not evaluate the direct effect of IFN‐γ against EL4 lymphoma cells. In our study, proliferation of EL4 lymphoma was inhibited at a very low dose of IFN‐γin vitro.
In conclusion, we found increased antitumor activity of macrophages in SR‐A−/− mice, which may be due to upregulation of NO and IFN‐γ production by macrophages. These data point to an important role of SR‐A in regulating the function of TAM by inhibiting TLR4 signaling. Selective blockade of SR‐A may therefore provide a promising approach to enhancing anticancer therapy.
Acknowledgments
We thank Mr Takenobu Nakagawa, Mr Osamu Nakamura, Ms Emi Kiyota, and Mr Junichi Yoshida for their technical assistance during the course of this work. This study was supported in part by Grants‐in‐Aid for Scientific Research (B20390113, 21790388) from the Ministry of Education, Culture, Sports, Science, and Technology of Japan.
References
- 1. Pollard JW. Tumour‐educated macrophages promote tumour progression and metastasis. Nat Rev Cancer 2004; 4: 71–8. [DOI] [PubMed] [Google Scholar]
- 2. Mantovani A, Sozzani S, Locati M, Allavena P, Sica A. Macrophage polarization: tumor‐associated macrophages as a paradigm for polarized M2 mononuclear phagocytes. Trends Immunol 2002; 23: 549–55. [DOI] [PubMed] [Google Scholar]
- 3. Gordon S. Alternative activation of macrophages. Nat Rev Immunol 2003; 3: 23–35. [DOI] [PubMed] [Google Scholar]
- 4. Mosser DM. The many faces of macrophage activation. J Leukoc Biol 2003; 73: 209–12. [DOI] [PubMed] [Google Scholar]
- 5. Mantovani A, Sica A, Sozzani S, Allavena P, Vecchi A, Locati M. The chemokine system in diverse forms of macrophage activation and polarization. Trends Immunol 2004; 25: 677–86. [DOI] [PubMed] [Google Scholar]
- 6. Platt N, Gordon S. Is the class A macrophage scavenger receptor (SR‐A) multifunctional? The mouse’s tale. J Clin Invest 2001; 108: 649–54. [DOI] [PMC free article] [PubMed] [Google Scholar]
- 7. Suzuki H, Kurihara Y, Takeya M et al. A role for macrophage scavenger receptors in atherosclerosis and susceptibility to infection. Nature 1997; 386: 292–6. [DOI] [PubMed] [Google Scholar]
- 8. Matsumoto A, Naito M, Itakura H et al. Human macrophage scavenger receptors: primary structure, expression, and localization in atherosclerotic lesions. Proc Natl Acad Sci USA 1990; 87: 9133–7. [DOI] [PMC free article] [PubMed] [Google Scholar]
- 9. Yang G, Addai J, Tian WH, Frolov A, Wheeler TM, Thompson TC. Reduced infiltration of class A scavenger receptor positive antigen‐presenting cells is associated with prostate cancer progression. Cancer Res 2004; 64: 2076–82. [DOI] [PubMed] [Google Scholar]
- 10. Hagemann T, Wilson J, Burke F et al. Ovarian cancer cells polarize macrophages toward a tumor‐associated phenotype. J Immunol 2006; 176: 5023–32. [DOI] [PubMed] [Google Scholar]
- 11. Komohara Y, Ohnishi K, Kuratsu J, Takeya M. Possible involvement of the M2 anti‐inflammatory macrophage phenotype in growth of human gliomas. J Pathol 2008; 216: 15–24. [DOI] [PubMed] [Google Scholar]
- 12. Haworth R, Platt N, Keshav S et al. The macrophage scavenger receptor type A is expressed by activated macrophages and protects the host against lethal endotoxic shock. J Exp Med 1997; 186: 1431–9. [DOI] [PMC free article] [PubMed] [Google Scholar]
- 13. Kobayashi H, Sakashita N, Okuma T et al. Class A scavenger receptor (CD204) attenuates hyperoxia‐induced lung injury by reducing oxidative stress. J Pathol 2007; 212: 38–46. [DOI] [PubMed] [Google Scholar]
- 14. Tsujita K, Kaikita K, Hayasaki T et al. Targeted deletion of class A macrophage scavenger receptor increases the risk of cardiac rupture after experimental myocardial infarction. Circulation 2007; 115: 1904–11. [DOI] [PubMed] [Google Scholar]
- 15. Seimon TA, Obstfeld A, Moore KJ, Golenbock DT, Tabas I. Combinatorial pattern recognition receptor signaling alters the balance of life and death in macrophages. Proc Natl Acad Sci USA 2006; 103: 19794–9. [DOI] [PMC free article] [PubMed] [Google Scholar]
- 16. Campana L, Bosurgi L, Rovere‐Querini P. HMGB1: a two‐headed signal regulating tumor progression and immunity. Curr Opin Immunol 2008; 20: 518–23. [DOI] [PubMed] [Google Scholar]
- 17. Apetoh L, Tesniere A, Ghiringhelli F, Kroemer G, Zitvogel L. Molecular interactions between dying tumor cells and the innate immune system determine the efficacy of conventional anticancer therapies. Cancer Res 2008; 68: 4026–30. [DOI] [PubMed] [Google Scholar]
- 18. Youn JH, Oh YJ, Kim ES, Choi JE, Shin JS. High mobility group box 1 protein binding to lipopolysaccharide facilitates transfer of lipopolysaccharide to CD14 and enhances lipopolysaccharide‐mediated TNF‐alpha production in human monocytes. J Immunol 2008; 180: 5067–74. [DOI] [PubMed] [Google Scholar]
- 19. Karin M, Lawrence T, Nizet V. Innate immunity gone awry: linking microbial infections to chronic inflammation and cancer. Cell 2006; 124: 823–35. [DOI] [PubMed] [Google Scholar]
- 20. Kamada N, Kodama T, Suzuki H. Macrophage scavenger receptor (SR‐A I/II) deficiency reduced diet‐induced atherosclerosis in C57BL/6J mice. J Atheroscler Thromb 2001; 8: 1–6. [DOI] [PubMed] [Google Scholar]
- 21. Komohara Y, Terasaki Y, Kaikita K, Suzuki H, Kodama T, Takeya M. Clearance of apoptotic cells is not impaired in mouse embryos deficient in class A scavenger receptor types I and II (CD204). Dev Dyn 2005; 232: 67–74. [DOI] [PubMed] [Google Scholar]
- 22. Bonnem EM, Oldham RK. Gamma‐interferon: physiology and speculation on its role in medicine. J Biol Response Mod 1987; 6: 275–301. [PubMed] [Google Scholar]
- 23. Kirkwood JM, Ernstoff MS. Interferons in the treatment of human cancer. J Clin Oncol 1984; 2: 336–52. [DOI] [PubMed] [Google Scholar]
- 24. Maekawa R, Kitagawa T, Hojo K, Wada T, Sato K. Distinct antitumor mechanisms of recombinant murine interferon‐gamma against two murine tumor models. J Interferon Res 1988; 8: 227–39. [DOI] [PubMed] [Google Scholar]
- 25. Platt N, Da Silva RP, Gordon S. Class A scavenger receptors and the phagocytosis of apoptotic cells. Immunol Lett 1999; 65: 15–9. [DOI] [PubMed] [Google Scholar]
- 26. Platt N, Suzuki H, Kurihara Y, Kodama T, Gordon S. Role for the class A macrophage scavenger receptor in the phagocytosis of apoptotic thymocytes in vitro . Proc Natl Acad Sci USA 1996; 93: 12456–60. [DOI] [PMC free article] [PubMed] [Google Scholar]
- 27. Platt N, Suzuki H, Kodama T, Gordon S. Apoptotic thymocyte clearance in scavenger receptor class A‐deficient mice is apparently normal. J Immunol 2000; 164: 4861–7. [DOI] [PubMed] [Google Scholar]
- 28. Jacobs AT, Ignarro LJ. Lipopolysaccharide‐induced expression of interferon‐beta mediates the timing of inducible nitric‐oxide synthase induction in RAW 264.7 macrophages. J Biol Chem 2001; 276: 47950–7. [DOI] [PubMed] [Google Scholar]
- 29. Komohara Y, Hirahara J, Horikawa T et al. AM‐3K, an anti‐macrophage antibody, recognizes CD163, a molecule associated with an anti‐inflammatory macrophage phenotype. J Histochem Cytochem 2006; 54: 763–71. [DOI] [PubMed] [Google Scholar]
- 30. Martinez FO, Gordon S, Locati M, Mantovani A. Transcriptional profiling of the human monocyte‐to‐macrophage differentiation and polarization: new molecules and patterns of gene expression. J Immunol 2006; 177: 7303–11. [DOI] [PubMed] [Google Scholar]
- 31. Gresser I. Antitumor effects of interferon. Acta Oncol 1989; 28: 347–53. [DOI] [PubMed] [Google Scholar]
- 32. Xie K, Dong Z, Fidler IJ. Activation of nitric oxide synthase gene for inhibition of cancer metastasis. J Leukoc Biol 1996; 59: 797–803. [DOI] [PubMed] [Google Scholar]
- 33. Thomsen LL, Miles DW. Role of nitric oxide in tumour progression: lessons from human tumours. Cancer Metastasis Rev 1998; 17: 107–18. [DOI] [PubMed] [Google Scholar]
- 34. Cui S, Reichner JS, Mateo RB, Albina JE. Activated murine macrophages induce apoptosis in tumor cells through nitric oxide‐dependent or ‐independent mechanisms. Cancer Res 1994; 54: 2462–7. [PubMed] [Google Scholar]
- 35. Martin JH, Edwards SW. Changes in mechanisms of monocyte/macrophage‐mediated cytotoxicity during culture. Reactive oxygen intermediates are involved in monocyte‐mediated cytotoxicity, whereas reactive nitrogen intermediates are employed by macrophages in tumor cell killing. J Immunol 1993; 150: 3478–86. [PubMed] [Google Scholar]
- 36. Hagemann T, Lawrence T, McNeish I et al. “Re‐educating” tumor‐associated macrophages by targeting NF‐kappaB. J Exp Med 2008; 205: 1261–8. [DOI] [PMC free article] [PubMed] [Google Scholar]
- 37. Ryoyama K. Effector molecules from antitumor macrophages induced with OK‐432 and cyclophosphamide. Cancer Immunol Immunother 1992; 35: 7–13. [DOI] [PMC free article] [PubMed] [Google Scholar]