

Abstract
The Src tyrosine kinase associates with the focal adhesion adaptor protein Cas (Crk‐associated substrate) to suppress the expression of potential tumor suppressor genes. For example, Src utilizes Cas to suppress the expression of the LIM‐only protein Fhl1 (four and a half LIM domains 1), in order to promote non‐anchored tumor‐cell growth and migration. Here, we report that the promoter region of the Fhl1 gene was methylated more in Src‐transformed cells than non‐transformed cells. In addition, global expression analysis indicates that Fhl1 induced expression of serum deprivation response factor (Sdpr) in Src‐transformed cells. Moreover, Fhl1 and Sdpr was expressed in approximately 87% and 40% of samples obtained from non‐transformed breast, 100% of samples obtained from non‐transformed kidney, and over 60% of samples obtained from non‐transformed prostate. In contrast, Fhl1 and Sdpr was detected in approximately 40% and 7% of matched samples from mammary carcinoma, less than 11% of matched samples from kidney carcinoma, and in less than 22% of matched samples from prostate carcinoma. These data indicate that Fhl1 and Sdpr expression was significantly reduced in tumors of the breast (P < 0.02 and P < 0.001), kidney (P < 0.01), and prostate (P < 0.05). In addition, although Src can activate mitogen‐activated protein kinase (MAPK) to promote tumor‐cell growth, our data indicate that Src did not rely on MAPK activity to suppress the expression of Fhl1 and Sdpr in transformed cells. Thus, Src induced methylation of the promoter region of the Fhl1 gene; Src suppressed Fhl1 and Sdpr expression independent of mitogen‐activated protein kinase (MAPK) activity; Fhl1 induced the expression of Sdpr in Src‐transformed cells; and Fhl1 and Sdpr expression was suppressed in tumors of the breast, kidney, and prostate. (Cancer Sci 2008; 99: 1326–1333)
Src is a membrane‐bound tyrosine kinase( 1 ) that has been implicated in the progression of many human cancers( 2 , 3 ) including tumors of the breast,( 4 , 5 , 6 ) kidney,( 7 ) and prostate.( 8 ) The Src kinase phosphorylates Cas (Crk‐associated substrate) and activates mitogen‐activated protein kinase (MAPK) to promote anchorage‐independent growth and migration.( 9 , 10 , 11 , 12 , 13 , 14 , 15 , 16 ) These fundamental hallmarks of tumor‐cell growth are required for metastasis and distinguish most cancer cells from their non‐transformed precursors.( 17 , 18 )
We have recently found that Src utilizes Cas to inhibit Fhl1 (four and a half LIM domains 1) expression, in order to promote non‐anchored cell growth and migration.( 19 ) Transfection studies show that Fhl1 specifically blocks non‐anchored tumor‐cell growth and migration, but does not affect ‘normal’ anchored cell growth. Therefore, Fhl1 acts as a true tumor suppressor rather than as a general mitotic inhibitor.( 19 )
As the name indicates, Fhl1 consists of ‘four and a half LIM domains’. Fhl1 can move between intercellular junctions,( 20 ) focal adhesions, and the nucleus( 21 ) to affect gene expression.( 22 , 23 ) For example, Fhl1 associates with the recombination signal binding protein for immunoglobulin kappa J region (RBP‐J)–DNA binding protein to modulate gene transcription.( 22 , 23 )
Analysis of human clinical specimens suggest that Fhl1 expression is suppressed in some human tumors, including those of the breast, kidney, and prostate.( 19 ) As described above, Fhl1 acts downstream of Src and Cas to suppress metastatic cell growth. In this report, we utilized a non‐biased and global analysis to identify genes that are modulated by Fhl1 downstream of Src and Cas in tumor cells.
We report here that Src inhibits Fhl1 and Sdpr expression independent of MAPK activity, and that Fhl1 induces the expression of Sdpr (serum deprivation response factor) in Src‐transformed cells. Moreover, we show here that Sdpr and Fhl1 are down regulated in tumors of the breast, kidney, and prostate. Sdpr is a phosphatidylserine‐binding protein( 24 ) that is induced during growth arrest by serum deprivation of non‐transformed cells, but not transformed cells.( 25 ) Data presented here suggest that Fhl1 and Sdpr are novel tumor markers that may be used as diagnostic and prognostic indicators for tumor cells that utilize Src kinase activity for metastatic growth.
Materials and Methods
Immunohistochemistry. Slides containing 15 infiltrating duct carcinoma specimens with normal adjacent tissue from breast cancer patients (IMH‐371, Imgenex), nine prostate adenocarcinoma specimens with adjacent normal tissue and an additional unmatched 41 prostate adenocarcinoma specimens (IMH‐303, Imgenex), and nine renal cell carcinoma specimens with adjacent normal tissue and an additional unmatched 31 cell carcinoma specimens (IMH‐313, Imgenex) were examined by immunohistochemistry as previously described.( 19 ) Briefly, after removal of paraffin with xylene and rehydration through a graded series of decreasing concentrations of ethanol, protein antigenicity was enhanced by microwaving sections in Target Buffer (Dako, Carpenturia, CA, USA) for 2 min. Sections were treated for 30 min in immunohistochemistry (IHC) blocking buffer (4% bovine serum albumen [BSA] and 0.1% Tween 20 in phosphate buffered saline [PBS]). Affinity‐purified (Pierce MicroLink Peptide Coupling Kit, Cat No: 20485) rabbit antiserum targeted against Fhl1 (Proteintech Group, S1009) or Sdpr (Proteintech Group, 90124) was applied to the sections and incubated at 4°C overnight in IHC blocking buffer. Following a thorough rinse in buffer, a secondary biotin‐labeled antibody was applied for 30 min. Immunoreactions were treated with an avidin–peroxidase‐labeled‐biotin complex (ABC, Vector Laboratories, Foster City, CA, USA) and visualized by treatment of sections with 3‐3‐diaminobenzidine‐4 HCl (DAB)/H2O2 (Biomeda, Foster City, CA, USA). Sections were lightly counterstained with hematoxylin, dehydrated through a graded series of increasing concentrations of ethanol, cleared in xylene and mounted in Permount. Specimens were examined with a Nikon FXA microscope and recorded with a Nikon Digital Camera DXM1200F. Samples were scored for presence or absence of Fhl1 expression, as well as intensity rated on scale from 0 to 4. Statistical significance was determined by P‐value derived by McNemar's χ2 paired for presence and the t‐test for matched samples for intensity.
Cell culture. Non‐transformed and Src‐transformed mouse embryonic brain cells, Src‐transformed cells transfected with full‐length Fhl1 or the empty parental vector, and Src‐transformed homozygous null Cas knockout cells transfected with Cas or the parental vector have been previously described.( 16 , 19 , 26 , 27 ) Central Dogma‐tagged NIH 3T3 cells with an enhanced green fluorescence protein (EGFP)‐encoding guest exon in an intron of the Sdpr gene, and expressing an Sdpr protein with a GFP insert positioned between amino acids 161 and 162 of the native protein, were isolated as previously described.( 28 ) These cells were then transfected with v‐Src, oncogenic MEK (phosphomimetic active mitogen‐activated protein kinase kinase 1 [MAPKK1] with Ser217 and Ser221 mutated to glutamic acid [Glu]), or the empty parental vector (pBabePuro) as previously described.( 9 , 16 , 19 , 29 ) Clones were not taken from any cell lines, thus avoiding potential effects of clonal variation.
Cells were analyzed for anchored growth, non‐anchored growth, and migration as previously described.( 19 , 26 ) Twenty thousand cells were plated in each well of tissue‐culture‐treated 12‐well cluster plates (Falcon, 3043) to determine anchored growth or in ultra‐low‐attachment 24‐well cluster plates (Corning, 3473) to determine non‐anchored growth. Cells were counted by Coulter counter at the indicated time points. Microscopic analysis was performed with a Carl Zeiss Axiovert 200 Pascal UGB confocal microscope equipped with a Plan–Apochromat 63× objective and argon (ex: 488 nm) laser with a (BP: 420–530) band pass filter to observed GFP fluorescence. For some experiments, 400 000 cells were plated in each well of 6‐well cluster plates (Falcon, 353046) with or without the MEK blocker PD98059 (Calbiochem, 513000) and grown for 24 h before harvesting.
Analysis of gene expression. Gene expression in anchored non‐transformed and Src‐transformed mouse embryonic brain cells, as well as anchored and non‐anchored Src‐transformed cells transfected with Fhl1 or the parental vector were examined by microarray analysis with 430 2.0 Mouse Expression Array gene chips (Affymetrix). Anchored and non‐anchored Src‐transformed homozygous null Cas knockout cells transfected with Cas or the parental vector were examined with 430 A Mouse Expression Array gene chips (Affymetrix). Cell culture, RNA extraction, and microarray analysis of gene expression was performed as previously described.( 19 , 27 ) All comparisons were carried out with cells from parallel cultures to control for variability in reagents or experimental conditions. Duplicate independent experiments were performed in all cases (n = 2). Expression analysis was performed with Vector Xpression software 4.0 (Invitrogen). Probe sets representing genes with significantly different expression profiles were selected by mean fold change of two or more that passed the t‐test (P < 0.05).
Probe sets representing genes induced by Fhl1 were identified as having a mean 2‐fold increase in anchored and non‐anchored Fhl1‐transfected Src‐transformed cells compared with control transfectants. Probe sets representing genes suppressed by Fhl1 were selected by inverse criteria.
Probe sets representing genes induced by Src were identified as having a mean 2‐fold increase in Src‐transformed cells compared with non‐transformed cells. Probe sets representing genes suppressed by Src were selected by inverse criteria.
Probe sets representing genes induced by Cas were identified as having a mean 2‐fold increase in anchored or non‐anchored Src‐transformed cells that expressed Cas compared with those that did not express Cas. Probe sets representing genes suppressed by Cas were selected by inverse criteria.
Immunoprecipitation and Western blot analysis. Immunoprecipitation and Western blot analysis were performed as previously described.( 16 , 19 , 27 ) Rabbit antiserum targeted against the peptides N‐CRDPLQGKKYVQKDGRH‐C or N‐QVKRLENNHAQLLRRNHFK‐C was used to detect Fhl1 (Proteintech Group, S1009) or Sdpr (Proteintech Group, 90124), respectively. Rabbit antiserum was used to detect GFP (Abcam, ab290), MAPK (Cell Signal Technologies, 9102), and active Src kinase (Cell Signal Technologies, 2101). Mouse monoclonal antiserum was used to detect viral Src (Upstate Biotech, 05‐185), active phosphorylated MAPK (Cell Signal Technologies, 9106), and β‐actin (Sigma, A1978).
Analysis of methylated DNA. DNA was purified from non‐transformed and Src‐transformed mouse embryonic brain cells (Qiagen DNeasy Tissue kit, Qiagen #69504) and modified with sodium metabisulfite as described.( 30 ) Briefly, 4 µg of DNA was denatured in 0.3 M NaOH at 37°C for 15 min, incubated with bisulfate modification reagent (2 M Na2S2O5, 10 mM hydroquinone, pH 5.0) at 50°C for 4 h, precipitated with three volumes of ethanol for 10 min at 10 000 g at room temperature, dried, and suspended in 20 µL Tris‐EDTA buffer. PCR was performed with 1 µL of sulfonated DNA (95°C for 5 min, 95°C for 30 s, 50°C for 2 min, and 72°C for 2 min for 30 cycles, followed by 72°C for 5 min) with the forward primer 5′‐TTGGTTGTTTTTTTTTGTTGTT‐3′ and reverse primer 5′‐TTAAAACCCCAAATTCCTCA‐3′. Nested PCR was then performed with 1 µL of the first PCR product (95°C for 5 min, 95°C for 30 s, 55°C for 30 s, and 72°C for 1 min for 30 cycles, followed by 72°C for 5 min) with the forward primer 5′‐GTTTGTAGGGGGTGTTT‐3′ and reverse primer 5′‐CACAAAACTAAACCCCCTC‐3′ or forward primer 5′‐GGGGGTTTAGTTTTGTGTT‐3′ and reverse primer 5′‐ACCCAAACCCAACAAATC‐3′. The PCR products were subcloned into pGEM‐T (pGEM‐T Easy Vector System, Promega #A1360) and sequenced with a T7 promoter sequencing primer on an ABI PRISM 3130xl Genetic Analyzer.
Results
Suppression of Fhl1 expression in tumors of the breast, prostate, and kidney. We have recently reported that Src suppresses Fhl1 expression to promote non‐anchored tumor‐cell growth and migration. Data from these investigations also suggested that Fhl1 is suppressed in a variety of different human tumors.( 19 ) Here, we have further investigated this by comparing Fhl1 expression in tumor samples and adjacent non‐transformed tissue from human breast, prostate, and kidney epithelium.
As shown in Figure 1, more Fhl1 protein was detected in non‐transformed breast, prostate, and kidney epithelium than in infiltrating mammary duct carcinoma, prostate adenocarcinoma, and renal cell carcinoma, respectively. Results from all tissues examined are shown in Table 1. These data reveal that Fhl1 was expressed in approximately 87% of samples obtained from non‐transformed breast, 100% of samples obtained from non‐transformed kidney, and 67% of samples obtained from non‐transformed prostate. In contrast, Fhl1 was detected in approximately 40% of matched samples from mammary carcinoma, none of the matched samples from kidney carcinoma, and in approximately 22% of matched samples from prostate carcinoma. These data indicate that Fhl1 expression was suppressed in tumors of the breast, kidney, and prostate. These differences were significant, with P‐values between 0.05 and 0.01. It should be also noted that Fhl1 expression was detected in only four out of 50 samples from non‐matched kidney tumors and four out of 40 non‐matched prostate tumors that were also analyzed.
Figure 1.
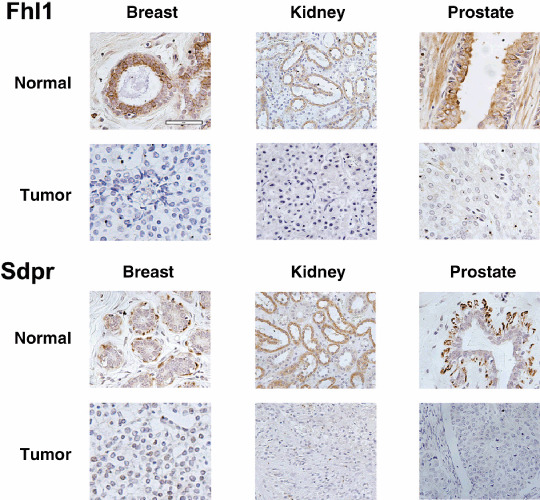
Fhl1 and Sdpr expression in normal epithelium and tumors from human breast, kidney, and prostate. Immunohistochemical staining was performed on normal and tumor human tissue. Fhl1 and Sdpr staining was evident in normal epithelial cells of the breast, kidney, and prostate. In contrast, both Fhl1 and Sdpr expression were suppressed in infiltrating mammary duct carcinoma, renal cell carcinoma, and prostate adenocarcinoma. (bar = 60 microns).
Table 1.
Fhl1 and Sdpr expression in human breast, kidney, and prostate tumors
| Fhl1 | n | Presence | Intensity | ||||
|---|---|---|---|---|---|---|---|
| Normal | Carcinoma | P‐value | Normal | Carcinoma | P‐value | ||
| Breast | 15 | 13 | 6 | 0.02 | 1.37 ± 0.24 | 0.27 ± 0.1 | 0.0001 |
| Kidney | 9 | 9 | 0 | 0.01 | 1.28 ± 0.21 | 0 ± 0 | 0.001 |
| Prostate | 9 | 6 | 2 | 0.05 | 0.56 ± 0.15 | 0.28 ± 0.22 | 0.01 |
| Sdpr | n | Presence | Intensity | ||||
| Normal | Carcinoma | P‐value | Normal | Carcinoma | P‐value | ||
| Breast | 15 | 6 | 1 | 0.001 | 1.6 ± 0.27 | 0.07 ± 0.07 | 0.0001 |
| Kidney | 9 | 9 | 1 | 0.01 | 2.89 ± 0.2 | 0.22 ± 0.22 | 0.0001 |
| Prostate | 9 | 5 | 1 | 0.05 | 0.5 ± 0.17 | 0.11 ± 0.11 | 0.03 |
Samples of carcinoma and matched normal adjacent tissue were obtained from cancer patients and examined by immunohistochemistry with affinity purified peptide antibody against Fhl1. Samples were scored for presence or absence of Fhl1 expression, as well as intensity rated on scale from 0 to 4. ‘Presence’ is shown as the number of positive samples. ‘Intensity’ is shown as the mean ± SEM of examined samples. Significance was determined by P‐value derived by McNemar's χ2 paired for presence and the t‐test for matched samples for intensity. (n = number of samples analyzed).
Mean intensity values of Fhl1 expression were also lower in tumor cells that expressed Fhl1 compared with non‐transformed cells. As shown in Table 1, non‐transformed breast, kidney, and prostate epithelium displayed Fhl1 expression intensities of approximately 1.4, 1.3, and 0.6, respectively. Samples from breast, kidney, and prostate tumors expressed lower expression intensities of approximately 0.3, 0, and 0.3, respectively. These differences were significant, with P‐values between 0.01 and 0.0001.
Induction of Sdpr expression by Fhl1 in Src transformed cells. Data shown in Figure 1 and Table 1 indicate that Fhl1 expression was severely suppressed in tumors of the breast, kidney, and prostate. We utilized Affymetrix microarrays to find other genes that may be coordinately regulated in these types of tumors. Fhl1 was found to be a tumor suppressor in Src‐transformed cells.( 19 ) Therefore, global expression analysis was compared between Src‐transformed mouse embryonic brain cells transfected with Fhl1 or the empty parental control vector. Approximately 45 000 probe sets were examined. These represented over 39 000 transcripts. The expression of genes represented by 648 probe sets significantly differed between the Fhl1 and control transfectants by 2‐fold or more (P < 0.05 t‐test). As summarized in Figure 2(a), genes represented by 459 probe sets were induced by Fhl1, whereas genes represented by 189 probe sets were suppressed by Fhl1.
Figure 2.
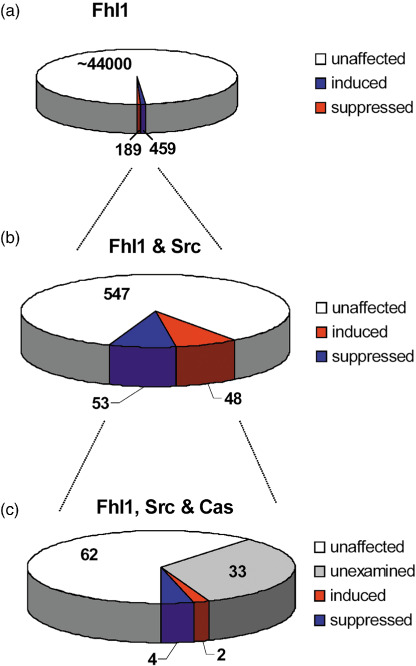
Selection of genes affected by Fhl1. Microarray analysis was performed to identify probe sets representing genes with mean fold change differences of 2 or more with P < 0.05 by t‐test. (a) Fhl1 transfected Src transformed cells were compared with control transfectants. Of approximately 45 000 probe sets examined, genes represented by 459 were induced by Fhl1, whereas genes represented by 189 were suppressed. (b) Non‐transformed cells were compared with Src transformed cells to identify genes affected by Fhl1 that were correspondingly regulated by Src. Genes represented by 53 probe sets were induced by Fhl1 and suppressed by Src, whereas 48 were suppressed by Fhl1 and induced by Src. (c) Src‐transformed homozygous null Cas knockout cells transfected with Cas were compared with control transfectants to identify genes correspondingly regulated by Fhl1, Scr, and Cas. Genes represented by four probe sets were induced by Fhl1 and suppressed by Src and Cas, whereas genes represented by two probe sets were suppressed by Fhl1 and induced by Src and Cas.
Genes affected by Fhl1 were further filtered to identify those that were also significantly affected by Src transformation. Genes represented by 101 of these probe sets were correspondingly regulated by Src. As summarized in Figure 2(b), the expression of transcripts represented by 53 probe sets were induced by Fhl1 and suppressed by Src, whereas 48 were suppressed by Fhl1 and induced by Src.
We have previously found that Src utilizes Cas to suppress Fhl1 expression to promote non‐anchored cell growth and migration of Src‐transformed cells.( 19 ) Thus, genes affected by Fhl1 that control the growth of Src‐transformed cells should also be affected by Cas expression. We compared the expression of genes in Src‐transformed cells that expressed Cas with cells that did not express Cas to identify genes coordinately regulated by Fhl1, Src, and Cas. Approximately 22 000 probe sets were examined, representing over 14 000 annotated genes. Thirty‐three of the 101 probe sets consistently regulated by Fhl1 and Src represented non‐annotated expression sequence tags (ESTs) that were not present on this microarray. Of the remaining 68 probe sets, six were correspondingly regulated by Cas. As illustrated in Figure 2(c), transcripts represented by four of these probe sets were suppressed by Cas, whereas transcripts represented by two probe sets were induced.
As shown in Table 2, Fhl1, Sdpr, and Phf17 were induced by Fhl1 transfection and suppressed by the combined action of Src and Cas. Conversely, the expression of Rgs17 and Cish3 were suppressed by Fhl1 and induced by Src and Cas. Selection of Fhl1 was to be expected from our filtration strategy initiated by examination of Fhl1‐transfected cells. Fhl1 significantly affected the expression of Sdpr by approximately 17 fold. This filtration strategy was used to determine the most biologically meaningful genes that were regulated by Fhl1. Interestingly, like Fhl1, Sdpr expression was also induced during contact normalization of Src‐transformed cells by neighboring non‐transformed cells.( 27 )
Table 2.
Genes regulated by Fhl1
| Probe set | Symbol | Increased by Fhl11 | Decreased by Src2 anchored | Decreased by Cas3 | Name | ||
|---|---|---|---|---|---|---|---|
| Anchored | Non‐anchored | Anchored | Non‐anchored | ||||
| 1417872_at | Fhl1 | 23.91 | 13.73 | –21.26 | –10.23 | –1.49 | Four and a half LIM domains |
| 1416779_at | Sdpr | 17.05 | 19.67 | –33.16 | –1.35 | –2.12 | Derum deprivation response factor |
| 1416778_at | 11.21 | 8.46 | –30.42 | –1.35 | –2.31 | ||
| 1426752_at | Phf17 | 2.33 | 2.18 | –3.24 | –1.89 | –2.28 | PHD finger protein 17 |
| Probe set | Symbol | Decreased by Fhl11 | Increased by Src2 anchored | Increased by Cas3 | Name | ||
| Anchored | Non‐anchored | Anchored | Non‐anchored | ||||
| 1450693_at | Rgs17 | –2.49 | –2.46 | 17.04 | 3.63 | 1.17 | Regulator of G‐protein signaling 17 |
| 1449109_at | Cish3 | –2.06 | –2.29 | 10.94 | 2.91 | 1.19 | Cytokine inducible SH2‐containing protein 2 |
Fold changes are shown for genes differentially expressed 2 fold or more in Src‐transformed cells transfected with Fhl1 compared with control transfectants, Src‐transformed cells compared with non‐transformed cells, or Src‐transformed cells deficient for Cas or expressing Cas as indicated by superscripts 1, 2, or 3, respectively. PHD, plant homeo domain.
Suppression of Sdpr protein expression in Src‐transformed cells but not MEK‐transformed cells. Central Dogma (CD)‐tagging was used to obtain an NIH 3T3 cell line expressing an EGFP–Sdpr fusion protein from the native gene.( 28 ) These cells were transfected with v‐Src, oncogenic MEK, or the empty parental vector( 9 ) to investigate the effects of Src and MAPK on Sdpr protein expression. As shown in Figure 3(a,b), Src and MEK activity decreased contact‐growth inhibition of these cells as reflected by an increase in cell saturation density. Ttransformed cells grew to a confluence of over 8000 cells per mm2, whereas control transfectants achieved a confluence of less than 6000 cells per mm2. More importantly, only the transformed cells were capable of anchorage‐independent growth.
Figure 3.
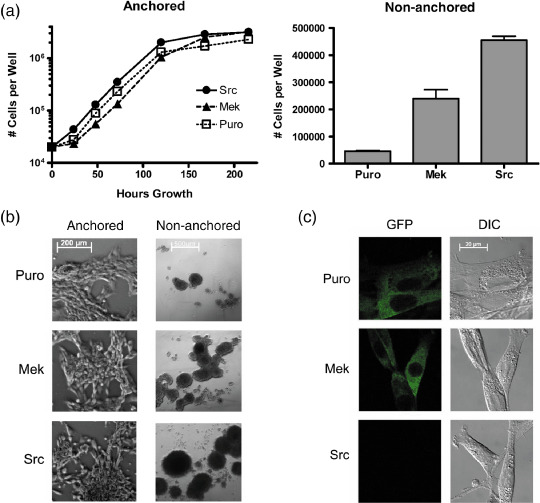
Sdpr protein expression in non‐transformed, mitogen‐activated protein kinase (MEK)‐transformed, and Src‐transformed cells. The genomic Sdpr gene in NIH 3T3 cells was tagged with green fluorescence protein (GFP) to produce an endogenously regulated fusion protein. These cells were then transfected with v‐Src, oncogenic MEK, or the empty parental expression vector (Puro) as controls. (a) Cells were plated (20 000 per well) on standard or low‐attachment tissue‐culture plates to monitor anchored or non‐anchored cell growth at the time points indicated. Only the Src‐ and MEK‐transfected cells were capable of anchorage‐independent cell growth. (b) Phase contrast image of anchored and non‐anchored cells at 3 days (bar = 200 microns) and 10 days (bar = 500 microns) growth, respectively. (c) GFP‐tagged Sdpr was observed in non‐transformed and transformed cells by confocal microscopy. Sdpr expression was reduced by transformation with Src, but not MEK (bar = 20 microns). DIC, differential interference contrast.
As shown in Figure 3(c), GFP‐tagged Sdpr was clearly visible in MEK‐transformed cells and non‐transformed cells. This protein was found in the cytoplasm, and appeared to localize at the cell membrane, particularly at intercellular junctions. In contrast, Sdpr protein expression was greatly reduced in Src‐transformed cells.
Suppression of Sdpr protein expression by Src was confirmed by Western blot analysis. Significantly less product recognized by GFP antiserum was produced by Src‐transformed cells than MEK‐transformed or non‐transformed cells. These data were also confirmed by Western blot analysis with antiserum directed against Sdpr as shown in Figure 4(a).
Figure 4.
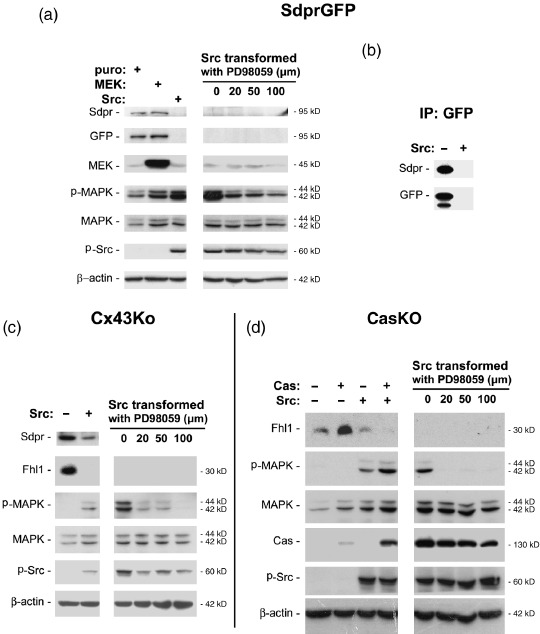
Effects of Src and mitogen‐activated protein kinase (MAPK) activity on Fhl1 and Sdpr expression. (a) An equal amount of total protein (10 µg/lane) from non‐transformed and Src‐transformed NIH 3T3 cells expressing a Central Dogma (CD)‐tagged Sdpr–GFP fusion protein was analyzed by Western blotting with antiserum specific for green fluorescence protein (GFP), Sdpr, mitogen‐activated protein kinase kinase (MEK), MAPK, active MAPK (p‐MAPK), active Src (p‐Src), and β‐actin as indicated. (b) An equal amount of protein (100 µg) was immunoprecipitated from non‐transformed and Src‐transformed NIH 3T3 cells expressing a CD‐tagged Sdpr–GFP fusion protein, and then examined by Western blot analysis with GFP or Sdpr antiserum. (c) An equal amount of total protein (10 µg/lane) from non‐transformed and Src‐transformed embryonic mouse brain cells was analyzed by Western blotting with antiserum specific for Sdpr, Fhl1, MAPK, active MAPK (p‐MAPK), active Src (p‐Src), and β‐actin as indicated. (d) An equal amount of total protein (10 µg/lane) from non‐transformed and Src transformed embryonic mouse fibroblasts with or without Cas was analyzed by Western blotting with antiserum specific for Fhl1, MAPK, active MAPK (p‐MAPK), Cas, active Src (p‐Src), and β‐actin as indicated. Src‐transformed cells were also treated with the MEK blocker PD98059 to determine if Src requires MAPK to suppress Fhl1 and Sdpr expression. In all cases, more Fhl1 and Sdpr protein was present in non‐transformed cells than Src‐transformed cells independent of MAPK activity.
In addition to analysis of total cell lysates, immunoprecipitation experiments confirmed that Src decreased Sdpr expression in tumor cells. Protein immunoprecipitated by GFP antiserum was analyzed by Western blotting with antiserum against GFP or Sdpr. More Sdpr protein was present in non‐transformed cells than Src‐transformed cells (see Fig. 4b). Results from Western blot analysis also confirmed that more Sdpr protein was present in non‐transformed cells than Src‐transformed embryonic mouse brain cells and fibroblasts used for the microarray analyses described above (see Fig. 4c,d).
These studies also indicate that Src did not utilize MAPK to suppress the expression of Fhl1 or Sdpr. As shown in 1, 4, chemical inhibition of MAPK activity did not block the ability of Src to suppress Fhl1 and Sdpr expression. In addition, as shown in Figure 4(c), MAPK activity induced by oncogenic MEK did not suppress Sdpr expression. These data are consistent with published studies that utilized reverse transcription‐polymerase chain reaction (RT‐PCR) to find that Fhl1 and Sdpr expression is suppressed in Src‐transformed cells, but induced during contact normalization by adjacent non‐transformed cells independent of MAPK activity.( 27 )
Suppression of Sdpr expression in tumors of the breast, prostate, and kidney. After verifying that Sdpr expression was reduced in Src‐transformed cells grown in culture, immunohistochemistry was used to compare Sdpr expression between cancerous and adjacent non‐cancerous human clinical specimens. As shown in Figure 1, more Sdpr expression was seen in the epithelium of non‐transformed breast, kidney, and prostate specimens than in matched specimens of mammary or renal carcinoma. As presented in Table 1, Sdpr was expressed in 40% of the samples from non‐transformed breast, 100% of non‐transformed kidney specimens, and approximately 60% of the non‐transformed prostate samples analyzed. In contrast, Sdpr expression was found in less than 7% of samples obtained from breast tumors, and in approximately 11% of the kidney and prostate tumors analyzed. Thus, like Fhl1, Sdpr expression was reduced in mammary and renal cell carcinoma. These differences were significant, with P‐values between 0.05 and 0.001. It should also be noted that Sdpr expression was detected in only four out of 50 samples from non‐matched kidney tumors and four out of 40 non‐matched prostate tumors that were also analyzed.
Mean intensity values of Sdpr expression were also lower in tumor cells that expressed Sdpr compared with non‐transformed cells. As shown in Table 1, non‐transformed breast, kidney, and prostate epithelium displayed Fhl1 expression intensities of approximately 1.6, 2.9, and 0.5, respectively. Samples from breast, kidney, and prostate tumors produced lower expression intensities of approximately 0.07, 0.2, and 0.1, respectively. These differences were significant, with P‐values between 0.03 and 0.0001.
Expression of Fhl1 and Sdpr seems to decline with prostate tumor progression. An important attribute of tumor cell biomarkers lies in their ability to distinguish more aggressive cancer cells from less aggressive cancer cells. We examined Fhl1 and Sdpr expression in 40 prostate tumor samples with Gleason scores as shown in Table 3. These data were examined using analysis of variance (ANOVA). Correlation of Fhl1 or Sdpr presence with Gleason score was insignificant, with P > 0.4. However, this significance increased to P < 0.1 when comparing tumors with Gleason scores of 7 or less with tumors with Gleason scores of 8 or more. ANOVA tests for expression intensity also suggest a trend for scores of 7 or less with higher Fhl1 or Sdpr expression, with expression levels of 0.26 ± 0.16 or 0.15 ± 0.08 (mean ± SEM), than tumors with scores of 8 or more, with expression levels of 0.09 ± 0.009 or 0.02 ± 0.02 (mean ± SEM), with P = 0.31 or P = 0.11, respectively.
Table 3.
Correlation of Fhl1 and Sdpr expression with Gleason stage of prostate tumors
| Gleason score | Fhl1 | Sdpr | ||||
|---|---|---|---|---|---|---|
| n | Presence | Intensity | n | Presence | Intensity | |
| 6 | 2 | 1 | 1 ± 1 | 2 | 0 | 0 ± 0 |
| 7 | 15 | 2 | 0.167 ± 0.140 | 15 | 3 | 0.167 ± 0.093 |
| 8 | 6 | 0 | 0 ± 0 | 6 | 1 | 0.083 ± 0.083 |
| 9 | 15 | 1 | 0.133 ± 0.133 | 15 | 0 | 0 ± 0 |
| 10 | 2 | 0 | 0 ± 0 | 2 | 0 | 0 ± 0 |
Prostate carcinoma samples were examined by immunohistochemistry with affinity purified peptide antibody against Fhl1. Samples were scored for Gleason stage and the presence or absence of Fhl1 expression, as well as intensity rated on scale from 1 to 4. ‘Presence’ is shown as the number of positive samples. ‘Intensity’ is shown as the mean ± SEM of samples within each Gleason stage. (n = number of samples analyzed).
Methylation of the Fhl1 gene in transformed cells. Tumor suppressor genes are frequently silenced by gene methylation in cancer cells.( 31 ) We sequenced PCR‐amplified bisulfite‐treated DNA to determine if Src induced methylation of the Fhl1 gene in transformed cells. As shown in Figure 5, the transcriptional start site of the Fhl1 gene lies in the midst of a CpG island that is several hundred bases long.( 19 ) This region contains 88 CpG sequences that were extensively methylated in both transformed and non‐transformed cells. However, as shown in Figure 5, 71 (approximately 80%) of these CpG residues were methylated at least 20% more in Src‐transformed cells than in non‐transformed cells. These data indicate that Src induces methylation of the promoter region of the Fhl1 gene in transformed cells.
Figure 5.

Fhl1 gene methylation in Src transformed cells. The transcriptional start site of Fhl1 (+1) lies in a CpG island of several hundred residues. PCR products from bisulfate‐treated DNA from non‐transformed and Src‐transformed cells were subcloned and sequenced. Data are shown as the percentage of each CpG sequence that was methylated (n = 5). More methylation of most of these sites was found in Src‐transformed cells than in non‐transformed cells.
Discussion
The Src tyrosine kinase is a clinically relevant promoter of tumor‐cell growth.( 2 , 3 ) Cas is an important component of the focal adhesion complex signaling network( 32 ) that also includes FAK, Grb2, Shc, and paxillin.( 33 , 34 ) After phosphorylation by Src, Cas can bind to other proteins including Crk, PI‐3‐kinase, Nck, and PLCγ.( 35 , 36 , 37 ) Src also activates MAPK to augment mitogenic signaling events.( 9 ) These cascades promote anchorage‐independent cell growth and migration characteristics that are required for metastatic cell growth.( 1 , 9 )
The experiments described here were designed to identify novel tumor cell markers that are involved in the neoplastic transformation process bolstered by Src kinase activity. For example, we have previously found that Src utilizes Cas to decrease the expression of Fhl1 in a variety of human tumors.( 19 ) Here, we focused our investigations on tumors of the breast, kidney, and prostate. When combined, tumors in these organs represent over 30% of all estimated human cancer cases (based on the National Cancer Institute's Surveillance, Epidemiology, and End Results program) and are predicted to result in over 80 000 deaths this year in the United States (based on National Center for Health Statistics’ Centers for Disease Control and Prevention).
In the present report, we utilized a non‐biased and global strategy to identify genes that are coordinately regulated in the neoplastic transformation process regulated by Src. Sdpr rose to the top of a list starting with genes represented by approximately 45 000 probe sets. Interestingly, this gene was also associated with the ability of normal cells to control the growth of adjacent tumor cells.( 27 )
Expression of Fhl1 and Sdpr was seen in the vast majority of non‐transformed tissues. Fhl1 and Sdpr were expressed in the epithelium of 100%, 40%, and over 50% of samples obtained from non‐transformed kidney, breast, prostate, respectively. However, it should be noted that ‘normal’ samples analyzed in the present study were taken from patients that developed tumors elsewhere in the tissues that were analyzed. Therefore, incomplete expression of Fhl1 and Sdpr in breast and prostate from these matched normal tissues is likely to represent the lower limit found in completely healthy individuals. Thus, it is possible that Fhl1 and Sdpr are expressed in breast, kidney and prostate in up to 100% of cancer‐free individuals.
Results of this investigation confirm previous findings that Fhl1 expression is suppressed in breast, kidney, and prostate tumors.( 19 ) Likewise, Sdpr expression was suppressed in tumors of the breast, kidney, and prostate examined in this study. These data support the potential use of Sdpr as a biomarker that lies downstream of Fhl1. These findings are consistent with reports that Sdpr is widely expressed in human tissues, but decreased in many cancer cells, including those of the prostate, kidney, and luminal breast epithelium.( 38 )
As stated above, Src utilizes Cas to suppress Fhl1 expression to promote anchorage independence and motility of tumor cells.( 19 ) Thus, Fhl1 is a prime regulator of the anchorage independence and migration required for metastatic cell growth. Interestingly, Fhl1 tops the list of genes suppressed by Src transformation, but turned back on in tumor cells being normalized by contact with adjacent non‐transformed cells.( 19 , 27 ) A role for Fhl1 as a tumor suppressor is also supported by reports of its deletion in human lung cancers( 39 ) and in malignant thyroid tumors.( 40 )
The human genome contains 58 known genes that encode LIM domains. LIM domains form zinc finger structures( 41 , 42 , 43 ) that mediate associations with other proteins.( 43 , 44 , 45 ) There are four genes that encode proteins consisting of four‐and‐a‐half LIM domains. These are named Fhl1, Fhl2, Fhl3, and Act (activator of cyclic adenosine monophosphate [AMP] response element in the testis).( 43 ) Members of the Fhl family shuttle between the cytoplasm and nucleus to influence gene expression.( 46 ) For example, Fhl family members can associate with other proteins to affect transcriptional activity of genes induced by cAMP.( 47 )
In this report, we have found that Fhl1 induces the expression of Sdpr in Src‐transformed cells. As with Fhl1, Src utilizes Cas to suppress Sdpr expression. Moreover, like Fhl1, Sdpr is induced in tumor cells that are normalized by contact with adjacent non‐transformed cells.( 19 , 27 ) Sdpr is a phosphatidylserine‐binding protein( 24 ) that is induced during growth arrest by serum deprivation of non‐transformed cells, but not transformed cells.( 25 ) Sdpr may target protein kinase C activity to the caveolae.( 48 )
Our data indicate that, like Fhl1, Sdpr is suppressed in human tumors. A potential role for Sdpr as a tumor marker is supported by other findings. For example, the Sdpr gene is located on chromosome region 2q33,( 25 ) which undergoes a high incidence of loss of heterozygosity in some lung cancers.( 49 ) An Sdpr relative called SRBC (sdr‐related gene product that binds to c‐kinase) is also induced by serum deprivation and associates with protein kinase C.( 50 ) Interestingly, SRBC expression is suppressed in lung and breast cancers,( 51 ) apparently by gene deletion( 52 ) or methylation.( 51 )
Our data also suggest that Fhl1 expression can be suppressed by gene methylation in transformed cells. We found 71 cytosine residues to be more methylated in Src‐transformed cells than non‐transformed cells. These lie in a CpG island that encompasses the Fhl1 promoter region and transcriptional start site.
In conclusion, this report utilized Src and Cas as a trigger to find genes that are modulated by Fhl1 in tumor cells. We have found that Src utilizes Cas to block Sdpr expression downstream of Fhl1 in tumor cells, and this event is independent of MAPK activity. Moreover, both Fhl1 and Sdpr may serve as clinically relevant markers for breast, kidney, and prostate tumors. Finally, we have identified several sites in the promoter region of Fhl1 that are methylated in Src‐transformed cells.
Acknowledgments
We are grateful to Christopher Marshall for supplying v‐Src, MEK, and pBabePuro constructs, and Xinhua Chen for help with statistical analysis. This work was supported by grants from the United States National Institutes of Health CA88805 and the Research Foundation of UMDNJ to GSG and by a Grant‐in‐Aid for Scientific Research on Priority Areas from the Ministry of Education, Culture, Sports, Science and Technology of Japan to HI.
This work was supported by grants from the United States National Institutes of Health CA88805 and the Research Foundation of UMDNJ to GSG and by a Grant‐in‐Aid for Scientific Research on Priority Areas from the Ministry of Education, Culture, Sports, Science and Technology of Japan to HI.
References
- 1. Frame MC. Newest findings on the oldest oncogene; how activated src does it. J Cell Sci 2004; 117: 989–98. [DOI] [PubMed] [Google Scholar]
- 2. Irby RB, Yeatman TJ. Role of Src expression and activation in human cancer. Oncogene 2000; 19: 5636–42. [DOI] [PubMed] [Google Scholar]
- 3. Frame MC. Src in cancer: deregulation and consequences for cell behaviour. Biochim Biophys Acta 2002; 1602: 114–30. [DOI] [PubMed] [Google Scholar]
- 4. Ottenhoff‐Kalff AE, Rijksen G, Van Beurden EA, Hennipman A, Michels AA, Staal GE. Characterization of protein tyrosine kinases from human breast cancer: involvement of the c‐src oncogene product. Cancer Res 1992; 52: 4773–8. [PubMed] [Google Scholar]
- 5. Verbeek BS, Vroom TM, Adriaansen‐Slot SS et al . c‐Src protein expression is increased in human breast cancer. An immunohistochemical and biochemical analysis. J Pathol 1996; 180: 383–8. [DOI] [PubMed] [Google Scholar]
- 6. Rosen N, Bolen JB, Schwartz AM, Cohen P, DeSeau V, Israel MA. Analysis of pp60c‐src protein kinase activity in human tumor cell lines and tissues. J Biol Chem 1986; 261: 13 754–9. [PubMed] [Google Scholar]
- 7. Yonezawa Y, Nagashima Y, Sato H et al . Contribution of the Src family of kinases to the appearance of malignant phenotypes in renal cancer cells. Mol Carcinog 2005; 43: 188–97. [DOI] [PubMed] [Google Scholar]
- 8. Desai SJ, Ma AH, Tepper CG, Chen HW, Kung HJ. Inappropriate activation of the androgen receptor by nonsteroids: involvement of the Src kinase pathway and its therapeutic implications. Cancer Res 2006; 66: 10 449–59. [DOI] [PubMed] [Google Scholar]
- 9. Cowley S, Paterson H, Kemp P, Marshall CJ. Activation of MAP kinase kinase is necessary and sufficient for PC12 differentiation and for transformation of NIH 3T3 cells. Cell 1994; 77: 841–52. [DOI] [PubMed] [Google Scholar]
- 10. Honda H, Oda H, Nakamoto T et al . Cardiovascular anomaly, impaired actin bundling and resistance to Src‐induced transformation in mice lacking p130Cas. Nat Genet 1998; 19: 361–5. [DOI] [PubMed] [Google Scholar]
- 11. Huang J, Hamasaki H, Nakamoto T et al . Differential regulation of cell migration, actin stress fiber organization, and cell transformation by functional domains of Crk‐associated substrate. J Biol Chem 2002; 277: 27 265–72. [DOI] [PubMed] [Google Scholar]
- 12. Cho SY, Klemke RL. Extracellular‐regulated kinase activation and CAS/Crk coupling regulate cell migration and suppress apoptosis during invasion of the extracellular matrix. J Cell Biol 2000; 149: 223–36. [DOI] [PMC free article] [PubMed] [Google Scholar]
- 13. Klemke RL, Leng J, Molander R, Brooks PC, Vuori K, Cheresh DA. CAS/Crk coupling serves as a ‘molecular switch’ for induction of cell migration. J Cell Biol 1998; 140: 961–72. [DOI] [PMC free article] [PubMed] [Google Scholar]
- 14. Brabek J, Constancio SS, Shin NY, Pozzi A, Weaver AM, Hanks SK. CAS promotes invasiveness of Src‐transformed cells. Oncogene 2004; 23: 7406–15. [DOI] [PubMed] [Google Scholar]
- 15. Shin NY, Dise RS, Schneider‐Mergener J, Ritchie MD, Kilkenny DM, Hanks SK. Subsets of the major tyrosine phosphorylation sites in Crk‐associated substrate (CAS) are sufficient to promote cell migration. J Biol Chem 2004; 279: 38 331–7. [DOI] [PubMed] [Google Scholar]
- 16. Goldberg GS, Alexander DB, Pellicena P, Zhang ZY, Tsuda H, Miller WT. Src phosphorylates Cas on tyrosine 253 to promote migration of transformed cells. J Biol Chem 2003; 278: 46 533–40. [DOI] [PMC free article] [PubMed] [Google Scholar]
- 17. Frisch SM, Screaton RA. Anoikis mechanisms. Curr Opin Cell Biol 2001; 13: 555–62. [DOI] [PubMed] [Google Scholar]
- 18. Giancotti FG, Ruoslahti E. Integrin signaling. Science 1999; 285: 1028–32. [DOI] [PubMed] [Google Scholar]
- 19. Shen Y, Jia Z, Nagele RG, Ichikawa H, Goldberg GS. SRC uses Cas to suppress Fhl1 in order to promote nonanchored growth and migration of tumor cells. Cancer Res 2006; 66: 1543–52. [DOI] [PubMed] [Google Scholar]
- 20. Huang HY, Li R, Sun Q, Wang J, Zhou P, Han H, Zhang WH. [LIM protein KyoT2 interacts with human tight junction protein ZO‐2‐i3]. Yi Chuan Xue Bao 2002; 29: 953–8. [PubMed] [Google Scholar]
- 21. Brown S, McGrath MJ, Ooms LM, Gurung R, Maimone MM, Mitchell CA. Characterization of two isoforms of the skeletal muscle LIM protein 1, SLIM1. Localization of SLIM1 at focal adhesions and the isoform slimmer in the nucleus of myoblasts and cytoplasm of myotubes suggests distinct roles in the cytoskeleton and in nuclear‐cytoplasmic communication. J Biol Chem 1999; 274: 27 083–91. [DOI] [PubMed] [Google Scholar]
- 22. Taniguchi Y, Furukawa T, Tun T, Han H, Honjo T. LIM protein KyoT2 negatively regulates transcription by association with the RBP‐J DNA‐binding protein. Mol Cell Biol 1998; 18: 644–54. [DOI] [PMC free article] [PubMed] [Google Scholar]
- 23. Qin HD, Zhu Y, Li J, Feng L, Liang Y, Han H. The PcG protein HPC2 inhibits RBP‐J‐mediated transcription by interacting with LIM protein KyoT2. FEBS Lett 2005; 579: 1220–6. [DOI] [PubMed] [Google Scholar]
- 24. Gustincich S, Vatta P, Goruppi S et al . The human serum deprivation response gene (SDPR) maps to 2q32‐q33 and codes for a phosphatidylserine‐binding protein. Genomics 1999; 57: 120–9. [DOI] [PubMed] [Google Scholar]
- 25. Gustincich S, Schneider C. Serum deprivation response gene is induced by serum starvation but not by contact inhibition. Cell Growth Differ 1993; 4: 753–60. [PubMed] [Google Scholar]
- 26. Patwardhan P, Shen Y, Goldberg GS, Miller WT. Individual Cas phosphorylation sites are dispensable for processive phosphorylation by Src and cellular transformation. J Biol Chem 2006; 281: 20 689–97. [DOI] [PMC free article] [PubMed] [Google Scholar]
- 27. Alexander DB, Ichikawa H, Bechberger JF et al . Normal cells control the growth of neighboring transformed cells independent of gap junctional communication and SRC activity. Cancer Res 2004; 64: 1347–58. [DOI] [PubMed] [Google Scholar]
- 28. Jarvik JW, Fisher GW, Shi C et al . In vivo functional proteomics: mammalian genome annotation using CD‐tagging. Biotechniques 2002; 33: 852–60. [DOI] [PubMed] [Google Scholar]
- 29. Alexander DB, Goldberg GS. Transfer of biologically important molecules between cells through gap junction channels. Curr Med 2003; 10: 2045–58. [DOI] [PubMed] [Google Scholar]
- 30. Frommer M, McDonald LE, Millar DS et al . Genomic sequencing protocol that yields a positive display of 5‐methylcytosine residues in individual DNA strands. Proc Natl Acad Sci USA 1992; 89: 1827–31. [DOI] [PMC free article] [PubMed] [Google Scholar]
- 31. Baylin SB. DNA methylation and gene silencing in cancer. Nat Clin Pract Oncol 2005; 2 (Suppl. 1): S4–11. [DOI] [PubMed] [Google Scholar]
- 32. Bouton AH, Riggins RB, Bruce‐Staskal PJ. Functions of the adapter protein Cas: signal convergence and the determination of cellular responses. Oncogene 2001; 20: 6448–58. [DOI] [PubMed] [Google Scholar]
- 33. Schlaepfer DD, Hauck CR, Sieg DJ. Signaling through focal adhesion kinase. Prog Biophys Mol Biol 1999; 71: 435–78. [DOI] [PubMed] [Google Scholar]
- 34. Sieg DJ, Hauck CR, Schlaepfer DD. Required role of focal adhesion kinase (FAK) for integrin‐stimulated cell migration. J Cell Sci 1999; 112 (16): 2677–91. [DOI] [PubMed] [Google Scholar]
- 35. Sakai R, Iwamatsu A, Hirano N et al . A novel signaling molecule, p130, forms stable complexes in vivo with v‐Crk and v‐Src in a tyrosine phosphorylation‐dependent manner. EMBO J 1994; 13: 3748–56. [DOI] [PMC free article] [PubMed] [Google Scholar]
- 36. Burnham MR, Harte MT, Richardson A, Parsons JT, Bouton AH. The identification of p130cas‐binding proteins and their role in cellular transformation. Oncogene 1996; 12: 2467–72. [PubMed] [Google Scholar]
- 37. Vuori K, Hirai H, Aizawa S, Ruoslahti E. Introduction of p130cas signaling complex formation upon integrin‐mediated cell adhesion: a role for Src family kinases. Mol Cell Biol 1996; 16: 2606–13. [DOI] [PMC free article] [PubMed] [Google Scholar]
- 38. Allinen M, Beroukhim R, Cai L et al . Molecular characterization of the tumor microenvironment in breast cancer. Cancer Cell 2004; 6: 17–32. [DOI] [PubMed] [Google Scholar]
- 39. Jiang F, Yin Z, Caraway NP, Li R, Katz RL. Genomic profiles in stage I primary non small cell lung cancer using comparative genomic hybridization analysis of cDNA microarrays. Neoplasia 2004; 6: 623–35. [DOI] [PMC free article] [PubMed] [Google Scholar]
- 40. Fryknas M, Wickenberg‐Bolin U, Goransson H et al . Molecular markers for discrimination of benign and malignant follicular thyroid tumors. Tumour Biol 2006; 27: 211–20. [DOI] [PubMed] [Google Scholar]
- 41. Michelsen JW, Sewell AK, Louis HA et al . Mutational analysis of the metal sites in an LIM domain. J Biol Chem 1994; 269: 11 108–13. [PubMed] [Google Scholar]
- 42. Schmeichel KL, Beckerle MC. Molecular dissection of a LIM domain. Mol Biol Cell 1997; 8: 219–30. [DOI] [PMC free article] [PubMed] [Google Scholar]
- 43. Kadrmas JL, Beckerle MC. The LIM domain: from the cytoskeleton to the nucleus. Nat Rev Mol Cell Biol 2004; 5: 920–31. [DOI] [PubMed] [Google Scholar]
- 44. Schmeichel KL, Beckerle MC. The LIM domain is a modular protein‐binding interface. Cell 1994; 79: 211–19. [DOI] [PubMed] [Google Scholar]
- 45. Feuerstein R, Wang X, Song D, Cooke NE, Liebhaber SA. The LIM/double zinc‐finger motif functions as a protein dimerization domain. Proc Natl Acad Sci USA 1994; 91: 10 655–9. [DOI] [PMC free article] [PubMed] [Google Scholar]
- 46. Muller JM, Metzger E, Greschik H et al . The transcriptional coactivator FHL2 transmits Rho signals from the cell membrane into the nucleus. EMBO J 2002; 21: 736–48. [DOI] [PMC free article] [PubMed] [Google Scholar]
- 47. Fimia GM, De Cesare D, Sassone‐Corsi P. A family of LIM‐only transcriptional coactivators: tissue‐specific expression and selective activation of CREB and CREM. Mol Cell Biol 2000; 20: 8613–22. [DOI] [PMC free article] [PubMed] [Google Scholar]
- 48. Mineo C, Ying YS, Chapline C, Jaken S, Anderson RG. Targeting of protein kinase C alpha to caveolae. J Cell Biol 1998; 141: 601–10. [DOI] [PMC free article] [PubMed] [Google Scholar]
- 49. Otsuka T, Kohno T, Mori M, Noguchi M, Hirohashi S, Yokota J. Deletion mapping of chromosome 2 in human lung carcinoma. Genes Chromosomes Cancer 1996; 16: 113–19. [DOI] [PubMed] [Google Scholar]
- 50. Izumi Y, Hirai S, Tamai Y, Fujise‐Matsuoka A, Nishimura Y, Ohno S. A protein kinase C delta‐binding protein SRBC whose expression is induced by serum starvation. J Biol Chem 1997; 272: 7381–9. [DOI] [PubMed] [Google Scholar]
- 51. Xu XL, Wu LC, Du F et al . Inactivation of human SRBC, located within the 11p15.5‐p15.4 tumor suppressor region, in breast and lung cancers. Cancer Res 2001; 61: 7943–9. [PubMed] [Google Scholar]
- 52. Kohno T, Otsuka T, Inazawa J, Abe T, Yokota J. Breakpoint junction of interstitial homozygous deletion at chromosome 2q33 in a small cell lung carcinoma. DNA Res 1996; 3: 421–4. [DOI] [PubMed] [Google Scholar]