

Abstract
The expression of CD10 in tumor cells has been reported to correlate with liver metastasis in colorectal cancer (CRC). However, fibroblasts and immune cells positive for CD10 at the tumor invasion front have not been comprehensively studied. We classified CD10 expression patterns into three types of cells, tumor cells (tCD10), stromal myofibroblasts (sCD10), and immune cells (iCD10), and investigated their correlation with the expression of transforming growth factor‐β (TGF‐β1) protein and tumor budding grade. Several cell surface markers were stained to detect the phenotype of iCD10+ cells, including CD3, CD20, CD11b, CD14, CD15, and CD163. Specimens and follow‐up data of 206 CRC patients were examined. In multivariate analysis, iCD10 could be an independent prognostic factor for both recurrence‐free survival and overall survival in stage I–III CRC (hazard ratio, 2.522 [1.299–4.896], P = 0.006; 2.890 [1.357–6.157], P = 0.006, respectively). The expression of sCD10 and iCD10 was strongly correlated with TGF‐β1 expression in tumor cells and tumor budding grade. The phenotype of iCD10+ cells was CD11b+ and CD15+ granulocytes. The infiltration of sCD10+ fibroblasts and iCD10+ granulocytes at the tumor invasion front might interact with TGF‐β1 protein expression and enhance tumor budding grade. The expression level of iCD10 at the tumor invasion front represented an independent prognostic biomarker in stage I–III CRC and could be integrated into a new staging system. (Cancer Sci 2011; 102: 1724–1733)
Colorectal cancer (CRC) is the third most frequently diagnosed cancer worldwide.( 1 ) According to the new TNM staging system, it is now clear that there is an interaction between the T (tumor depth) and N (lymph node metastasis) designations that is likely to depend on the expression of specific molecules within the cancer cells.( 2 ) Thus, by the time the next edition of the UICC’s TNM Classification of Malignant Tumors is published, it might be possible to add molecular profiling information to enhance the accuracy of prognoses or even responses to therapy.
CD10 was first reported as a source of an epitope of the J5 mAb that was used to identify subtypes of leukemia 28 years ago.( 3 ) CD10 is a 90–100‐kDa cell surface–zinc‐dependent metalloprotease that has been referred to as neutral endopeptidase (EC 3.4.24.11), enkephalinase, neprilysin, and common acute lymphoblastic leukemia antigen.( 4 ) CD10 is normally expressed on the brush border of the small intestine, the lining cells of the intrahepatic biliary tract, granulocytes, germinal center B cells, and some lymphoid progenitor cells that express nuclear terminal deoxynucleotidyl transferase.( 5 ) Previously, CD10 protein was found to be expressed in colorectal cancer tissue including tumor cells,( 6 , 7 , 8 , 9 , 10 ) and tumor‐associated fibroblasts.( 11 ) Some reports revealed that CD10 in tumor cells was associated with liver metastasis in CRC,( 8 , 9 , 10 , 11 , 12 ) and the expression of CD10 in stromal myofibroblasts increased during CRC development.( 11 ) However, it is not yet known whether CD10 is expressed in inflammatory infiltrating cells in CRC. To elucidate the role of CD10 in the development of CRC, we carried out immunohistochemical staining of CD10 in CRC and classified the expression patterns of CD10 into three different types including tumor cells, stromal myofibroblasts, and infiltrating immune cells.
Cross‐talk between tumor cells and the host immune reaction is associated with several cytokines. It has been reported that the transforming growth factor‐β (TGF‐β) is an important cytokine involved in this cross‐talk,( 13 ) which regulates cell proliferation, differentiation, motility, apoptosis, and ECM formation in different cell types in the tumor microenvironment.( 14 , 15 , 16 , 17 ) In the advanced stages of CRC, high expression of TGF‐β1 protein by tumor cells is correlated with tumor progression,( 16 , 17 ) and may induce infiltration and polarization of infiltrating immune cells at the tumor–host interface.( 18 )
Moreover, TGF‐β1 protein was primarily secreted in latent type. The physiological activation of TGF‐β1 from latent type may involve surface receptors and localized protease activity. During this process, a hinge region in latent TGF‐β binding protein needs to be exposed and cleaved by proteases. The large latent complex from the tissue matrix is released by proteases such as metalloproteases.( 19 ) Therefore, the novel relationship between the expression of CD10, as a metalloprotease, and TGF‐β1 protein at the tumor invasion front is explored in this report.
In addition, the expression patterns of CD10 and TGF‐β1 protein were examined at tumor invasion fronts. Tumor budding has been widely reported as one of the most important prognostic factors and represents the tumor dissemination phenotype.( 20 , 21 ) The correlation between CD10 expression patterns and the budding grade of tumor cells was also examined to support the association between unfavorable outcome and CD10 expression patterns.
Materials and Methods
Patients and specimens. We examined tissue samples from CRC patients who underwent surgical treatment between 1998 and 2005 at the Shiga University of Medical Science Hospital (Otsu, Shiga, Japan). Of these, 206 cases were suitable for enrolment in this retrospective study, which fulfilled following three criteria: (i) adenocarcinoma as the histological diagnosis; (ii) at least 5‐year follow‐up for censor subjects; and (iii) the maximal size of tissues could be retrieved. This study consisted of 114 males and 92 females; the patients’ age ranged from 19 to 92 years (mean, 63.3 years). All of the 67 stage III patients and 39 of 71 stage II patients received adjuvant therapy with 5‐fluorouracil. The baseline clinicopathological features are given in Table 1. Cancer tissue specimens were used after informed consent was obtained from the patients in accordance with the institutional guidelines. Specimens were fixed in 10% formalin for 24–48 h and embedded in paraffin blocks. Tissue sections were sampled along the maximum tumor diameter and included the deepest site of cancer invasion.
Table 1.
Correlation between CD10 expression patterns and baseline characteristic features in 206 patients with colorectal cancer
| Factors | n = 206 | tCD10 | P‐value | sCD10 | P‐value | iCD10 | P‐value | |||
|---|---|---|---|---|---|---|---|---|---|---|
| Low | High | Low | High | Low | High | |||||
| Age (years) | ||||||||||
| <60 | 73 (35.4) | 47 (64.4) | 26 (35.6) | 0.500† | 49 (67.1) | 24 (32.9) | 0.302† | 47 (64.4) | 26 (35.6) | 0.073† |
| ≥60 | 133 (65.6) | 87 (56.4) | 46 (34.6) | 83 (62.4) | 50 (37.6) | 102 (76.7) | 31 (23.3) | |||
| Gender | ||||||||||
| Female | 92 (44.7) | 65 (70.7) | 27 (29.3) | 0.085† | 61 (66.3) | 31 (33.7) | 0.326† | 71 (77.2) | 21 (22.8) | 0.107† |
| Male | 114 (55.3) | 69 (60.5) | 45 (39.5) | 71 (62.3) | 43 (37.7) | 78 (68.4) | 36 (31.6) | |||
| Location | ||||||||||
| Colon | 114 (55.3) | 71 (61.4) | 43 (38.6) | 0.218† | 82 (71.9) | 32 (28.1) | 0.007† | 86 (75.4) | 28 (24.6) | 0.170† |
| Rectum | 92 (44.7) | 63 (68.5) | 29 (31.5) | 50 (54.3) | 42 (45.7) | 63 (68.5) | 29 (31.5) | |||
| Histological type | ||||||||||
| Well | 50 (24.3) | 29 (58.0) | 21 (42.0) | 0.029‡ | 32 (64.0) | 18 (36.0) | 0.910‡ | 32 (64.0) | 18 (36.0) | 0.099‡ |
| Moderate | 144 (69.9) | 93 (64.6) | 51 (35.4) | 93 (64.6) | 51 (35.4) | 107 (74.3) | 37 (25.7) | |||
| Poor | 12 (5.8) | 12 (100.0) | 0 (0.0) | 7 (58.3) | 5 (41.7) | 10 (83.3) | 2 (16.7) | |||
| Tumor depth | ||||||||||
| pT1 | 14 (6.8) | 12 (85.7) | 2 (14.3) | 0.920‡ | 9 (64.3) | 5 (35.7) | 0.908‡ | 9 (64.3) | 5 (35.7) | 0.106‡ |
| pT2 | 34 (16.5) | 22 (64.7) | 12 (35.3) | 22 (64.7) | 12 (35.3) | 29 (85.3) | 5 (14.7) | |||
| pT3 | 92 (44.7) | 52 (56.5) | 40 (43.5) | 61 (66.3) | 31 (33.7) | 69 (75.0) | 23 (25.0) | |||
| pT4 | 66 (32.0) | 48 (72.7) | 18 (27.3) | 40 (60.6) | 26 (39.4) | 42 (63.6) | 24 (36.4) | |||
| LN metastasis | ||||||||||
| Negative | 111 (53.9) | 70 (63.1) | 41 (36.9) | 0.309† | 71 (64.0) | 40 (36.0) | 0.544† | 74 (66.7) | 37 (33.3) | 0.061† |
| Positive | 95 (46.1) | 64 (67.4) | 31 (32.6) | 61 (64.2) | 34 (35.8) | 75 (78.9) | 20 (21.1) | |||
| Distant metastasis | ||||||||||
| No | 169 (82.0) | 110 (65.1) | 59 (34.9) | 0.560† | 106 (62.7) | 63 (37.3) | 0.251† | 122 (72.2) | 47 (27.8) | 0.550† |
| Yes | 37 (18.0) | 24 (64.9) | 13 (35.1) | 26 (70.3) | 11 (29.7) | 27 (73.0) | 10 (27.0) | |||
| TNM stage | ||||||||||
| I | 31 (15.0) | 20 (64.5) | 11 (35.5) | 0.708‡ | 22 (71.0) | 9 (29.0) | 0.598‡ | 24 (77.4) | 7 (22.6) | 0.575‡ |
| II | 71 (34.5) | 44 (62.0) | 27 (38.0) | 43 (60.6) | 28 (39.4) | 45 (63.4) | 26 (36.6) | |||
| III | 67 (32.5) | 46 (68.7) | 21 (31.3) | 41 (61.2) | 26 (38.8) | 53 (79.1) | 14 (20.9) | |||
| IV | 37 (18.0) | 24 (64.9) | 13 (35.1) | 26 (70.3) | 11 (29.7) | 27 (73.0) | 10 (27.0) | |||
| Total | 206 | 134 (65.0) | 72 (35.0) | 132 (64.1) | 74 (35.9) | 149 (72.3) | 57 (27.7) | |||
Values expressed as n (%). P‐values < 0.05 are highlighted in bold. †Chi‐squared of Fisher’s exact test. ‡Linear‐by‐linear association. iCD10, CD10 expression in immune cells; LN, lymph node; sCD10, CD10 expression in stromal myofibroblasts; tCD10, CD10 expression in tumor cells.
Immunohistochemistry for individual staining. Using serial 3‐μm tissue sections, immunohistochemical stainings were carried out with mouse mAb CD10 (Clone 56C6, 1:100; Leica Biosystems, Newcastle, UK), TGF‐β1 (Clone TB21, 1:500; Santa Cruz Biotechnology, Santa Cruz, CA, USA), and pan‐cytokeratin (Clone AE1/AE3, Ready‐to‐use; Dako, Glostrup, Denmark). Antigen retrieval was carried out using Immunosaver (1:200; Nissin EM, Tokyo, Japan) at 98°C for 45 min. The sections were incubated with the primary antibodies for 18 h at 4°C after blocking with hydrogen peroxide, 3% in methanol. The antibodies bound to tissue sections were detected by a polymer method (Histofine MAX‐PO multi; Nichirei, Tokyo, Japan) and visualized using diaminobenzidine (Histofine DAB solution; Nichirei). Nuclei were lightly counterstained with hematoxylin.
Evaluation of immunohistochemical staining. All slides were assessed by two investigators (KDT, KM), without any prior knowledge of patient data, using captured microscopic images on a monitor. Expression levels of CD10 and TGF‐β1 were evaluated along the tumor invasion front over the whole section (7–10 view fields per section).
Expression patterns of CD10 were classified into three cell types: tumor cell expression (tCD10); pericryptal stromal myofibroblast expression (sCD10); and infiltrated immune cell expression at the tumor invasion front (iCD10). Expression levels of tCD10, sCD10, and TGF‐β1 in tumor cells were divided into four grades based on the percentage encountered: (i) grade 0, negative or weak staining up to 5%; (ii) grade 1+, 5–30% tumor encountered; (iii) grade 2+, 30–60% tumor encountered; and (iv) grade 3+, over 60% tumor encountered. Expression levels of iCD10 were divided into four grades: (i) grade 0, negative or weak expression along the tumor invasion front over the whole section; (ii) grade 1+, strong expression in <0.25 area of the tumor invasion front over the whole section; (iii) grade 2+, strong expression in 0.25–0.5 area of the tumor invasion front over the whole section; and (iv) grade 3+, strong expression in more than 0.5 area of the tumor invasion front over the whole section. For statistical analysis of CD10 expression patterns, grades 0 and 1+ were counted as the low expression level group, and grades 2+ and 3+ were counted as the high expression level group.
The tumor budding grade was assessed by a method similar to one previous report( 21 ) using pan‐cytokeratin mAb. Briefly, the sections were viewed at scanning magnification and three areas with maximal budding were located at the invasion fronts. Subsequently, single tumor cells or all separate microclusters of tumor cells with five or fewer nuclei were counted in three maximal budding areas at ×200 magnification using captured microscopic images on a monitor. The final result of budding grade was scored as the average of three maximal budding areas.
Immunohistochemistry for double‐labeled staining. Double‐labeled staining was carried out to show the associations between CD10 and TGF‐β1 protein expressions by two different double detection methods, following the manufacturer’s instructions. Antigen retrieval was carried out using Immunosaver (1:200; Nissin EM) at 98°C for 45 min before each primary antibody incubation. A 1:500 dilution of TGF‐β1 mAb was incubated at room temperature for 30 min as the first primary antibody, detected by the alkaline phosphatase method with a Histofine Simple Stain AP kit (Nichirei), then visualized by 5‐bromo‐4‐chloro‐3‐indolyl phosphate (BCIP)/nitro blue tetrazolium (NBT) (blue) (Dako, Glostrup, Denmark). The second primary antibody, CD10, was incubated at room temperature at a 1:50 dilution for 45 min and detected by a polymer method, MAX‐PO multi (Nichirei), using 3,3′‐diaminobenzidine‐tetrachloride (Nichirei) as visualization.
Investigation of the phenotype of iCD10+ cells. To investigate the phenotype of iCD10+ cells, other cell surface markers were stained, including CD3 (Clone PS1, ready‐to‐use; Nichirei) for T‐cells, CD20 (Clone L26, ready‐to‐use; Nichirei) for B‐cells, CD11b (Clone EP1345Y, 1:200; Abcam, Cambridge, MA, USA) and CD15 (Clone C3D‐1, 1:50; Dako) for granulocytes, and CD14 (Clone 7, 1:100; Leica Biosystems) and CD163 (Clone 10D6, 1:100; Leica Biosystems) for monocytes and macrophages, respectively.( 22 )
Investigation of infiltrating neutrophils by H&E staining. Neutrophils (polymorphonuclear cells) were detected on H&E stained sections in all cases using the method described by Klintrup et al. ( 23 ) Briefly, a four‐point scale is used that indicates: 0, absence of granulocytes; 1, weak staining; 2, moderate staining; and 3, substantial increase in the number of granulocytes. Scores 0 and 1 are considered to represent low infiltration of neutrophils, whereas scores 2 and 3 represent high infiltration.
Statistical analysis. Cross‐tabulations were analyzed with the chi‐squared test and Fisher’s exact test. To test the linear association between two ordinal scale variables, the exact linear‐by‐linear association test was carried out. Means of budding grade in each group were compared using anova. Kaplan–Meier survival analysis was used to estimate cancer‐specific survival, and comparisons between groups were carried out using the Mantel log–rank test. To study the multivariate analysis for covariates, we used a Cox regression model to determine hazard ratios (HR) for prognostic factors. Statistical analyses were carried out using spss statistical software version 19.0.0 (IBM, New York, NY, USA). A level of P < 0.05 was considered statistically significant.
Results
Clinicopathological characteristics and CD10 expression patterns. Expression patterns of CD10 are shown in Figure 1, including tCD10, sCD10, and iCD10. High expression was observed in 72 of 206 (35.0%) tumors for tCD10, 74 of 206 (35.9%) tumors for sCD10, and 57 of 206 (27.7%) tumors for iCD10. Clinicopathological characteristics and CD10 expression patterns are summarized in Table 1. Significant correlations were found between tCD10 with histological type (P = 0.029), and sCD10 with tumor location (P = 0.007). No significant association was found between any CD10 expression patterns and factors in TNM staging.
Figure 1.
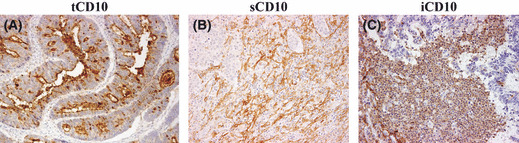
Expression patterns of CD10 protein in colorectal cancer. CD10 expression in (A) tumor cells (×200), (B) stromal myofibroblasts (×100 field), and (C) infiltrating immune cells (×100 field).
Outcome prediction of CD10 expression patterns and other clinicopathological factors. We investigated the clinical outcome of 169 patients, excluding cases of stage IV, who underwent curative treatment by surgery and adjuvant therapy. There were three of 31 (9.7%) patients with stage I, 15 of 71 (21.1%) patients with stage II, and 30 of 67 (44.8%) patients with stage III who developed disease recurrence during the follow‐up period. Table 2 shows the outcome impact of CD10 expression pattern together with baseline clinicopathological factors, including recurrence‐free survival (RFS) and overall survival (OS) analyzed by univariate and multivariate analysis using the Cox regression model. Univariate analyses of recurrence status revealed that the histological type, tumor depth, lymph node status, tumor budding, and iCD10 expression were predictors of disease recurrence status. However, in multivariate analysis of these factors, lymph node status, histological type, and iCD10 were independent prognostic factors of RFS (HR, 4.968 (1.887–13.078), P = 0.001; 2.812 (1.001–7.903), P = 0.050; and 2.522 (1.299–4.896), P = 0.006, respectively). In parallel, univariate analysis of OS showed that histological type, tumor depth, lymph node status, tumor budding, TGF‐β1, and iCD10 expression were predictors of survival. However, in multivariate analysis, only lymph node status and iCD10 expression were independent prognostic factors for OS (HR, 4.316 (1.474–12.896), P = 0.008; and 2.890 (1.357–6.157), P = 0.006, respectively). In the stage IV group, iCD10 was not significant for prediction of overall survival.
Table 2.
Univariate and multivariate analysis of prognostic factors in stage I–III cases of colorectal cancer
| Factor | n = 169 | Recurrence‐free survival predictor | Overall survival predictor | ||||||
|---|---|---|---|---|---|---|---|---|---|
| Univariate | Multivariate | Univariate | Multivariate | ||||||
| Risk indicator | P‐value† | OR | 95% confidence interval | P‐value‡ | P‐value§ | HR | 95% confidence interval | P‐value‡ | |
| Tumor depth | pT4 | 0.019 | 1.825 | 0.982–3.392 | 0.057 | 0.034 | 1.728 | 0.867–3.447 | 0.120 |
| Lymph node | Positive | <0.001 | 4.968 | 1.887–13.078 | 0.001 | 0.004 | 4.361 | 1.474–12.896 | 0.008 |
| Histological type | Poor | 0.031 | 2.812 | 1.001–7.903 | 0.050 | 0.037 | 3.120 | 0.969–10.039 | 0.056 |
| tCD10 | High | 0.246 | 1.711 | 0.886–3.305 | 0.110 | 0.555 | 1.690 | 0.803–3.557 | 0.167 |
| sCD10 | High | 0.764 | 0.640 | 0.316–1.297 | 0.216 | 0.170 | 0.813 | 0.370–1.783 | 0.605 |
| iCD10 | High | 0.005 | 2.522 | 1.299–4.896 | 0.006 | <0.001 | 2.890 | 1.357–6.157 | 0.006 |
| TGF‐β1 | High | 0.091 | 1.456 | 0.740–2.867 | 0.277 | 0.028 | 1.618 | 0.736–3.557 | 0.231 |
| Budding | High | 0.037 | 1.523 | 0.802–2.893 | 0.199 | 0.008 | 1.738 | 0.829–3.645 | 0.143 |
| Adjuvant therapy | No | 0.093 | 1.933 | 0.683–5.469 | 0.214 | 0.288 | 2.141 | 0.757–7.697 | 0.136 |
P‐values < 0.05 and significant results are highlighted in bold. †Chi‐squared test; ‡Cox regression model; §Log–rank test. iCD10, CD10 expression in immune cells; sCD10, CD10 expression in stromal myofibroblasts; tCD10, CD10 expression in tumor cells; TGF‐β1, transforming growth factor‐β1.
Integration of iCD10 into TNM system to reclassify stage I–III CRC. The role of TNM staging to predict patient outcome in stage I–III CRC is shown in Figure 2(A) for RFS and Figure 2(B) for OS. When adding iCD10 criteria to the first three stages of TNM staging, six subsets of patients were determined. Figure 2(C,D) shows the RFS and OS of these six populations. We reclassified the stages into three groups labeled A, B, and C following their cumulative survival results. Group A included stage I and II with iCD10 low expression. Group B included stage I and II with iCD10 high expression and stage III with iCD10 low expression. Group C included stage III with iCD10 high expression. We found that these classifications only depended on lymph node metastasis status and iCD10 expression (Fig. 2C). Using this classification, Figure 2(E,F) shows that RFS and OS were more significant when compared to the basic TNM staging only, based on the chi‐squared statistical results given in Figure 2(A,B,E,F). This result suggested that it is useful to add iCD10 criteria to TNM staging in stage I–III disease.
Figure 2.
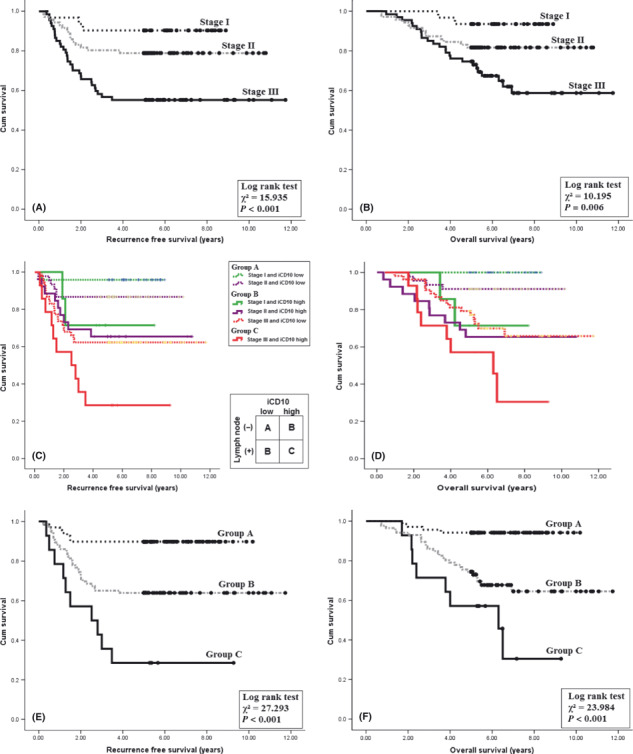
Kaplan–Meier analysis using the CD10 expression level of infiltrating immune cells (iCD10+) integrated into the TNM staging system. (A,B) Recurrence‐free survival and overall survival using the TNM system. (C,D) Integration of iCD10 criteria into the TNM system. (E,F) Three groups of patients, after integration of iCD10 into the TNM system, showed increased significance of prognosis compared to the TNM system only.
Correlation between CD10 expression patterns and TGF‐β1 protein at tumor invasion front. The correlation between TGF‐β1 protein and expression patterns of CD10 is shown in Table 3. There was correlation between tCD10 and TGF‐β1 (P = 0.027) and strong correlation between sCD10 and iCD10 with TGF‐β1 protein expression in tumor cells at the invasion front (P = 0.001 and P < 0.001, respectively). The co‐expressed crypts of tCD10 and TGF‐β1 protein are shown in Figure 3(A). The expression of tCD10 is located in the apical membranes of tumor crypts, and TGF‐β1 is mainly expressed in the cytoplasm of tumor cells. The association between TGF‐β1 expression and CD10 expression in stroma, including sCD10 and iCD10, is shown in Figure 3(B).
Table 3.
Correlation between CD10 expression pattern and transforming growth factor‐β1 (TGF‐β1) protein expression and budding status at the tumor invasion fronts in 206 patients with colorectal cancer
| Factors | n = 206 | TGF‐β1 | P‐value† | Budding | P‐value‡ | |||
|---|---|---|---|---|---|---|---|---|
| 0 | 1+ | 2+ | 3+ | Mean (95% CI) | ||||
| tCD10 | ||||||||
| 0 | 104 | 25 | 28 | 34 | 17 | 0.027 | 20.66 (17.99–23.33) | 0.214 |
| 1+ | 30 | 6 | 6 | 8 | 10 | 22.22 (17.77–26.68) | ||
| 2+ | 26 | 3 | 5 | 11 | 7 | 23.95 (17.61–30.29) | ||
| 3+ | 46 | 5 | 14 | 14 | 13 | 17.50 (18.75–22.44) | ||
| sCD10 | ||||||||
| 0 | 60 | 15 | 22 | 11 | 12 | 0.001 | 14.49 (12.20–16.79) | <0.001 |
| 1+ | 72 | 15 | 20 | 22 | 15 | 20.13 (17.17–23.09) | ||
| 2+ | 43 | 7 | 7 | 17 | 12 | 24.40 (19.50–29.29) | ||
| 3+ | 31 | 2 | 4 | 17 | 8 | 28.20 (23.07–33.34) | ||
| iCD10 | ||||||||
| 0 | 88 | 19 | 32 | 22 | 15 | <0.001 | 16.48 (14.34–18.63) | <0.001 |
| 1+ | 61 | 17 | 12 | 17 | 15 | 17.76 (15.12–20.40) | ||
| 2+ | 28 | 3 | 4 | 12 | 9 | 31.04 (23.74–38.33) | ||
| 3+ | 29 | 0 | 5 | 16 | 8 | 28.95 (23.78–34.13) | ||
Grades 0 and 1+, low expression levels; grades 2+ and 3+, high expression levels. P‐values < 0.05 are highlighted in bold. †Linear‐by‐linear association; ‡anova test. iCD10, CD10 expression in immune cells; sCD10, CD10 expression in stromal myofibroblasts; tCD10, CD10 expression in tumor cells.
Figure 3.
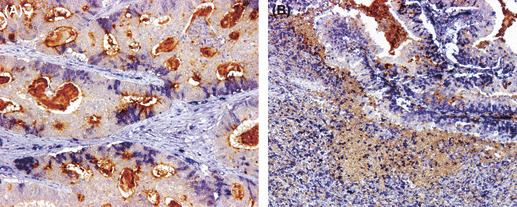
Association between the CD10 expression pattern and transforming growth factor‐β1 (TGF‐β1) expression in colorectal tumor cells. (A) Double‐labeled staining of TGF‐β1 protein (blue) and CD10 protein (brown) in tumor cells (tCD10) showed that TGF‐β1 protein is expressed in the cytoplasm of tumor cells and tCD10 is expressed in the apical membrane of tumor cells (×200). (B) Double‐labeled staining of TGF‐β1 protein in tumor cells (blue) and CD10 protein (brown) in stromal fibroblasts (sCD10) and immune cells (iCD10) (×100 field).
Correlation between CD10 expression patterns and tumor budding using pan‐cytokeratin expression. The association between CD10 expression in tumor stroma including sCD10 and iCD10 and tumor budding is shown in Figure 4(A,B). The correlation between the tumor budding level and expression patterns of CD10, including tCD10 in tumor cells, together with sCD10 and iCD10 in stromal cells, is shown in Table 3. There was a strong association between sCD10 and iCD10 expression in stroma with tumor budding grade (P < 0.001 and P < 0.001, respectively). These results suggested that upregulation of sCD10 and iCD10 expression at the tumor invasion front enhanced the tumor budding grade.
Figure 4.
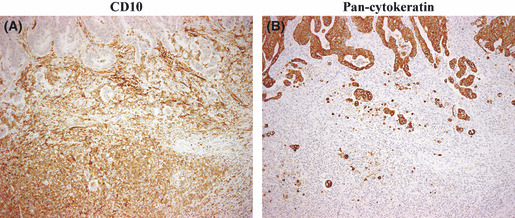
Correlation between CD10+ stromal cells (sCD10+) recruitment and tumor budding at the invasion front in colorectal cancer. (A) High‐level expression of sCD10+ and CD10+ infiltrating immune cells at the tumor invasion front (×100 field). (B) High tumor budding grade was detected by pan‐cytokeratin staining at the same location as (A) (×100 field).
In addition, we examined the correlation between TGF‐β1 expression and tumor budding to show that these factors are closely related (cross‐talk factors). The correlation between TGF‐β1 and tumor budding is given in Table 4, in which high TGF‐β1 expression tumors are correlated with high tumor budding grade (P = 0.002).
Table 4.
Correlation between transforming growth factor‐β1 (TGF‐β1) protein expression and budding status at the tumor invasion fronts in 206 patients with colorectal cancer
| TGF‐β1 expression | Tumor budding grade | P‐value (anova) |
|---|---|---|
| 0 | 15.4 (12.2–18.5) | 0.002 |
| 1+ | 17.7 (14.4–21.0) | |
| 2+ | 23.3 (19.9–26.6) | |
| 3+ | 24.4 (19.9–29.0) |
Grades 0 and 1+, low expression levels; grades 2+ and 3+, high expression levels.
Phenotype of iCD10+ cells. The CD10+ immune cells included two types of cells, polymorphonuclear cells and mononuclear cells, of which the former were the major component (Fig. 5A). The phenotype of iCD10+ cells was overlapped to express CD11b and CD15 (Fig. 5B–D), CD14 and CD163 might be partially positive for CD10+ cells (Fig. 5E,F), and CD3 and CD20 were negative for CD10+ cells (Fig. 5G,H). These results suggested that iCD10+ cells mainly belong to granulocytes of myeloid origin.
Figure 5.
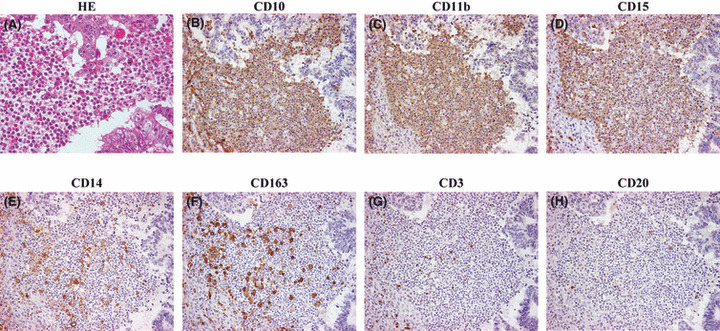
Phenotype of CD10+ infiltrating immune cells (iCD10+). (A) Heterogeneous cell morphology including polymorphonuclear and mononuclear cells by H&E staining (×400 field). (B) CD10 expression in iCD10+ cells (×200 field). Overlapped expression of CD11b (C) and CD15 (D) on iCD10+ cells; CD14 (E) and CD163 (F) were only partially positive on iCD10+ cells; CD3 (G) and CD20 (H) were negative on iCD10+ cells.
Prognostic value of infiltrating neutrophils and granulocytes at invasion front. The infiltration of neutrophils at the invasion front, as detected on H&E stained sections, was not significant in predicting either RFS or OS in stage I–III CRCs (Fig. 6A,B). The Kaplan–Meier analysis of iCD10 criteria are given in Figure 6(C,D). It was suggested that determining the prognostic role of iCD10 is a more valuable criterion than detection of neutrophils by the H&E staining method. Of the 78 cases, which showed high levels of infiltration by neutrophils, 47 were found to have high levels of expression of iCD10. Kaplan–Meier analysis was carried out in the group with high infiltration of neutrophils (Fig. 6E,F). We found that the expression of iCD10 was significant in predicting both RFS and OS in this group of patients (P = 0.004 and P = 0.002, respectively). It was also suggested that the infiltrating neutrophils had two phenotypes. High CD10 expression by infiltrating neutrophils correlated with a poor prognosis. In contrast, infiltrating neutrophils with low CD10 expression were associated with a favorable prognosis in stage I–III CRCs. A case with good prognosis and a high level of infiltration by neutrophils with low CD10 expression is shown in Figure 7.
Figure 6.
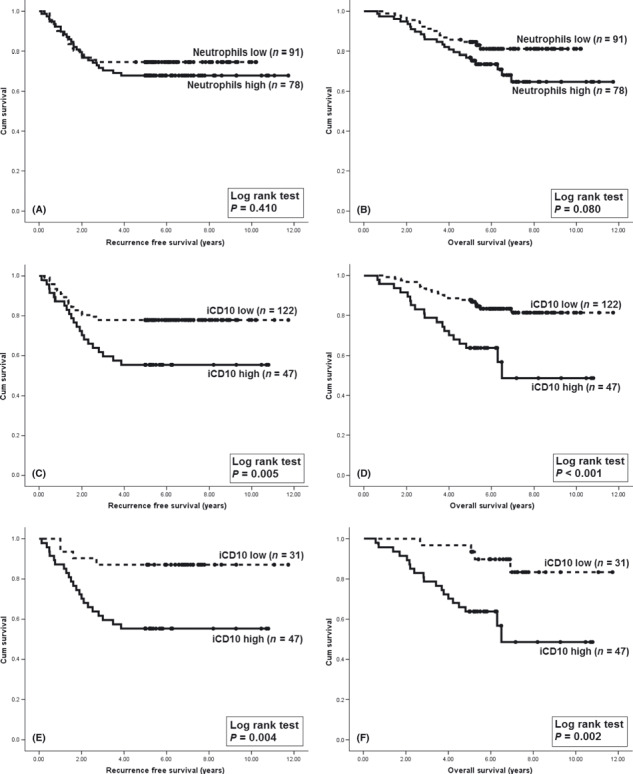
Comparing the Kaplan–Meier analysis using the infiltrating neutrophil score with the CD10 infiltrating immune cells (iCD10) criteria in stage I–III colorectal cancer. (A,B) Kaplan–Meier analysis using infiltrating neutrophil scores on H&E stained sections for recurrence‐free survival (RFS) and overall survival (OS). (C,D) Using iCD10 criteria is more valuable in giving a prognosis compared to traditional H&E staining. (E,F) Kaplan–Meier analysis using iCD10 criteria for RFS and OS in the high neutrophil infiltration group. The infiltrating neutrophils with a high CD10 expressing phenotype were associated with poor prognosis.
Figure 7.
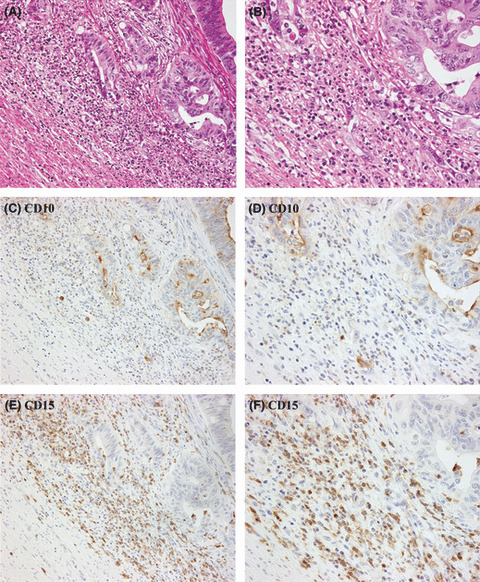
One case of colorectal cancer with high neutrophil infiltration but low expression of CD10 in infiltrating immune cells (iCD10). (A) Infiltration by a high density of immune cells can be seen at the invasion front (H&E staining, ×100 field). (B) Large number of neutrophils can be seen in the area expanded from (A) (H&E staining, ×400 field). (C) Expression of iCD10 is very weak compared to the strong expression of CD10 in tumor cells (CD10 stained section, ×100 field). (D) CD10 staining (×400 field). (E,F) CD15 staining in low and high power fields show infiltration by many granulocytes.
Discussion
This study provides new insights into CD10 expression patterns including tCD10, sCD10, and iCD10. We also observed that iCD10 expression is an independent prognostic factor for RFS and OS in stage I, II, and III CRC. Along with TNM staging factors, we also compared the prognostic role of iCD10 expression with tumor budding grade and TGF‐β1 protein expression. Although these factors have not been accepted for clinical use, they have received attention and been reported in several studies as prognostic factors.( 14 , 16 , 17 , 20 , 21 ) Our results showed the iCD10 criterion to have a superior prognostic value compared to the other factors. Indeed, iCD10, TGF‐β1 protein expression, and tumor budding were all found to be significant predictors of RFS and OS as per univariate analysis. However, in multivariate analysis, iCD10 was more significant than either tumor budding or TGF‐β1 protein expression. Based on current results from Surveillance Epidemiology and End Results of the National Cancer Institute (USA), the TNM system is far from being a completely reliable predictor, as 5–10% of patients with stage I, 15–25% of patients with stage II, and up to 40% of patients with stage III disease show relapse regardless of treatment.( 2 ) Indeed, our data showed that 9.7% of stage I patients, 21.1% of stage II patients, and 44.8% of stage III patients developed disease recurrence after treatment. It is therefore essential to include molecular factors to improve the prognosis of TNM staging. In the present study, the integration of iCD10 criteria into TNM staging increased the prognostic significance of both RFS and OS.
To clarify the iCD10+ cell phenotype, several cell surface markers of leukocytes including CD3, CD11b, CD14, CD15, CD20, and CD163 were examined. The present study showed that iCD10+ cells mainly expressed myeloid lineage markers, which include CD11b and CD15. Based on the current classification of tumor infiltrating leukocytes, CD11b+ and CD15+ cells are major components of neutrophil granulocytes.( 22 ) The prognostic role of infiltrating neutrophils in CRC and other adenocarcinomas remains a matter of controversy.( 24 ) The study of Klintrup et al.,( 23 ) using the same criteria as the present study to detect the infiltration of neutrophils on H&E stained sections, showed that high levels of neutrophil infiltration was associated with a favorable outcome of CRC. In contrast, the study of Nagtegaal et al.,( 25 ) using an elastase antibody to detect neutrophil infiltration, revealed that there was no correlation between either RFS or OS and the infiltration of neutrophils in rectal cancer. Following the method of Klintrup et al.,( 23 ) our results showed that there was also no significant prediction of either RFS or OS by detecting neutrophils on H&E stained sections. It has been reported that CD10 is not expressed by an estimated 25% of mature neutrophils in the peripheral blood of normal donors.( 26 , 27 ) Furthermore, in the study by Hirashima et al., two patient groups could be classified based on their expression of CD10 in neutrophils. Their study reported that the group with low CD10+ neutrophils was associated with a favorable prognosis.( 27 ) These findings suggest that there are two populations of neutrophils that vary according to the expression of CD10, and the roles of CD10+ and CD10− neutrophils are different. In this study, we also found that CD10 expression in infiltrating myeloid cells, mainly neutrophils at the tumor invasion front, was variable. The infiltration of CD10 high expressing neutrophils was associated with a poor prognosis, whereas CD10 low expressing ones seemed to be associated with a good prognosis.
Defined by their CD11b+ and CD15+ phenotype, iCD10+ cells seem to be similar to tumor‐associated neutrophils (TANs).( 28 ) This term is reminiscent of tumor‐associated macrophages (TAMs). It is well established that TAMs are also a heterogeneous population and are typically defined to be of the classically activated M1 macrophage phenotype (antitumor response), or the alternative activated M2 macrophage phenotype (tumor promotion).( 28 ) A paradigm was presented in which resident TANs acquire a protumor phenotype (similar to M2), largely driven by TGF‐β to become “N2” neutrophils. After TGF‐β blockage, neutrophils acquire an antitumor phenotype to become “N1” TANs (similar to M1).( 28 ) Interestingly, we discovered a strong correlation between TGF‐β1 expression in tumor cells and CD10 expression in stromal cells, including sCD10+ and iCD10+ cells. These findings suggest that iCD10+ cells are probably similar to the N2 TAN population which has tumor promoting activity. Interleukin‐8 (IL‐8) is one of the best studied cytokines acting as a neutrophil chemoattractant with respect to tumor biology and is overexpressed in a multitude of different human carcinomas, including CRC.( 29 , 30 ) Indeed, Bellocq et al. showed a positive correlation between levels of IL‐8 in patients with bronchioloalveolar carcinoma and numbers of tumor‐infiltrating neutrophils. This suggests that IL‐8 is a major force in recruiting neutrophils to the tumor site.( 31 ) Moreover, it was reported that TGF‐β1 signaling regulates IL‐8 expression in prostate cancer cells.( 32 ) Thus, we can hypothesize that TGF‐β1 regulates the recruitment of iCD10+ cells through IL‐8 signaling and might be a chemoattractant that enhances the infiltration of iCD10+ neutrophils in CRC.
As neutrophils transmigrate across the endothelium on their way to a tumor, they release proteases that degrade the basement membrane.( 33 ) It is thought that the holes created in the ECM by these extravasating neutrophils are exploited by metastasizing tumor cells.( 33 ) The role of CD10 expression in benign stromal cells has so far been investigated only in breast carcinoma.( 34 , 35 , 36 ) It is postulated that due to structural similarities between CD10, an endo‐metalloprotease, and the MMPs, CD10 could create a microenvironment that facilitates cancer cell invasion and metastasis in breast cancer.( 35 , 36 ) In addition, there is a strong relationship between MMP‐9 expression in budding cells and a more aggressive tumor phenotype.( 37 ) Therefore, tumor budding at invasion fronts might be correlated with matrix degradation. To examine this hypothesis, we also investigated tumor budding in this study. A strong correlation between budding grade and CD10 expression in stroma was identified. Although the tumor budding index is accepted for routine use in predicting high risk cases of CRC, the mechanism associated with tumor budding is still under investigation.( 21 ) In this study, we found that both sCD10 and iCD10 increased the tumor budding grade. We suggest that infiltration of CD10+ stromal cells might be linked to tumor dissemination. This finding supports our results showing that iCD10 expression is an unfavorable outcome factor in CRC.
Taken together, our results show that the expression level of iCD10 is an independent prognostic factor for high risk cases in CRC patients. The recruitment of sCD10+ and iCD10+ cells was strongly induced by TGF‐β1 protein which was secreted by tumor cells and enhanced tumor budding grade at invasion fronts in CRC.
Disclosure Statement
The authors have no conflict of interest.
References
- 1. Jemal A, Siegel R, Xu J, Ward E. Cancer statistics, 2010. CA Cancer J Clin 2010; 60: 277–300. [DOI] [PubMed] [Google Scholar]
- 2. Edge SB, Byrd DR, Compton CC, Fritz AG, Greene FL, Trotti A. AJCC Cancer Staging Manual, 7th edn. New York: Springer, 2010. [Google Scholar]
- 3. Greaves MF, Hariri G, Newman RA, Sutherland DR, Ritter MA, Ritz J. Selective expression of the common acute lymphoblastic leukemia (gp 100) antigen on immature lymphoid cells and their malignant counterparts. Blood 1983; 61: 628–39. [PubMed] [Google Scholar]
- 4. McIntosh GG, Lodge AJ, Watson P et al. NCL‐CD10‐270: a new monoclonal antibody recognizing CD10 in paraffin‐embedded tissue. Am J Pathol 1999; 154: 77–82. [DOI] [PMC free article] [PubMed] [Google Scholar]
- 5. Sato Y, Itoh F, Hinoda Y et al. Expression of CD10/neutral endopeptidase in normal and malignant tissues of the human stomach and colon. J Gastroenterol 1996; 31: 12–7. [DOI] [PubMed] [Google Scholar]
- 6. Yao T, Tsutsumi S, Akaiwa Y et al. Phenotypic expression of colorectal adenocarcinomas with reference to tumor development and biological behavior. Jpn J Cancer Res 2001; 92: 755–61. [DOI] [PMC free article] [PubMed] [Google Scholar]
- 7. Iwase T, Kushima R, Mukaisho K, Mitsufuji S, Okanoue T, Hattori T. Overexpression of CD10 and reduced MUC2 expression correlate with the development and progression of colorectal neoplasms. Pathol Res Pract 2005; 201: 83–91. [DOI] [PubMed] [Google Scholar]
- 8. Fujimoto Y, Nakanishi Y, Sekine S et al. CD10 expression in colorectal carcinoma correlates with liver metastasis. Dis Colon Rectum 2005; 48: 1883–9. [DOI] [PubMed] [Google Scholar]
- 9. Ohji Y, Yao T, Eguchi T et al. Evaluation of risk of liver metastasis in colorectal adenocarcinoma based on the combination of risk factors including CD10 expression: multivariate analysis of clinicopathological and immunohistochemical factors. Oncol Rep 2007; 17: 525–30. [PubMed] [Google Scholar]
- 10. Fujita S, Taniguchi H, Yao T et al. Multi‐institutional study of risk factors of liver metastasis from colorectal cancer: correlation with CD10 expression. Int J Colorectal Dis 2010; 25: 681–6. [DOI] [PubMed] [Google Scholar]
- 11. Ogawa H, Iwaya K, Izumi M et al. Expression of CD10 by stromal cells during colorectal tumor development. Hum Pathol 2002; 33: 806–11. [DOI] [PubMed] [Google Scholar]
- 12. Kuniyasu H, Luo Y, Fujii K et al. CD10 enhances metastasis of colorectal cancer by abrogating the anti‐tumoural effect of methionine‐enkephalin in the liver. Gut 2010; 59: 348–56. [DOI] [PubMed] [Google Scholar]
- 13. Bacman D, Merkel S, Croner R, Papadopoulos T, Brueckl W, Dimmler A. TGF‐beta receptor 2 downregulation in tumour‐associated stroma worsens prognosis and high‐grade tumours show more tumour‐associated macrophages and lower TGF‐beta1 expression in colon carcinoma: a retrospective study. BMC Cancer 2007; 10: 156. [DOI] [PMC free article] [PubMed] [Google Scholar]
- 14. Xu WQ, Jiang XC, Zheng L, Yu YY, Tang JM. Expression of TGF‐beta1, TbetaRII and Smad4 in colorectal carcinoma. Exp Mol Pathol 2007; 82: 284–91. [DOI] [PubMed] [Google Scholar]
- 15. Gulubova M, Manolova I, Ananiev J, Julianov A, Yovchev Y, Peeva K. Role of TGF‐beta1, its receptor TGFbetaRII, and Smad proteins in the progression of colorectal cancer. Int J Colorectal Dis 2010; 25: 591–9. [DOI] [PubMed] [Google Scholar]
- 16. Langenskiöld M, Holmdahl L, Falk P, Angenete E, Ivarsson ML. Increased TGF‐beta 1 protein expression in patients with advanced colorectal cancer. J Surg Oncol 2008; 97: 409–15. [DOI] [PubMed] [Google Scholar]
- 17. Robson H, Anderson E, James RD, Schofield PF. Transforming growth factor beta 1 expression in human colorectal tumours: an independent prognostic marker in a subgroup of poor prognosis patients. Br J Cancer 1996; 74: 753–8. [DOI] [PMC free article] [PubMed] [Google Scholar]
- 18. Flavell RA, Sanjabi S, Wrzesinski SH, Licona‐Limón P. The polarization of immune cells in the tumour environment by TGFbeta. Nat Rev Immunol 2010; 10: 554–67. [DOI] [PMC free article] [PubMed] [Google Scholar]
- 19. McMahon GA, Dignam JD, Gentry LE. Structural characterization of the latent complex between transforming growth factor beta 1 and beta 1‐latency‐associated peptide. Biochem J 1996; 313: 343–51. [DOI] [PMC free article] [PubMed] [Google Scholar]
- 20. Kanazawa H, Mitomi H, Nishiyama Y et al. Tumour budding at invasive margins and outcome in colorectal cancer. Int J Colorectal Dis 2008; 10: 41–7. [DOI] [PubMed] [Google Scholar]
- 21. Prall F, Ostwald C. High‐degree tumor budding and podia‐formation in sporadic colorectal carcinomas with K‐ras gene mutations. Hum Pathol 2007; 38: 1696–702. [DOI] [PubMed] [Google Scholar]
- 22. Joyce JA, Pollard JW. Microenvironmental regulation of metastasis. Nat Rev Cancer 2009; 9: 239–52. [DOI] [PMC free article] [PubMed] [Google Scholar]
- 23. Klintrup K, Mäkinen JM, Kauppila S et al. Inflammation and prognosis in colorectal cancer. Eur J Cancer 2005; 41: 2645–54. [DOI] [PubMed] [Google Scholar]
- 24. Lin EY, Pollard JW. Role of infiltrated leucocytes in tumour growth and spread. Br J Cancer 2004; 90: 2053–8. [DOI] [PMC free article] [PubMed] [Google Scholar]
- 25. Nagtegaal ID, Marijnen CA, Kranenbarg EK et al. Local and distant recurrences in rectal cancer patients are predicted by the nonspecific immune response; specific immune response has only a systemic effect – a histopathological and immunohistochemical study. BMC Cancer 2001; 1: 7. [DOI] [PMC free article] [PubMed] [Google Scholar]
- 26. McCormack RT, Nelson RD, Solem LD, LeBien TW. Decreased expression of the common acute lymphoblastic leukaemia antigen (CALLA/CD10) on neutrophils from patients with thermal injury. Br J Haematol 1988; 69: 189–95. [DOI] [PubMed] [Google Scholar]
- 27. Hirashima M, Higuchi S, Sakamoto K, Nishiyama T, Okada H. The ratio of neutrophils to lymphocytes and the phenotypes of neutrophils in patients with early gastric cancer. J Cancer Res Clin Oncol 1998; 124: 329–34. [DOI] [PubMed] [Google Scholar]
- 28. Fridlender ZG, Sun J, Kim S et al. Polarization of tumor‐associated neutrophil phenotype by TGF‐beta: “N1” versus “N2” TAN. Cancer Cell 2009; 16: 183–94. [DOI] [PMC free article] [PubMed] [Google Scholar]
- 29. Tazzyman S, Lewis CE, Murdoch C. Neutrophils: key mediators of tumour angiogenesis. Int J Exp Pathol 2009; 90: 222–31. [DOI] [PMC free article] [PubMed] [Google Scholar]
- 30. Li A, Varney ML, Singh RK. Expression of interleukin 8 and its receptors in human colon carcinoma cells with different metastatic potentials. Clin Cancer Res 2001; 7: 3298–304. [PubMed] [Google Scholar]
- 31. Bellocq A, Antoine M, Flahault A et al. Neutrophil alveolitis in bronchioloalveolar carcinoma: induction by tumor‐derived interleukin‐8 and relation to clinical outcome. Am J Pathol 1998; 152: 83–92. [PMC free article] [PubMed] [Google Scholar]
- 32. Lu S, Dong Z. Characterization of TGF‐beta‐regulated interleukin‐8 expression in human prostate cancer cells. Prostate 2006; 66: 996–1004. [DOI] [PubMed] [Google Scholar]
- 33. Welch DR, Schissel DJ, Howrey RP, Aeed PA. Tumor‐elicited polymorphonuclear cells, in contrast to “normal” circulating polymorphonuclear cells, stimulate invasive and metastatic potentials of rat mammary adenocarcinoma cells. Proc Natl Acad Sci USA 1989; 86: 5859–63. [DOI] [PMC free article] [PubMed] [Google Scholar]
- 34. Iwaya K, Ogawa H, Izumi M, Kuroda M, Mukai K. Stromal expression of CD10 in invasive breast carcinoma: a new predictor of clinical outcome. Virchows Arch 2002; 440: 589–93. [DOI] [PubMed] [Google Scholar]
- 35. Bilalovic N, Sandstad B, Golouh R, Nesland JM, Selak I, Torlakovic EE. CD10 protein expression in tumor and stromal cells of malignant melanoma is associated with tumor progression. Mod Pathol 2004; 17: 1251–8. [DOI] [PubMed] [Google Scholar]
- 36. Kim HS, Kim GY, Kim YW, Park YK, Song JY, Lim SJ. Stromal CD10 expression and relationship to the E‐cadherin/beta‐catenin complex in breast carcinoma. Histopathology 2010; 56: 708–19. [DOI] [PubMed] [Google Scholar]
- 37. Yu Q, Stamenkovic I. Cell surface‐localized matrix metalloproteinase‐9 proteolytically activates TGF‐beta and promotes tumor invasion and angiogenesis. Genes Dev 2000; 14: 163–76. [PMC free article] [PubMed] [Google Scholar]