

Abstract
Understanding tumor‐specific metabolism under hypoxia is important to find novel targets for antitumor drug design. Here we found that tumor cells expressed higher levels of cytosolic acetyl‐CoA synthetase (ACSS2) under hypoxia than normoxia. Knockdown of ACSS2 by RNA interference (RNAi) in tumor cells enhanced tumor cell death under long‐term hypoxia in vitro. Our data also demonstrated that the ACSS2 suppression slowed tumor growth in vivo. These findings showed that ACSS2 plays a significant role in tumor cell survival under hypoxia and that ACSS2 would be a potential target for tumor treatment. Furthermore, we found that tumor cells excreted acetate and the quantity increased under hypoxia: the pattern of acetate excretion followed the expression pattern of ACSS2. Additionally, the ACSS2 knockdown led to a corresponding reduction in the acetate excretion in tumor cells. These results mean that ACSS2 can conduct the reverse reaction from acetyl‐CoA to acetate in tumor cells, which indicates that ACSS2 is a bi‐directional enzyme in tumor cells and that ACSS2 might play a buffering role in tumor acetyl‐CoA/acetate metabolism. (Cancer Sci 2009; 100: 821–827)
Tumor hypoxic regions have been recognized to be connected with poor outcome during tumor treatment, such as radiotherapy and chemotherapy.( 1 , 2 , 3 , 4 ) In radiotherapy, oxygen enhances the damage to tumor tissue resulting from exposure to ionizing radiation, whereas the lack of oxygen reduces the damage. In the case of chemotherapy, hypoxia‐induced changes in tumor cells make some antitumor drugs ineffective. Therefore, understanding the characteristics of tumor cells under hypoxia is of significant importance to find beneficial targets for tumor treatment.
Metabolic change is one of the important aspects in the elucidation of tumor hypoxia. In a tumor mass, hypoxic regions inevitably occur because blood vessel supply cannot keep up with the high rate of tumor cell proliferation. In order to adapt to such mass environment, tumor cells are considered to have specific metabolic characteristics known as the Warburg effect.( 5 ) This refers to a general metabolic change in tumor cells that causes glycolysis to be used to generate energy in the place of mitochondrial respiration, not only under hypoxia but also normoxia.( 6 , 7 , 8 , 9 , 10 ) However, the metabolic status and related gene expression under hypoxia in tumor cells is not fully understood.
Acetyl‐CoA synthetase (ACSS) (EC 6.2.1.1: adenosine triphosphate [ATP)] + acetate + coenzyme A [CoA]↔ adenosine monophosphate [AMP] + diphosphate + acetyl‐coenzyme A [CoA]) is a well‐conserved universal enzyme from bacteria to humans.( 11 ) It has been reported that the activity of ACSS can be controlled by acetylation on lysine residues and that this regulatory mechanism is also conserved from bacteria to humans.( 12 , 13 ) Mammals have two types of ACSS: mitochondrial ACSS1 and cytosolic ACSS2.( 14 ) The enzyme ACSS is generally perceived to play a role in the incorporation of acetate into acetyl‐CoA, via the forward reaction, which is then used in the synthesis of fatty acids and amino acids, as well as in the tricarboxylic acid (TCA) cycle in vivo.( 14 , 15 , 16 , 17 ) On the other hand, the enzymatic reversibility of ACSS has been reported previously from several sources, such as mammals, yeast, plants, and bacteria.( 18 , 19 , 20 , 21 , 22 ) Moreover, in yeast and a fungus Aspergillus nidulans, it has been demonstrated that the ‘cytosolic’ ACSS can mediate the reverse reaction from acetyl‐CoA to acetate under the conditions of insufficient oxygen supply and would play an important role in their anaerobic survival.( 23 , 24 , 25 , 26 , 27 , 28 ) Based on these facts, we speculated that ACSS expressed in tumor cytosol (ACSS2) might be also important in tumor cell survival under hypoxia.
Here, we found that ACSS2 gene expression increased under hypoxia in tumor cells and that ACSS2 inhibition strengthened tumor cell death under hypoxia in vitro and reduced tumor growth in vivo. In addition, our study revealed that tumor cells showed acetate excretion, especially under hypoxia, which was mediated by ACSS2. Thus, this study demonstrated the significant role of ACSS2 in tumor cell survival under hypoxia and the possible function of ACSS2 in tumor metabolism.
Materials and methods
Cell lines and growth. The following four tumor cell lines were used in this study: LL/2 (LLC; CRL‐1642, American Type Culture Collection, ATCC, Manassas, VA, USA) mouse Lewis lung carcinoma; B16 (RCB1283; Riken Cell Bank, Tsukuba, Japan) mouse melanoma; Colon‐26 (Colon; TKG 0518, Cell Resource Center for Biomedical Research, Tohoku University, Sendai, Japan) mouse colon carcinoma; and C127I (CRL‐1616; ATCC) mouse mammary carcinoma. Tumor cell lines were chosen that had different growth rates and were derived from different tissues (see Supporting Information, Fig. S1). Before experiments, we confirmed metabolic characteristics of high glycolysis and low electron transport activity in mitochondrial respiration under normoxia, in these tumor cell lines used in this study (Figs S2,3). As reference, the mouse fibroblast cell line BALB/3T3 clone A31 (3T3; CCL‐163, ATCC) was used for gene expression analysis and measurement of metabolites. The cells were incubated in a humidified atmosphere of 5% CO2 in air (normoxia) at 37°C. Dulbecco's modified Eagle's medium (Invitrogen, Carlsbad, CA, USA) supplemented with 10% fetal bovine serum and antibiotics was used as the cell growth medium. Exponentially growing cells were used. Hypoxia (1.2% O2, 93.8% N2, 5% CO2) was achieved with a Personal Multi Gas Incubator (Astec, Fukuoka, Japan). The cells were trypsinized to detach them from the plates and were counted by the trypan blue dye‐exclusion method.
Analysis of gene expression. Total RNA was isolated from aliquots of 1–6 × 10⁶ cells with a Micro‐to‐Midi total RNA purification system (Invitrogen). Quantitative reverse transcription – polymerase chain reaction (qRT‐PCR) was performed with Taqman One‐Step RT‐PCR Master Mix reagents and Taqman gene expression assays (Applied Biosystems, Foster City, CA) using an ABI PRISM 7000 sequence detection system (Applied Biosystems). The Taqman PCR assays were carried out in total reaction volumes of 25 µL containing 12.5 µL 2 × Master Mix, 0.625 µL 40 × MultiScribe and RNase inhibitor mix, 1.25 µL 20 × Taqman gene‐expression assay and 0.5 µg purified total RNA as templates. The following Taqman gene‐expression assays were used: acetyl‐CoA hydrolase (ACH), Mm00499641; ACSS1, Mm00475647; ACSS2, Mm00480101; and β‐actin, Mm00607939 (Applied Biosystems). PCR was carried out for 30 min at 48°C and 10 min at 95°C, followed by 40 cycles at 95°C for 15 s and at 60°C for 60 s. Target mRNA was quantified by the comparative CT method using β‐actin expression as the endogenous control.( 29 )
RNA interference (RNAi) experiments. To inhibit ACSS2 expression, tumor cells were transduced with lentiviral particles (Mission lentiviral transduction particles; SHVRS‐NM 019811; Sigma, Poole, UK) carrying expression cassettes encoding single‐hairpin RNAs (shRNAs) that generate small‐interfering RNAs (siRNAs). Non‐targeting shRNA (SHC002V, Sigma) was used as a negative control.( 30 , 31 ) Cells (1.6 × 10⁴) were plated in 100 µL growth medium per well on 96‐well plates and incubated overnight. The medium was then changed to growth medium containing hexadimethrine bromide (Sigma) at a final concentration of 8 µg/mL to enhance the transduction efficiency. Lentiviral particles (5 µL) were added and the plates were incubated overnight. Thereafter, we selected stable transductants expressing the shRNAs with puromycin. Levels of mRNA expression of ACSS2 were examined by qRT‐PCR to check the efficiency of knockdown by RNAi.
Cell survival under hypoxia. The RNAi tumor cells were plated in 24‐well plates at 5 × 10⁵ per well in 1 mL of growth medium, and incubated for 24 h at 37°C under normoxia. In this experiment, we optimized the number of seeding cells to adjust to long‐term hypoxic incubation. After changing the medium, the cells were transferred to hypoxic conditions. Fresh medium preincubated under hypoxic conditions was provided daily. The cells were counted by the trypan blue dye‐exclusion method every 24 h from the time when they were transferred to hypoxia (day 0) for 7 days.
Allografts of RNAi tumor cells. All animal experiments and procedures were conducted in compliance with the Animal Treatment Regulations of the University of Fukui, Japan and these regulations obey domestic and international guidelines and laws. BALB/c Slc‐nu/nµ male nude mice (6 weeks of age) were obtained from Japan SLC (Shizuoka, Japan), and were maintained in a pathogen‐free environment throughout the experiments. Before the experiments, the mice were acclimatized for at least 1 week. RNAi tumor cells suspended in phosphate‐buffered saline (PBS) (at 8 × 10⁶ for Colon and 1 × 10⁷ for the other cell lines) were injected subcutaneously into the flanks of the mice. The tumor size was measured with precision callipers every 3 days over a period of 12 days. The tumor volume was calculated using the method reported by Janik et al.( 32 )
Measurement of metabolites. The cells were plated in 24‐well plates at a density of 5 × 10⁴ in 1 mL growth medium per well and were preincubated for 24 h at 37°C under normoxia. The cells were incubated for a further 24 h in fresh growth medium at 37°C under normoxia or hypoxia. The supernatants were collected to measure metabolite levels, and the cell numbers were counted. Quantification of acetate and lactate was done by enzymatic analysis using an F‐kit (R‐Biopharm AG, Darmstadt, Germany) in accordance with the manufacturer's instructions. The growth medium itself did not contain acetate and lactate.
Statistical analysis. Data are expressed as the means and standard deviations. P‐values were calculated by the two‐sided t‐test. P‐values < 0.05 were considered statistically significant. For cell studies, values from four independent experiments are presented. For the animal studies, the number of animals in each group is indicated by n.
Results
Hypoxia causes increase of cytosolic ACSS2 gene expression levels in tumor cells. We found that the expression of transcripts encoding cytosolic ACSS2 increased under hypoxia in the examined four tumor cell lines (Fig. 1). The expression levels of ACSS2 was 1.8‐, 2.0‐, 3.3‐, and 2.6‐fold higher in LLC, B16, Colon, and C127I tumor cells, respectively, under hypoxia, compared with normoxia. Under normoxia, LLC, B16, Colon, and C127I tumor cells contained 1.5‐, 1.9‐, 2.4‐, and 2.2‐fold more ACSS2 transcripts, respectively, than 3T3 fibroblast cells as 3T3 fibroblast cells did not show significant increase of ACSS2 expression under hypoxia. The expression of mitochondrial ACSS1 and ACH (EC 3.1.2.1; acetyl‐CoA + H2O ↔ CoA + acetate), another relating enzyme to acetyl‐CoA/acetate metabolism, was very low regardless of oxygen conditions (data not shown).
Figure 1.

Gene‐expression profiles of cytosolic acetyl‐CoA synthetase (ACSS2). Levels of messenger RNA (mRNA) for ACSS2 relative to β‐actin as the endogenous control are shown. The values were normalized to ACSS2 expressed in 3T3 non‐tumor fibroblast cells under normoxia. Quantitative reverse transcription – polymerase chain reaction was performed using RNA isolated from cells cultured under normoxia (N, white bar) and hypoxia (H, black bar). ACSS2 expression under normoxia was high in the tumor cells compared with the 3T3 cells (P < 0.01 in LLC, P < 0.001 in B16 and C127I, and P < 0.02 in Colon cells) and increased in tumor cells under hypoxia (P < 0.0001 in LLC and B16, P < 0.001 in Colon, and P < 0.02 in C127I cells) but not in 3T3 cells (P > 0.05).
ACSS2 knockdown by shRNA affects tumor cell survival under hypoxia in vitro. To examine the significance of ACSS2 in tumor cells under hypoxia, we performed cell‐culture studies using ACSS2‐RNAi and control‐RNAi tumor cells established in this study. In the ACSS2‐RNAi tumor cells, the expression of ACSS2 decreased compared with control‐RNAi tumor cells in all the tumor cell lines examined (Fig. 2). It was found that the ACSS2‐RNAi tumor cells exhibited considerably lower survival than the control‐RNAi tumor cells under long‐term hypoxia in vitro (Fig. 3). The number of cells was not significantly different on day 1 after hypoxic treatment. After 2 days of hypoxia, the number of ACSS2‐RNAi tumor cells, but not control‐RNAi tumor cells, decreased dramatically in all the tumor cell lines examined. The ACSS2‐RNAi tumor cells examined were almost dead after 3 days of hypoxia, whereas the control‐RNAi tumor cells survived. Incidentally, ACSS2‐RNAi and control‐RNAi tumor cells showed no significant difference in growth under normoxia (data not shown).
Figure 2.

Suppression of messenger RNA (mRNA) for cytosolic acetyl‐CoA synthetase (ACSS2) by RNA interference (RNAi) in tumor cells. Asterisks indicate statistical significance (*P < 0.01; **P < 0.005; ***P < 0.001). ACSS2 mRNA expressions detected by quantitative reverse transcription – polymerase chain reaction analysis in ACSS2‐RNAi tumor cells (white bar) and control‐RNAi tumor cells (black bar) are shown. These data were expressed as relative values, compared with control‐RNAi tumor cells (%).
Figure 3.

Cytosolic acetyl‐CoA synthetase (ACSS2) promotes tumor cell survival under hypoxia in vitro. Cell survival under long‐term hypoxic incubation in vitro in control‐RNA interference (RNAi) tumor cells (solid line) and ACSS2‐RNAi tumor cells (dotted line). Asterisks indicate statistical significance (*P < 0.01; **P < 0.001).
ACSS2 knockdown inhibits tumor growth in vivo. Next, we investigated the effect of ACSS2 knock down in tumor growth in vivo with the RNAi tumor cells (Fig. 4). The results demonstrated that all the ACSS2‐RNAi tumors grew more slowly than the control‐RNAi tumors. At 12 days after injection, the volumes of the tumors derived from the ACSS2‐RNAi tumor cells were 2.9‐, 5.6‐, 2.9‐, and 4.6‐fold smaller than those from the control‐RNAi tumor cells for LLC, B16, Colon, and C127I cells, respectively.
Figure 4.
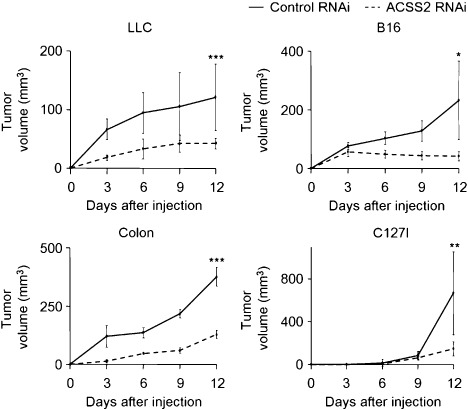
Cytosolic acetyl‐CoA synthetase (ACSS2) enhances tumor growth in vivo. Growth of tumors derived from control‐RNA interference (RNAi) tumor cells (solid line) and ACSS2‐RNAi tumor cells (dotted line) in vivo; LLC, Colon, and C127I (n = 6), and B16 cells (n = 5). Asterisks indicate statistical significance (*P < 0.03; **P < 0.02; ***P < 0.01).
Hypoxia enhances acetate excretion by tumor cells. Figure 5 showed quantification of acetate and lactate released into the culture media from cells. It was found that the pattern of acetate excretion resembled the pattern of ACSS2 expression (Fig. 5a; compare with Fig. 1). That is, the excretion of acetate by tumor cells was increased under hypoxia along with up‐regulation of ACSS2 expression. The values of acetate excretion under hypoxia were 1.3‐fold, 1.9‐, 1.7‐, and 1.6‐fold larger in LLC, B16, Colon, and C127I cells, respectively, than under normoxia. Under normoxia, tumor cells produced larger amounts of acetate than the 3T3 fibroblast cells (Fig. 5a). 3T3 fibroblast cells did not show any increase of acetate excretion under hypoxia. Also, lactate excretion under hypoxia by tumor cells was largely increased 8.1‐fold, 2.7‐, 3.5‐, and 3.7‐fold in LLC, B16, Colon, and C127I cells, respectively, compared with normoxia, while 3T3 fibroblast cells showed only 1.9‐fold increase under hypoxia (Fig. 5b).
Figure 5.

Quantitative analysis of acetate and lactate. Measurements of metabolites released into the culture media of tumor cells (LLC, B16, Colon, and C127I) and non‐tumor fibroblast cells (3T3) under normoxia (N, white bar) and hypoxia (H, black bar) are shown. (a) Amounts of acetate released per 1 × 10⁴ cells. Acetate excretion in tumor cells was higher than in 3T3 cells under normoxia (P < 0.02 in LLC, P < 0.01 in B16, P < 0.005 in Colon, and P < 0.01 in C127I cells). Under hypoxia, acetate excretion increased in B16 (P < 0.01), Colon and C127I (P < 0.005), but not in 3T3 (P > 0.05). (b) The amounts of lactate released per 1 × 10⁴ cells. Lactate excretion under hypoxia increased in all the examined cell lines, compared with normoxia (P < 0.001).
Knockdown of ACSS2 expression by shRNA in tumor cells leads to a corresponding reduction of acetate excretion. To verify the involvement of ACSS2 in tumor acetate production, we quantified acetate release from ACSS2‐RNAi and control‐RNAi tumor cells established in the present study. Acetate excretion was measured in the RNAi cells cultured under normoxia and hypoxia (Fig. 6a,b). There was a reduction of acetate excretion in ACSS2‐RNAi tumor cells, compared with control‐RNAi tumor cells, corresponding to the decrease of ACSS2 expression, under normoxia and hypoxia, respectively (Fig. 6; compare with Fig. 2). This tendency was similar in all the tumor cell lines examined (LLC, B16, Colon, and C127I).
Figure 6.
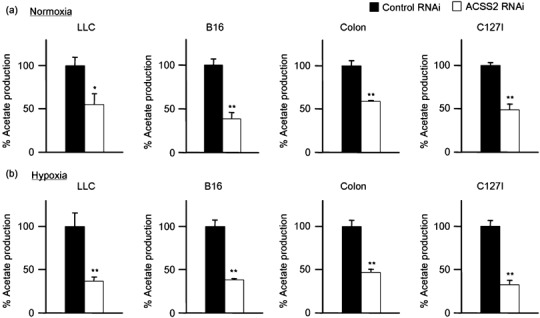
Knockdown of cytosolic acetyl‐CoA synthetase (ACSS2) expression leads to a corresponding reduction of acetate excretion in tumor cells. Reduction of acetate excretion under normoxia (a) and hypoxia (b) in ACSS2‐RNA interference (RNAi) tumor cells (white bar) compared with control‐RNAi tumor cells (black bar). These data were expressed as relative values compared with control RNAi (%). Asterisks indicate statistical significance (*P < 0.005; **P < 0.001).
Discussion
Tumor hypoxia has been known to be an obstacle for traditional tumor treatment, such as radiotherapy and chemotherapy.( 1 , 2 , 3 , 4 ) Hence, understanding of the properties of tumor cells under hypoxia, including specific gene expression and metabolic status, is of significant importance to develop novel antitumor strategies targeting tumor hypoxia. Here we found that gene expression of cytosolic ACSS (ACSS2) in tumor cells was increased under hypoxia compared with normoxia and that ACSS2 knockdown results in shortage of tumor cell survival under long‐term hypoxia in vitro. This means that ACSS2 plays an important role in tumor cell survival under hypoxia and that ACSS2 would be a potential target to discover novel strategies against tumor hypoxia.
In addition, we revealed that ACSS2 knockdown inhibited tumor growth in vivo, which indicates that ACSS2 is also significant in tumor growth. So far, it is shown that tumor hypoxia frequently occurs in tumor mass and the tumor hypoxia is considered to be caused by deficiency in blood vessel supply and shifting during active proliferation of tumor mass.( 33 , 34 , 35 , 36 ) To understand the role of ACSS2 in tumor growth in vivo, further studies on the exact relationships between ACSS2 expression and hypoxic regions shifting within tumors would be necessary.
The present study revealed that tumor cells excreted acetate and the quantity was increased under hypoxia, compared with normoxia, that is, the pattern of acetate excretion followed the pattern of ACSS2 expression. Also, the ACSS2 knockdown in tumor cells led to a corresponding reduction of the acetate excretion by tumor cells. These evidences indicate that ACSS2 is responsible for the acetate production via the reverse reaction in tumor cells; namely, ACSS2 could be a bi‐directional enzyme in tumor cells (Fig. S4).
So far, it is generally accepted that ACSS mediates the forward reaction to incorporate acetate into acetyl‐CoA.( 14 , 15 , 16 , 17 ) On the other hand, under anaerobic conditions or respiratory deficiency, it is known that cytosolic ACSS expressed in yeast and fungus Aspergillus nidulans displays considerably higher affinity to acetyl‐CoA than acetate and mediates reverse reaction leading to acetate production.( 23 , 24 , 25 , 26 , 27 , 28 ) This suggested that the reverse reaction of cytosolic ACSS plays a role in reducing intracellular acetyl‐CoA concentration and generating ATP to survive under anaerobic conditions in these organisms.
There was a similarity between these anaerobic organisms and tumor cells: they produced acetate under insufficient oxygen supply by the mediation of cytosolic ACSS. However, ATP generation by ACSS2 reaction might not be so substantial in tumor cells, since the amount of acetate production was small compared with that of lactate production: the ratios of lactate production to acetate production were 23.6 in LLC, 13.4 in B16, 15.9 in Colon, and 12.2 in C127I, respectively, under hypoxia (Fig. 5a,b).
Meanwhile, acetyl‐CoA metabolism by ACSS2 might be important in tumor cells, because acetyl‐CoA is known to be a key metabolite in lipid synthesis of tumor cytosol. Generally, in non‐tumor cells under normoxia, acetyl‐CoA produced from pyruvate enters the TCA cycle: this reaction is mediated by pyruvate dehydrogenase (PDH). Under respiratory deficiency or hypoxia, the glycolytic flow increases and the TCA cycle slows, which leads to increased acetyl‐CoA levels in mitochondria. In response, the excess of acetyl‐CoA leads to suppression of PDH. In the case of tumor cells, it is also reported that, under hypoxia, hypoxia‐inducible factor 1 (HIF‐1) induces the expression of pyruvate kinase 1 (PDK1), which is known as an suppressor of PDH.( 37 , 38 ) However, other observations revealed that, in tumor cells, respiration deficiency or hypoxia causes activation of protein kinase B (Akt) resulting in up‐regulation of glycolysis‐related enzymes and ATP citrate lyase (ACL), which produces cytosolic acetyl‐CoA pool as a component of lipid synthesis and plays an important role in tumor cell survival (Fig. S4).( 39 , 40 , 41 , 42 , 43 , 44 , 45 , 46 ) According to these studies related to ACL, the enzyme ACL can convert citrate transported from mitochondria into acetyl‐CoA in cytosol and the citrate is provided through a truncated TCA cycle via continued acetyl‐CoA production by PDH. Together with these studies and our present study, it may be suggested that tumor cells possess a certain size of acetyl‐CoA pool in cytosol and that ACSS2 might play a buffering role in acetyl‐CoA/acetate metabolism as a basis of lipid synthesis in cytosol of tumor cells (Fig. S4). To understand the exact role of tumor ACSS2 metabolism, further detailed analysis of the related metabolites such as acetyl‐CoA and lipids would be necessary.
Finally, this study showed that cytosolic ACSS2 plays an important role in tumor cell survival under hypoxia. This insight should help to clarify the behavior of tumors and provide a novel basis for metabolic targeting against tumor hypoxia.
Supporting information
Fig. S1. Cell growth. Cell numbers are shown every 24 h during the growth of tumor cells (LLC, B16, Colon, and C127I) and non‐tumor fibroblast cells (3T3).
Fig. S2. 3H‐deoxyglucose (DG) uptake. Data are shown as 3H‐DG uptake per h per 104 cells in tumor cells (LLC, B16, Colon, and C127I) and non‐tumor fibroblast cells (3T3) under normoxia. The tumor cells took up 3H‐DG 1.9‐fold to 2.3‐fold faster than the 3T3 cells (P < 0.001).
Fig. S3. Mitochondrial electron transport activity, assayed by reduction of Alamar Blue dye. Data represent percentages of reduced Alamar Blue dye in tumor cells (LLC, B16, Colon, and C127I) and non‐tumor fibroblast cells (3T3) under normoxia. The tumor cells reduced Alamar Blue dye less efficiently than the 3T3 cells (P < 0.001).
Fig. S4. Diagram illustrating proposed tumor metabolic pathway in this study. Glycolysis is a universal metabolic pathway by which glucose is broken down to pyruvate (blue line). Pyruvate is changed to acetyl‐CoA, which is transfered into mitochondria, by the mediation of pyruvate dehydrogenase (PDH) (orange line) or converted to lactate in the cytosol by lactate fermentation (pink line). Mitochondrial citrate provided by truncated tricarboxylic acid cycle in tumor cells is exported to the cytosol and changed to acetyl‐CoA for lipid synthesis via adenosine triphosphate (ATP) citrate lyase (ACL) (green line).(1–7) Cytosolic acetyl‐CoA synthetase (ACSS2) mediates interconversion between acetyl‐CoA and acetate to keep metabolic balances in tumor cells (red line). Respiration deficiency or hypoxia causes activation of glycolysis‐related enzymes, ACL, and ACSS2 (For details, see main text).
Supporting text
Cell growth
Cells (3 × 10⁴) were seeded in 1 mL growth medium in 24‐well plates. The numbers of cells were counted every 24 h for 3 days.
3H‐deoxyglucose (DG) uptake
Cells (1 × 10⁵) were seeded in 24‐well plates in growth medium and incubated for 24 h. The medium was then changed to 500 µL of fresh growth medium containing 74 kBq of 3H‐DG (GE Healthcare, Pollards, UK). 3H‐DG uptake is an indicator of glucose utilization.( 8 ) After 1 h of incubation, the cells were washed twice with ice‐cold phosphate‐buffered saline (PBS) and lyzed in 500 µL of 0.2 N NaOH at room temperature for 2 h, then the lysates were mixed with aqueous counting scintillant (ACS)II (GE Healthcare). Radioactivity was measured with a liquid scintillation counter (LSC5100, Aloka, Tokyo, Japan). The number of cells treated in the same way before cell lysis was also counted.
Alamar Blue assay
The Alamar Blue dye (Serotec, Sapporo, Japan) was used to estimate the mitochondrial oxidation–reduction potential of electron transport. Cells (1 × 10⁵) were incubated for 4 h at 37°C in 1 mL serum‐free RPMI‐1640 medium (Invitrogen, Carlsbad, CA, USA) containing 10% Alamar Blue dye. Medium alone was prepared in the same manner and used as a blank. The absorbances at 570 and 600 nm were used to calculate the percentages of reduced Alamar Blue dye.
References
1 Yoshimoto M, Waki A, Yonekura Y et al. Characterization of acetate metabolism in tumor cells in relation to cell proliferation: acetate metabolism in tumor cells. Nucl Medical Biol 2001; 28: 117–22.
2 Hatzivassiliou G, Zhao F, Bauer DE et al. ATP citrate lyase inhibition can suppress tumor cell growth. Cancer Cell 2005; 8: 311–21.
3 Bui T, Thompson CB. Cancer’s sweet tooth. Cancer Cell 2006; 9: 419–20.
4 Bauer DE, Hatzivassiliou G, Zhao F et al. ATP citrate lyase is an important component of cell growth and transformation. Oncogene 2005; 24: 6314–22.
5 Young CD, Anderson SM. Sugar and fat – that’s where it’s at: metabolic changes in tumors. Breast Cancer Res 2008; 10: 202.
6 Pelicano H, Xu RH, Du M et al. Mitochondrial respiration defects in cancer cells cause activation of Akt survival pathway through a redox‐mediated mechanism. J Cell Biol 2006; 175: 913–23.
7 Berwick DC, Hers I, Heesom KJ et al. The identification of ATP‐citrate lyase as a protein kinase B (Akt) substrate in primary adipocytes. J Biol Chem 2002; 277: 33895–900.
8 Sokoloff L, Reivich M, Kennedy C et al. The [14C]deoxyglucose method for the measurement of local cerebral glucose utilization: theory, procedure, and normal values in the conscious and anesthetized albino rat. J Neurochem 1977; 28: 897–916.
Please note: Wiley‐Blackwell are not responsible for the content or functionality of any supporting materials supplied by the authors. Any queries (other than missing material) should be directed to the corresponding author for the article.
Supporting info item
Supporting info item
Supporting info item
Supporting info item
Acknowledgments
This work was supported by Grants‐in‐Aid for Young Scientists (B) from the Japan Society for the Promotion of Science (JSPS), Japan, in part by the 21st Century Centers of Excellence (COE) program from the JSPS, the Leading Project from the Ministry of Education, Culture, Sports, Science and Technology, Japan, CREATE from the Japan Science and Technology Agency, Japan, and a Grant‐in‐Aid for Tumor Research from the Ministry of Health, Labour and Welfare, Japan. We thank members of our laboratory for helpful discussions, and H. Takagi, Y. Kishimoto, and H. Maeda for technical help.
References
- 1. Brizel DM, Scully SP, Harrelson JM et al . Tumor oxygenation predicts for the likelihood of distant metastases in human soft tissue sarcoma. Cancer Res 1996; 56: 941–3. [PubMed] [Google Scholar]
- 2. Brown JM. The hypoxic cell: a target for selective cancer therapy – eighteenth Bruce F. Cain Memorial Award lecture. Cancer Res 1999; 59: 5863–70. [PubMed] [Google Scholar]
- 3. Hockel M, Schlenger K, Aral B et al . Association between tumor hypoxia and malignant progression in advanced cancer of the uterine cervix. Cancer Res 1996; 56: 4509–15. [PubMed] [Google Scholar]
- 4. Pitson G, Fyles A, Milosevic M et al . Tumor size and oxygenation are independent predictors of nodal diseases in patients with cervix cancer. Int J Rad Onco Biol Phys 2001; 51: 699–703. [DOI] [PubMed] [Google Scholar]
- 5. Dang CV, Semenza GL. Oncogenic alterations of metabolism. Trends Biochem Sci 1999; 24: 68–72. [DOI] [PubMed] [Google Scholar]
- 6. Gambhir SS. Molecular imaging of cancer with positron emission tomography. Nat Rev Cancer 2002; 2: 683–93. [DOI] [PubMed] [Google Scholar]
- 7. Warburg O. On respiratory impairment in cancer cells. Science 1956; 124: 269–70. [PubMed] [Google Scholar]
- 8. Warburg O, Posener K, Negelein E. Uber den Stoffwechsel der Carcinomzelle. Biochem Z 1924; 152: 309–44. [Google Scholar]
- 9. Clavo AC, Brown RS, Wahl RL. Fluorodeoxyglucose uptake in human cancer cell lines is increased by hypoxia. J Nucl Med 1995; 36: 1625–32. [PubMed] [Google Scholar]
- 10. Shaw RJ. Glucose metabolism and cancer. Curr Opin Cell Biol 2006; 18: 598–608. [DOI] [PubMed] [Google Scholar]
- 11. Karan D, David JR, Capy P. Molecular evolution of the AMP‐forming acetyl‐CoA synthetase. Gene 2001; 265: 95–101. [DOI] [PubMed] [Google Scholar]
- 12. Starai VJ, Celic I, Cole RN et al . Sir2‐dependent activation of acetyl‐CoA synthetase by deacetylation of active lysine. Science 2002; 298: 2390–2. [DOI] [PubMed] [Google Scholar]
- 13. Schwer B, Bunkenborg J, Verdin RO et al . Reversible lysine acetylation controls the activity of the mitochondrial enzyme acetyl‐CoA synthetase 2. Proc Natl Acad Sci USA 2006; 103: 10224–9. [DOI] [PMC free article] [PubMed] [Google Scholar]
- 14. Fujino T, Kondo J, Ishikawa M et al . Acetyl‐CoA synthetase 2, a mitochondrial matrix enzyme involved in the oxidation of acetate. J Biol Chem 2001; 276: 11420–6. [DOI] [PubMed] [Google Scholar]
- 15. Howard BV, Howard WJ, Bailey JM. Acetyl coenzyme A synthetase and the regulation of lipid synthesis from acetate in cultured cells. J Biol Chem 1974; 249: 7912–21. [PubMed] [Google Scholar]
- 16. Sone H, Shimano H, Sakakura Y et al . Acetyl‐coenzyme A synthetase is a lipogenic enzyme controlled by SREBP‐1 and energy status. Am J Physiol Endocrinol Metab 2002; 282: E222–30. [DOI] [PubMed] [Google Scholar]
- 17. Luong A, Hannah VC, Brown MS et al . Molecular characterization of human acetyl‐CoA synthetase, an enzyme regulated by sterol regulatory element‐binding proteins. J Biol Chem 2000; 275: 26458–66. [DOI] [PubMed] [Google Scholar]
- 18. Beinert H, Green DE, Hele P et al . The acetate activating enzyme system of heart muscle. J Biol Chem 1953; 203: 35–45. [PubMed] [Google Scholar]
- 19. Jones ME, Black S, Flynn RM et al . Acetyl coenzyme a synthesis through pyrophosphoryl split of adenosine triphosphate. Biochim Biophys Acta 1953; 12: 141–9. [DOI] [PubMed] [Google Scholar]
- 20. Barak R, Prasad K, Shainskaya A et al . Acetylation of the chemotaxis response regulator CheY by acetyl‐CoA synthetase purified from Escherichia coli . J Mol Biol 2004; 342: 383–401. [DOI] [PubMed] [Google Scholar]
- 21. Hiatt AJ, Evans HJ. Influence of certain cations on activity of acetic thiokinase from spinach leaves. Plant Physiol 1960; 35: 673–7. [DOI] [PMC free article] [PubMed] [Google Scholar]
- 22. Frenkel EP, Kitchens RL. Purification and properties of acetyl coenzyme A synthetase from bakers’ yeast. J Biol Chem 1977; 252: 504–7. [PubMed] [Google Scholar]
- 23. Duntze W, Neumann D, Gancedo JM et al . Studies on the regulation and localization of the glyoxylate cycle enzymes in Saccharomyces cerevisiae . Eur J Biochem 1969; 10: 83–9. [DOI] [PubMed] [Google Scholar]
- 24. Klein HP, Jahnke L. Variations in the localization of acetyl‐coenzyme A synthetase in aerobic yeast cells. J Bacteriol 1971; 106: 596–602. [DOI] [PMC free article] [PubMed] [Google Scholar]
- 25. Klein HP, Jahnke L. Effects of aeration on formation and localization of the acetyl coenzyme A synthetases of Saccharomyces cerevisiae . J Bacteriol 1979; 137: 179–84. [DOI] [PMC free article] [PubMed] [Google Scholar]
- 26. Polakis ES, Bartley W. Changes in the enzyme activities of Saccharomyces cerevisiae during aerobic growth on different carbon sources. Biochem J 1965; 97: 284–97. [DOI] [PMC free article] [PubMed] [Google Scholar]
- 27. Rogers PJ, Stewart PR. Respiratory development in Saccharomyces cerevisiae grown at controlled oxygen tension. J Bacteriol 1973; 115: 88–97. [DOI] [PMC free article] [PubMed] [Google Scholar]
- 28. Takasaki K, Shoun H, Yamaguchi M et al . Fungal ammonia fermentation, a novel metabolic mechanism that couples the dissimilatory and assimilatory pathways of both nitrate and ethanol. Role of acetyl CoA synthetase in anaerobic ATP synthesis. J Biol Chem 2004; 279: 12414–20. [DOI] [PubMed] [Google Scholar]
- 29. Livak KJ, Schmittgen TD. Analysis of relative gene expression data using real‐time quantitative PCR and the 2−ΔΔCT Method. Methods 2001; 25: 402–8. [DOI] [PubMed] [Google Scholar]
- 30. Scholl C, Bansal D, Dohner K et al . The homeobox gene CDX2 is aberrantly expressed in most cases of acute myeloid leukemia and promotes leukemogenesis. J Clin Invest 2007; 117: 1037–48. [DOI] [PMC free article] [PubMed] [Google Scholar]
- 31. Patel JH, McMahon SB. BCL2 is a downstream effector of MIZ‐1 essential for blocking c‐MYC‐induced apoptosis. J Biol Chem 2007; 282: 5–13. [DOI] [PubMed] [Google Scholar]
- 32. Janik P, Briand P, Hartmann NR. The effect of estrone‐progesterone treatment on cell proliferation kinetics of hormone‐dependent GR mouse mammary tumors. Cancer Res 1975; 35: 3698–704. [PubMed] [Google Scholar]
- 33. Brizel DM, Rosner GL, Harrelson J et al . Pretreatment oxygenation profiles of human soft tissue sarcomas. Int J Rad Onco Biol Phys 1994; 30: 635–42. [DOI] [PubMed] [Google Scholar]
- 34. Brizel DM, Sibley GS, Prosnitz LR et al . Tumor hypoxia adversely affects the prognosis of carcinoma of the head and neck. Int J Rad Onco Biol Phys 1997; 38: 285–9. [DOI] [PubMed] [Google Scholar]
- 35. Hockel M, Schlenger K, Knoop C et al . Oxygenation of carcinomas of the uterine cervix: evaluation by computerized O2 tension measurements. Cancer Res 1991; 51: 6098–102. [PubMed] [Google Scholar]
- 36. Vaupel P, Schlenger K, Knoop C et al . Oxygenation of human tumors: evaluation of tissue oxygen distribution in breast cancers by computerized O2 tension measurements. Cancer Res 1991; 51: 3316–22. [PubMed] [Google Scholar]
- 37. Kim JW, Tchernyshyov I, Semenza GL et al . HIF‐1‐mediated expression of pyruvate dehydrogenase kinase: a metabolic switch required for cellular adaptation to hypoxia. Cell Metab 2006; 3: 177–85. [DOI] [PubMed] [Google Scholar]
- 38. Papandreou I, Cairns RA, Fontana L et al . HIF‐, 1 mediates adaptation to hypoxia by actively downregulating mitochondrial oxygen consumption. Cell Metab 2006; 3: 187–97. [DOI] [PubMed] [Google Scholar]
- 39. Yoshimoto M, Waki A, Yonekura Y et al . Characterization of acetate metabolism in tumor cells in relation to cell proliferation: acetate metabolism in tumor cells. Nucl Med Biol 2001; 28: 117–22. [DOI] [PubMed] [Google Scholar]
- 40. Hatzivassiliou G, Zhao F, Bauer DE et al . ATP citrate lyase inhibition can suppress tumor cell growth. Cancer Cell 2005; 8: 311–21. [DOI] [PubMed] [Google Scholar]
- 41. Bui T, Thompson CB. Cancer's sweet tooth. Cancer Cell 2006; 9: 419–20. [DOI] [PubMed] [Google Scholar]
- 42. Bauer DE, Hatzivassiliou G, Zhao F et al . ATP citrate lyase is an important component of cell growth and transformation. Oncogene 2005; 24: 6314–22. [DOI] [PubMed] [Google Scholar]
- 43. Young CD, Anderson SM. Sugar and fat – that's where it's at: metabolic changes in tumors. Breast Cancer Res 2008; 10: 202. [DOI] [PMC free article] [PubMed] [Google Scholar]
- 44. Pelicano H, Du Xu RH, M et al . Mitochondrial respiration defects in cancer cells cause activation of Akt survival pathway through a redox‐mediated mechanism. J Cell Biol 2006; 175: 913–23. [DOI] [PMC free article] [PubMed] [Google Scholar]
- 45. Berwick DC, Hers I, Heesom KJ et al . The identification of ATP‐citrate lyase as a protein kinase B (Akt) substrate in primary adipocytes. J Biol Chem 2002; 277: 33895–900. [DOI] [PubMed] [Google Scholar]
- 46. Furuta E, Pai SK, Zhan R et al . Fatty acid synthase gene is up‐regulated by hypoxia via activation of Akt and sterol regulatory element binding protein‐1. Cancer Res 2008; 68: 1003–11. [DOI] [PubMed] [Google Scholar]
Associated Data
This section collects any data citations, data availability statements, or supplementary materials included in this article.
Supplementary Materials
Fig. S1. Cell growth. Cell numbers are shown every 24 h during the growth of tumor cells (LLC, B16, Colon, and C127I) and non‐tumor fibroblast cells (3T3).
Fig. S2. 3H‐deoxyglucose (DG) uptake. Data are shown as 3H‐DG uptake per h per 104 cells in tumor cells (LLC, B16, Colon, and C127I) and non‐tumor fibroblast cells (3T3) under normoxia. The tumor cells took up 3H‐DG 1.9‐fold to 2.3‐fold faster than the 3T3 cells (P < 0.001).
Fig. S3. Mitochondrial electron transport activity, assayed by reduction of Alamar Blue dye. Data represent percentages of reduced Alamar Blue dye in tumor cells (LLC, B16, Colon, and C127I) and non‐tumor fibroblast cells (3T3) under normoxia. The tumor cells reduced Alamar Blue dye less efficiently than the 3T3 cells (P < 0.001).
Fig. S4. Diagram illustrating proposed tumor metabolic pathway in this study. Glycolysis is a universal metabolic pathway by which glucose is broken down to pyruvate (blue line). Pyruvate is changed to acetyl‐CoA, which is transfered into mitochondria, by the mediation of pyruvate dehydrogenase (PDH) (orange line) or converted to lactate in the cytosol by lactate fermentation (pink line). Mitochondrial citrate provided by truncated tricarboxylic acid cycle in tumor cells is exported to the cytosol and changed to acetyl‐CoA for lipid synthesis via adenosine triphosphate (ATP) citrate lyase (ACL) (green line).(1–7) Cytosolic acetyl‐CoA synthetase (ACSS2) mediates interconversion between acetyl‐CoA and acetate to keep metabolic balances in tumor cells (red line). Respiration deficiency or hypoxia causes activation of glycolysis‐related enzymes, ACL, and ACSS2 (For details, see main text).
Supporting text
Cell growth
Cells (3 × 10⁴) were seeded in 1 mL growth medium in 24‐well plates. The numbers of cells were counted every 24 h for 3 days.
3H‐deoxyglucose (DG) uptake
Cells (1 × 10⁵) were seeded in 24‐well plates in growth medium and incubated for 24 h. The medium was then changed to 500 µL of fresh growth medium containing 74 kBq of 3H‐DG (GE Healthcare, Pollards, UK). 3H‐DG uptake is an indicator of glucose utilization.( 8 ) After 1 h of incubation, the cells were washed twice with ice‐cold phosphate‐buffered saline (PBS) and lyzed in 500 µL of 0.2 N NaOH at room temperature for 2 h, then the lysates were mixed with aqueous counting scintillant (ACS)II (GE Healthcare). Radioactivity was measured with a liquid scintillation counter (LSC5100, Aloka, Tokyo, Japan). The number of cells treated in the same way before cell lysis was also counted.
Alamar Blue assay
The Alamar Blue dye (Serotec, Sapporo, Japan) was used to estimate the mitochondrial oxidation–reduction potential of electron transport. Cells (1 × 10⁵) were incubated for 4 h at 37°C in 1 mL serum‐free RPMI‐1640 medium (Invitrogen, Carlsbad, CA, USA) containing 10% Alamar Blue dye. Medium alone was prepared in the same manner and used as a blank. The absorbances at 570 and 600 nm were used to calculate the percentages of reduced Alamar Blue dye.
References
1 Yoshimoto M, Waki A, Yonekura Y et al. Characterization of acetate metabolism in tumor cells in relation to cell proliferation: acetate metabolism in tumor cells. Nucl Medical Biol 2001; 28: 117–22.
2 Hatzivassiliou G, Zhao F, Bauer DE et al. ATP citrate lyase inhibition can suppress tumor cell growth. Cancer Cell 2005; 8: 311–21.
3 Bui T, Thompson CB. Cancer’s sweet tooth. Cancer Cell 2006; 9: 419–20.
4 Bauer DE, Hatzivassiliou G, Zhao F et al. ATP citrate lyase is an important component of cell growth and transformation. Oncogene 2005; 24: 6314–22.
5 Young CD, Anderson SM. Sugar and fat – that’s where it’s at: metabolic changes in tumors. Breast Cancer Res 2008; 10: 202.
6 Pelicano H, Xu RH, Du M et al. Mitochondrial respiration defects in cancer cells cause activation of Akt survival pathway through a redox‐mediated mechanism. J Cell Biol 2006; 175: 913–23.
7 Berwick DC, Hers I, Heesom KJ et al. The identification of ATP‐citrate lyase as a protein kinase B (Akt) substrate in primary adipocytes. J Biol Chem 2002; 277: 33895–900.
8 Sokoloff L, Reivich M, Kennedy C et al. The [14C]deoxyglucose method for the measurement of local cerebral glucose utilization: theory, procedure, and normal values in the conscious and anesthetized albino rat. J Neurochem 1977; 28: 897–916.
Please note: Wiley‐Blackwell are not responsible for the content or functionality of any supporting materials supplied by the authors. Any queries (other than missing material) should be directed to the corresponding author for the article.
Supporting info item
Supporting info item
Supporting info item
Supporting info item