

Abstract
Protein adducts are useful biomarkers for assessing exposure, metabolism and risk of carcinogens. Aflatoxin B1–albumin adducts (AAA) and protein carbonyl content (PCC) have long been used for assessing aflatoxin exposure and oxidative stress to proteins, and the quantitative data are almost exclusively expressed per mg protein. Given the large variation in protein concentrations in plasma among populations, this may not be the most appropriate method. The objective was to test the hypothesis that AAA and PCC should be expressed per mL plasma in population studies. AAA and PCC were analyzed among 402 subjects from three regions of China with a gradient in hepatocellular carcinoma (HCC) mortality ranging from 21 to 97 per 100 000. When biomarker values were expressed per mL plasma, the AAA level was significantly associated with plasma PCC (r = 0.262, P < 0.001), and adjusted levels of AAA and PCC paralleled HCC mortalities in the three regions, suggesting a role for aflatoxin‐related oxidative stress in hepatocarcinogenesis in this population. In addition, there were statistically significant associations between both protein biomarkers, expressed per mL plasma, and the levels of alanine aminotransferase and aspartate aminotransferase in hepatitis B virus‐infected subjects, suggesting roles for aflatoxin exposure, oxidative stress and hepatitis B virus infection in the development of HCC. The present data suggest that interindividual variation in plasma protein concentration may influence the dosimetry and relevant interpretation of protein biomarkers. (Cancer Sci 2007; 98: 140–146)
Abbreviations:
- AAA
AFB1–albumin adduct
- AFB1
aflatoxin B1
- ALB
albumin
- ALT
alanine aminotransferase
- AST
aspartate aminotransferase
- BSA
body surface area
- DNP
dinitrophenylhydrazine
- ELISA
enzyme‐linked immunosorbent assay
- HBV
hepatitis B virus
- HCC
hepatocellular carcinoma
- HCV
hepatitis C virus
- HDV
hepatitis D virus
- HEV
hepatitis E virus
- HGV
hepatitis G virus
- PCC
protein carbonyl content
- ROS
reactive oxygen species
- TP
total protein.
Environmentalchemicals are possible etiological agents for a number of human cancers,( 1 ) and the development of quantitative risk assessment methodologies has emphasized the need for chemical‐specific biomarkers as molecular dosimeters of individual exposure.( 2 ) The adducts formed by the covalent binding of genotoxic chemicals with proteins are useful biomarkers for assessing exposure, metabolism and risk in molecular epidemiology.( 3 ) Unlike DNA adducts, protein adducts are not repaired. Therefore, protein adducts form a stable repository of accumulated exposure to carcinogens over the lifetime of the protein.( 4 ) The levels of stable protein adducts can be used to evaluate exposure if the dose–response relationship is known.( 3 ) Further, formation of biomarkers of carcinogenesis may be important biological events that take place between exposure to external or endogenous carcinogens and the subsequent development of cancer.( 4 ) Thus, protein adducts in blood may serve as useful surrogates for those in the target organ in animal or human population studies.( 5 )
The 40 years of investigation of aflatoxin exposures probably provides one of the most extensive data sets in molecular epidemiology.( 6 ) Aflatoxins are highly carcinogenic agents, and the role of exposure to AFB1 in the development of HCC has long been documented in animal and human studies.( 7 ) AFB1 is metabolized by constitutive cellular enzymes, during which there is formation of free radicals.( 8 ) The process results in both lipid peroxidation and covalent adducts with DNA and proteins.( 7 ) Among the various products formed during AFB1 biotransformation, AAA are of great value for assessing exposure at the individual level over a period of weeks or months because of the relatively long half‐life of albumin (∼20 days) in humans.( 9 )
ROS are potential carcinogens because of their roles in mutagenesis, tumor promotion and progression.( 10 ) ROS and oxidative damage have been shown to contribute to the genotoxicity of AFB1.( 7 ) Oxidative damage to proteins may be a critical pathological event because enzyme inactivation can have rapid effects, by nature of their catalytic functions.( 11 ) PCC (aldehyde or ketone) is a widely used marker for the presence of oxidative stress in physiological and pathological conditions.( 12 ) However, thus far, there are no reports on the association between aflatoxin exposure and oxidative stress in terms of PCC in either human or animal studies.
It is presumed that after an environmental exposure each person is unique in both dose–response and time to disease onset, and these responses will be affected by both intrinsic and extrinsic modifiers.( 6 ) AAA and PCC are almost exclusively expressed per mg albumin or protein. However, given the large interindividual variation in protein concentration in plasma,( 13 ) this may not be the most appropriate method. In a multicenter collaborative study we found that correction of AAA and PCC for protein concentration resulted in a different interpretation of a data set of these biomarkers in a Chinese population at high risk for HCC, suggesting that AAA and PCC data should be expressed per volume plasma in population studies.
Materials and Methods
Samples collection. Study subjects came from Guangxi Zhuang Autonomous Region, a region of elevated HCC risk and AFB1 contamination,( 14 , 15 ) and Chengdu City, Sichuan Province, a region with a relatively low incidence of HCC. Details on recruitment have been described elsewhere.( 15 ) In brief, a total of 404 subjects (270 men and 135 women, aged 29.3 ± 14.4 years) were recruited from three regions of China. The local cancer registry revealed a gradient in HCC mortality for men in these regions (Fusui 92–97/100 000, Nanning 32–47/100 000 and Chengdu 21/100 000, respectively).( 15 ) Samples were collected from all subjects in the morning before daily work, in turn from Chengdu, Nanning and Fusui during April to June. Subjects were screened for hepatitis virus (HBV, HCV, HDV, HEV and HGV) infections, and liver biochemistry (ALT, AST, ALB and plasma TP) was quantified for all subjects as described previously.( 15 ) All liver biochemistry was determined on a Beckman LX20 Chemistry Analyzer (Beckman Coulter, Brea, CA, USA) in the same laboratory. Hepatitis virus infection was defined as HBV(+) (sAg, eAg, eAb or cAb [+]) or HXV(+) (HBV, HCV, HDV, HEV or HGV [+]). One subject from Chengdu and one from Nanning City had extraordinarily high concentrations of AAA (5751 fmol/mg albumin) and carbonyl (1.4 nmol/mg protein), respectively. The former was confirmed to be infected with tuberculosis in a later follow up. These two subjects were excluded from the analysis.
AAA and PCC concentrations in plasma. AAA concentrations in plasma were quantified by ELISA as described previously.( 16 ) Values were normalized to the amount of albumin (fmol/mg albumin) and also to albumin concentration in plasma (fmol/mL plasma). The minimum level of AAA among these subjects was 32.6 fmol/mg albumin, above the limit of sensitivity of this assay (10 fmol/mg albumin) and quality control measures were taken as described previously.( 16 ) Protein carbonyl concentration was determined by ELISA, modified from the method by Buss et al.( 17 ) Plasma proteins (4 mg/mL) were incubated at room temperature with DNP (Sigma‐Aldrich, St Louis, MO, USA) for 45 min and non‐specifically adsorbed to an ELISA plate by incubating overnight at 4°C. Proteins were probed with biotinylated anti‐DNP antibody (Molecular Probes, Eugene, Oregon, USA), followed by streptavidin‐linked horseradish peroxidase (Amersham Biosciences UK, Little Chalfont, Buckinghamshire, UK). Finally, the substrate tetra‐methyl‐benzidine (Sigma‐Aldrich) was added. The reaction was stopped by adding acid, and absorbance at 450 nm was measured. PCC values were first normalized by TP (nmol/mg TP) and then normalized by TP concentration in plasma (nmol/mL plasma). The range of PCC in these subjects was between 0.11 and 1.41 nmol/mg TP, within the linear range of this assay (0–2.5 nmol/mg TP),( 17 ) and comparable to the reported level of PCC in human plasma (0.4–1.0 nmol/mg TP).( 18 ) The intra‐assay variation for 22 duplicates was 10.0%, similar to the mean variation of ±8.8% reported by Buss et al.( 17 )
Statistical analysis. To obtain a normal distribution and to stabilize the variance, concentrations of AAA and PCC were log‐transformed in a linear regression model. Spearman non‐parametric correlation was used to test the association between AAA and PCC, and the association between protein adducts and liver chemistry indices (ALT, AST) in each categorized group. In addition, a partial correlation analysis was used to calculate the strength of the association between AAA and PCC (adjusted for albumin and total protein concentration separately) while controlling for confounding factors (geographic location, age, sex, BSA, HXV, smoking status, alcohol consumption and ethnicity). BSA was calculated using the Dubois–Dubois formula:
| Surface = 71.74Weight(0.425)Length(0, 725), |
where surface was measure in cm2, weight was measured in kg and length was measured in cm.( 19 ) Concentrations of protein and protein adducts in the Fusui, Nanning and Chengdu groups were compared by one‐way ANOVA and multiple comparisons were tested by LSD. A Student's t‐test was used to examine the influence of age, sex, ethnicity, HXV markers, and smoking and drinking habits on the protein adduct levels in each categorized group. The effect of protein concentration was evaluated by linear regression models, in which AAA and PCC were adjusted by albumin and TP, respectively, and potential factors (AAA, geographic location, sex, age, BSA, HXV infection, smoking status, alcohol consumption and ethnicity) were tested as predictors of PCC. All analyses were carried out using the SPSS 10.0 program (Chicago, IL, USA). A two‐tailed P‐value < 0.05 was considered significant.
Results
Protein concentration variation. There were significant variations in plasma protein (TP and albumin) concentrations among the populations in the three regions (one‐way ANOVA, P < 0.001; Fig. 1). Protein concentrations were significantly higher in subjects from Fusui than from Nanning or Chengdu. Further, there were positive associations between protein concentration and AAA level (per mg albumin), and negative associations between protein concentration and PCC level (per mg TP) (Table 1). The direction of these correlations remained the same even after stratification by age and HXV markers. These results suggest that it may be inappropriate to use both biomarkers and protein concentration as independent variables in the multivariate analysis model.
Figure 1.
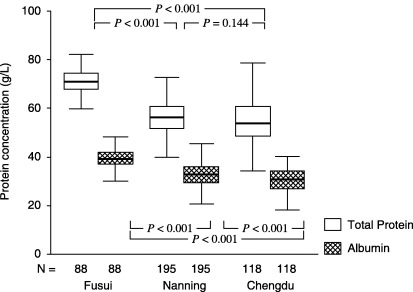
Comparison of plasma protein concentrations among 402 subjects in three regions of China. Box‐plot values were expressed as mean and range (g/L). P‐values are from multiple comparisons of the biomarkers’ levels in the three groups using one‐way ANOVA (LSD test).
Table 1.
Spearman correlations between adducts and protein concentration among 402 subjects from China, stratified by age and hepatitis virus (HXV) markers
| Variable | Value | Total (n = 402) | Adults (≥18 years) | Adolescents (<18 years) | |||||||
|---|---|---|---|---|---|---|---|---|---|---|---|
| HXV(–) (n = 191) | HXV(–) (n = 84) | HXV(–) (n = 112) | HXV(+) (n = 15) | ||||||||
| TP (mg/mL) | ALB (mg/mL) | TP (mg/mL) | ALB (mg/mL) | TP (mg/mL) | ALB (mg/mL) | TP (mg/mL) | ALB (mg/mL) | TP (mg/mL) | ALB (mg/mL) | ||
| AAA (fmol/mg albumin) | r | 0.130 | 0.220 | 0.104 | 0.249 | 0.286 | 0.374 | 0.130 | 0.136 | 0.461 | 0.354 |
| P | 0.009 | 0.001 | 0.154 | 0.001 | 0.008 | 0.001 | 0.172 | 0.153 | 0.084 | 0.196 | |
| PCC (nmol/mg protein) | r | −0.208 | −0.184 | −0.201 | −0.215 | −0.197 | −0.078 | −0.126 | −0.141 | −0.481 | −0.640 |
| P | 0.001 | 0.001 | 0.005 | 0.003 | 0.073 | 0.482 | 0.186 | 0.139 | 0.070 | 0.010 | |
AAA, AFB1–albumin adduct; ALB, albumin; PCC, protein carbonyl content; TP, total protein.
Comparison of AAA and PCC concentrations among three populations with distinct HCC mortalities: Effect of adjustment for protein concentration. The variation in AAA, PCC and HCC mortality in the three regions is illustrated in Fig. 2. There were significant differences in the concentrations of AAA and PCC (expressed per mL plasma) among the three regions. More importantly, only when the data were expressed per mL plasma did the gradient in both biomarkers parallel HCC mortalities in the three regions, suggesting that there might be etiological roles for AFB1 and oxidative stress in inducing HCC in this population.
Figure 2.
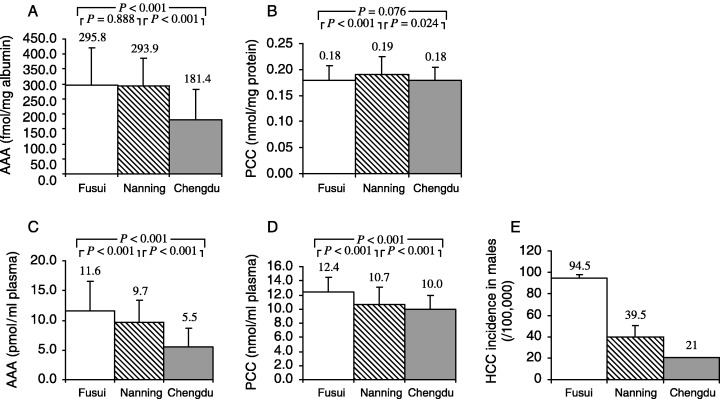
Comparison of protein adduct levels among subjects from Fusui, Nanning and Chengdu and hepatocellular carcinoma (HCC) incidence in men in each region (one‐way ANOVA). Values are expressed as mean ± SD. (A–D) P‐values are from multiple comparisons of the biomarkers’ levels in the three groups in one‐way ANOVA (LSD test). (E) HCC incidence was obtained from local cancer registeries.( 15 ) AAA, aflatoxin B1–albumin adduct; PCC, protein carbonyl content.
Association between AAA and PCC: Effect of adjustment for protein concentration. The association between AAA (fmol/mg albumin) and PCC (nmol/mg protein) was not significant (r = −0.026, P = 0.606, Spearman correlations; Fig. 3A). However, there was a significant association between AAA (fmol/mL plasma) and PCC (nmol/mL plasma) (r = 0.262, P < 0.001, Spearman correlations; Fig. 3B). In addition, in a partial correlation analysis (controlling for confounding factors including geographic location, age, sex, BSA, HXV, smoking status, alcohol consumption and ethnicity), there was also a significant association between AAA and PCC, expressed per mL plasma (r = 0.194, P < 0.001). These results demonstrate that when the biomarkers are expressed per mL plasma rather than per mg protein, AFB1 exposure increased significantly along with oxidative stress to proteins, regardless of confounding factors.
Figure 3.
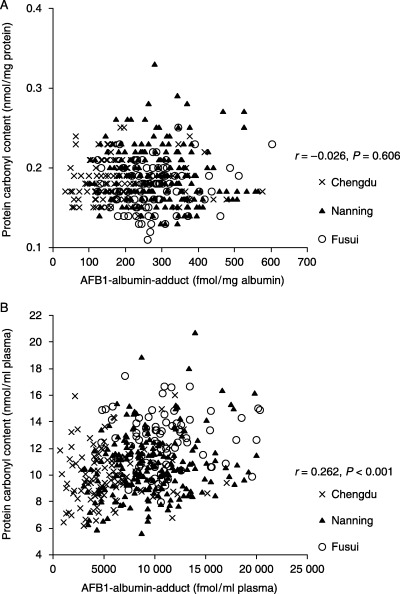
Association between aflatoxin B1 (AFB1)–albumin adducts and protein carbonyl content levels among 402 subjects from China. Data are expressed (A) per mg protein or (B) per mL plasma. r and P‐values were tested using Spearman non‐parametric correlations. AFB1, aflatoxin B1.
Association between protein adducts and liver function indices: Effect of adjustment for plasma protein concentration. Most HBV(–) subjects (91.5 and 90.2% for ALT and AST, respectively) had normal liver biochemistry levels (<40 IU/L for ALT and <45 IU/L for AST). Among the HBV(+) subjects, 86.5 and 67.7% had normal levels of ALT and AST, respectively. Thus, HBV(+) subjects had significantly higher levels of ALT and AST than HBV(–) subjects (P < 0.001, Mann–Whitney U‐test). When expressed per mL plasma, there were significant associations of the liver function markers (ALT and AST) with both AAA and PCC in HBV(+) subjects, suggesting damage induced by both AFB1 and oxidative stress to the parenchymal cells of the liver (Table 2). In addition, the relationship between AAA and ALT and AST appeared only among HBV‐infected subjects, suggesting a synergistic effect of AFB1 exposure and HBV infection in inducing liver damage.
Table 2.
Associations between protein adducts and indices of liver function in 402 subjects from China, assessed using Spearman non‐parametric correlations
| Variable | Value | HBV(–) (n = 306) | HBV(+) (n = 96) | ||||||
|---|---|---|---|---|---|---|---|---|---|
| AAA† | AAA‡ | PCC§ | PCC¶ | AAA† | AAA‡ | PCC§ | PCC¶ | ||
| ALT | r | 0.038 | 0.099 | 0.031 | 0.220 | 0.128 | 0.231 | −0.054 | 0.262 |
| P | 0.505 | 0.083 | 0.592 | 0.001 | 0.213 | 0.024 | 0.601 | 0.010 | |
| AST | r | −0.072 | 0.070 | 0.005 | 0.336 | 0.196 | 0.334 | −0.069 | 0.500 |
| P | 0.210 | 0.224 | 0.937 | 0.001 | 0.056 | 0.001 | 0.502 | 0.001 | |
AFB1–albumin adduct (fmol/mg albumin).
AFB1–albumin adduct (fmol/mL plasma).
§ Protein carbonyl content (nmol/mg total plasma protein).
¶ Protein carbonyl (nmol/mL plasma).
Predictors of protein adduct concentrations: Effect of protein concentration adjustment. We examined whether age, sex, ethnicity, hepatitis virus infection, smoking status and alcohol consumption predicted protein adducts in a univariate analysis. Men, Zhuang minorities and smokers had higher concentrations of AAA than women, those of Han ethnicity and non‐smokers, respectively, regardless of HBV status and method of adjustment of AAA concentrations. Only among HBV(+) individuals was smoking associated with significantly higher concentrations of PCC (nmol/mL plasma), suggesting a synergistic effect of cigarette smoking and HBV in increasing oxidative stress. Among adults, HBV infection was associated with significantly higher concentrations of AAA and PCC than in non‐infected subjects, regardless of the method of adjustment. Among the HBV(–) individuals, only adolescents and alcohol drinkers had significantly higher AAA (foml/mL albumin) and PCC (noml/mL plasma) concentrations than adults and non‐drinkers. Adjustment for albumin concentrations had little influence on the univariate analysis of AAA and risk factors except for alcohol consumption. Nevertheless, adjustment for total protein concentrations significantly affected the univariate analysis of PCC and risk factors (Supplementary Materials, 1, 2). Linear regression analysis revealed that AAA was the major contributor to PCC levels in both the HXV (+) and (–) groups; however, AAA was not the major contributor to PCC levels in the Chengdu subjects (Table 3).
Table 3.
Linear regression coefficients (backward): Factors affecting protein carbonyl content (PCC) concentrations (nmol/mL plasma) † in subjects from China
| Subcategory | n | Independent variable remaining in the model‡ | Standardized β | t | P |
|---|---|---|---|---|---|
| Total | 402 | Geographic location§ | −0.330 | −5.766 | 0.001 |
| Alcohol drinking | −0.141 | −2.621 | 0.009 | ||
| BSA | 0.113 | 2.001 | 0.046 | ||
| AAA | 0.149 | 2.772 | 0.006 | ||
| Guangxi | 284 | Geographic location¶ | −0.358 | −6.174 | 0.001 |
| Age | −0.157 | −1.958 | 0.051 | ||
| BSA | 0.196 | 2.371 | 0.018 | ||
| Alcohol drinking | −0.160 | −2.454 | 0.015 | ||
| AAA | 0.165 | 2.910 | 0.004 | ||
| Chengdu | 118 | Constant | 0.000 | 55.214 | 0.001 |
| HXV(–) | 303 | Ethnicity | −0.130 | −2.276 | 0.024 |
| AAA | 0.258 | 4.498 | 0.001 | ||
| HXV(+) | 99 | Ethnicity | −0.352 | −3.587 | 0.001 |
| AAA | 0.171 | 1.747 | 0.084 |
Dependent variables: Log(PCC).
Aflatoxin B1–albumin adduct (AAA), geographic location, sex, age, body surface area (BSA), hepatitis virus, smoking status, alcohol consumption, ethnicity.
§ Guangxi vs Chengdu.
¶ Fusui vs Nanning.
Discussion
These results demonstrate that plasma protein adduct dosimetry based on volume normalization rather than protein normalization gives clear associations among the biomarkers of carcinogen exposure, oxidative stress and liver damage. The association between AAA and ALT and AST suggests parenchyma injury to the liver by chronic exposure to AFB1 in this population, in agreement with observations in rabbits( 20 ) and rats( 21 ) treated with AFB1. This supports the view that the formation of protein adducts may contribute to the acute toxicity of AFB1 and augment its carcinogenicity.( 22 ) In particular, the relationship between AAA and ALT and AST appeared only when AAA were expressed as fmol/mL plasma among HBV‐infected subjects, suggesting a synergistic effect of AFB1 exposure and HBV infection in inducing damage to liver parenchymal cells. Furthermore, there was consistency between HCC incidence and levels of the carcinogen and oxidative stress biomarkers in the three geographic locations. These data suggest that oxidative stress (in terms of PCC) in the Guangxi population may arise mainly from aflatoxin exposure and that this exposure may contribute to the extraordinarily high risk of liver cancer in this region. It also supports the notion that an antioxidant‐based chemoprevention strategy might be appropriate for individuals presently at risk in this area.( 23 )
Few studies have addressed the influence of protein concentration on the dosimetry of AAA and PCC. In animals, 50% of the orally administered AFB1 is absorbed from the small intestine,( 24 ) and enters the liver through the hepatic portal blood supply,( 25 ) predominantly carried by non‐covalent binding to albumin.( 26 ) There is evidence that this process depends on the concentration of both AFB1 and albumin.( 27 ) Thus, a higher concentration of albumin may facilitate both absorption and transportation of this toxin to the liver, promoting the formation of AAA. Only 1.42–2.3% of ingested AFB1 becomes covalently bound to serum albumin.( 14 ) AFB1 is oxidized to the highly reactive 8,9‐epoxide metabolites in the liver where albumin is also synthesized exclusively. Subsequently, AAA (the lysine adduct) is formed primarily by the reaction of albumin with AFB1 dialdehyde,( 28 ) which is generated from the hydrolysis of 8,9‐epoxide or, to a lesser extent, by the direct reaction of the epoxide with the N6 atom of lysine.( 22 ) The first reaction in hepatocytes gives a substantial amount of adduct due to the high concentration of albumin and its proximity to the reactive aldehyde, and the latter reaction depends on the local concentration of free or protein lysine.( 22 ) Therefore in both kinetic models, the lysine (albumin) concentration is an important factor.
In vivo saturation of conversion of AFB1 to AAA has been reported in rats given high doses where the adduct yield was approximately 2%,( 29 ) and a dose response in AAA formation was seen for rodents with steady‐state adduct levels between 7 and 14 days.( 30 ) It is interesting that in Guengerich et al.'s study, bovine serum albumin had the effect of sequestering the AFB1 dialdehyde such that its reaction with protein lysine groups was restricted.( 22 ) We propose that the lysine (albumin) concentration is one of the ‘intrinsic’ factors the above authors raised that contributes to the sequestering effect of albumin. Thus, the concentration of AAA might be dependent on the balance between its formation and clearance. It is possible that in the liver cells of subjects with high levels of plasma albumin, there is a high level of albumin synthesis, and random binding by the limited amount of AFB1 dialdehyde or 8,9‐epoxide. This would result in a low level of AAA in these subjects when expressed as fmol/mg albumin. However, in contrast to the high doses used in animal studies, we don't know if the formation kinetics are driven primarily by the AFB1 or albumin concentrations in humans exposed to low doses. In the present study, with a mean AAA concentration of 296 fmol/mg albumin in Fusui subjects, the molar ratio of AFB1:albumin was ∼1:51 000, far below the maximum in vitro binding capacity between AFB1 and albumin (1:472) as revealed by an equilibrium dialysis model.( 27 )
The content of AAA expressed per volume of plasma might have important biological implications. Because there is a proportionality between protein and DNA adduct levels,( 3 ) the level of AAA per mL represents the biologically effective dose in a particular individual. The accumulation of AFB1–DNA adducts in the nucleus is the result of translocation of the AFB1‐protein complex, therefore the amount of AFB1 non‐covalently bound to albumin would determine the level of uptake and activation of the toxin, which leads to damage of DNA and increases the risk of developing cancer.( 27 ) Also, because albumin is a major constituent of plasma antioxidant capacity,( 31 ) the positive association we found between albumin and AAA, but negative association between albumin and PCC, suggests that the amount of albumin might modulate the extent of AFB1‐induced oxidative stress. Finally, because of the significant impact of protein concentration on protein adduct determination, the range and distribution of interindividual differences of protein concentration should be taken into account in studies designed to detect environmental or other factors.
The large variation in plasma protein concentrations in the present study, especially the differences between Fusui and the other regions, was not unexpected although the reasons for it remain unclear. Wang et al. observed a seasonal variation in albumin concentrations in a population from the south‐eastern coast of China; serum albumin concentrations in wave 1 (September to December) were significantly lower than in wave 2 (June to September) (41.9 ± 5.7 vs 59.4 ± 8.8 mg/mL serum), with a range of 21.2–61.9 vs 31.1–84.1 mg/mL.( 13 ) The albumin concentrations they reported were much higher than those in our population (mean ± SD, 33.5 ± 5.9 mg/mL plasma). Our community‐based study was conducted sequentially in Chengdu, Nanning and Fusui among people from the south‐western part of China during April to June 2001,( 15 ) a period of transition from spring to summer. We do not know if the difference in geographic location, the 2–3‐month lag in sampling, or the significantly higher prevalence of hepatitis virus infection in the Fusui group,( 15 ) or all three, contributed to the variation in protein concentrations. Although the turnover of AAA is similar to the normal turnover of blood protein, turnover of albumin is much more variable in patients with hepatitis infection and cirrhosis.( 32 , 33 ) Therefore another study is ongoing to address to what extent the variations in protein concentration could influence the evaluation of protein adducts levels in these special populations. In the study by Wang et al., normalization of the AAA data to mL of plasma was carried out because of the large range of serum albumin concentrations.( 13 ) Further, volume‐normalized AAA (pmol AFB1/mL serum) in HBV(–) females was significantly lower than that of HBV(–) and HBV(+) males, consistent with our findings.
Adjustment of AAA data can lead to different conclusions in studies published previously. For example, in the study by Wild et al. on ducks pretreated with AFB1 and HBV, the binding of aflatoxin to plasma proteins was measured 24 h after a single dose of radiolabled carcinogen.( 34 ) The authors reported a trend toward higher serum albumin binding in HBV‐infected ducks. However, if their AAA data are converted to pg AFB1/mL serum by multiplying the AAA and serum protein concentrations given in table 4 in the study by Wild et al.,( 34 ) the trend is reversed. HBV‐infected ducks had lower albumin binding of AFB1 (327–367 pg AFB1/mL serum) than non‐infected ducks (389–398 pg AFB1/mL serum). In addition, looking at HBV(+) and HBV(–) ducks separately, there may be two new interpretations of this data. In HBV(–) ducks, the AAA concentrations (pg AFB1/mL serum) were similar between ducks with or without AFB1 pretreatment (389 vs 398), simply reflecting the fact that they had received the same dose of aflatoxin. In HBV(+) ducks, the AAA concentrations (pg AFB1/mL serum) were higher in ducks with AFB1 pretreatment compared to those without (367 vs 327), suggesting a synergistic effect of HBV and AFB1 pretreatment in increasing subsequent AFB1 level. Both inferences can not be drawn from the original dosimetry (pg AFB1/mg protein).
Increased levels of plasma carbonyls have been noted in a broad variety of benign( 35 , 36 , 37 , 38 ) and malignant( 39 , 40 , 41 ) conditions. Our study showed, for the first time, a significant association between protein carbonyl levels and aflatoxin exposure, measured as AAA, and between protein damage levels and biochemical alterations in the liver, the target organ for aflatoxin biotransformation, and its carcinogenic effects. In particular, these associations were found only when protein concentration was taken into account. As summarized by Dean et al., protein concentration is one of the key factors in the immediate environment of polypeptides that influences the nature and extent of their reactions with radicals and the yields of protein oxidation products for a given radical flux increase with protein concentration until the system is saturated.( 11 ) The negative association between PCC (expressed per mg TP) and both TP and albumin in this normal population supports Danielski's observation that protein carbonyl formation is significantly elevated in hypoalbuminemic compared with normoalbuminemic hemodialysis patients.( 42 ) It is also concordant with findings in malnourished hemodialysis patients and hypoalbuminemia patients.( 43 , 44 ) Decreased levels of albumin among subjects with high levels of carbonyls might be the result of oxidative modification of proteins leading to accelerated protein degradation and increased catabolism,( 45 ) or a suppression of albumin synthesis in the liver due to oxidative stress, or both.
The association between PCC and albumin could also be interpreted from the view point of a defense against oxidants. Plasma albumin is known as an antioxidant, possessing free radical scavenging properties against oxidative stress in the bloodstream.( 31 ) The relative contribution of each antioxidant depends not only on its efficiency as an antioxidant but also its concentration in biological fluids. Albumin is the major contributor to total antioxidant capacity largely due to its high concentration relative to the other antioxidants in blood.( 46 ) It has also been shown by western blot assay that albumin is the major plasma protein target of oxidant stress.( 47 ) The association we observed between albumin and PCC is in agreement with these prior data. Finally, it has been reported that oxidized albumin can upregulate ROS generation,( 48 ) and trigger an oxidative burst of human neutrophils.( 49 ) Thus, PCC concentration per volume of blood might have important physiological and pathological significance, providing information on individual oxidative stress levels as well as antioxidant defense. However, in contrast to AAA formation and removal, carbonyl groups can be introduced into proteins by several mechanisms,( 50 ) and oxidized proteins are more rapidly endocytosed and degraded.( 45 ) This complicates efforts to understand the kinetic balance between PCC formation and clearance in plasma. In fact, the volume‐based normalization of oxidative stress biomarker data has been applied in studies of cervical cancer and diabetic and renal diseases without extensive discussion.( 51 , 52 , 53 )
In summary, we observed that volume‐normalized dosimetry resulted in significant associations among biomarkers of AFB1 exposure, oxidative stress and liver chemistry, and a consistency in the levels of these biomarkers with HCC incidence among people from three regions in China. The present data suggest that the normalization of AAA and PCC to volume of plasma might better estimate the virtual burden of AFB1 and carbonyl for a particular individual than normalization to mg protein. Further exploration of the associations between multiple biomarkers with regard to the variation of protein concentration in a population is needed and is ongoing in this laboratory. Determining the influence of protein concentration on protein adduct dosimetry in a malnourished animal model could also provide supportive data.
Acknowledgments
This work was supported in part by the National Nature Science Foundation of China (NSFC 30460143, 30560133), China Postdoctoral Science Foundation (2004035617), Guangxi Nature Sciences (GKJ0229026, 0236030), Guangxi Educational Committee (GZBH 20002‐72), Guangxi Health Ministry Medicine (Z200146, 2001087), Singapore Science (R‐1860‐000‐442‐13) and the USA National Institutes of Health (ES05116 and ES09089). Tao Peng was a postdoctoral fellow, supported by both Guangxi Medical University and Columbia University. We thank Xue Qin and Shan Li (Laboratory Center, First Affiliated Hospital of Guangxi Medical University, Nanning, Guangxi Province, China) for assistance with hepatitis virus marker assays and liver chemistry. None of the authors had a conflict of interest.
References
- 1. Goldman R, Shields PG. Food mutagens. J Nutr 2003; 133 (Suppl 3): S965 – 73. [DOI] [PubMed] [Google Scholar]
- 2. Sheabar FZ, Groopman JD, Qian GS et al. Quantitative analysis of aflatoxin–albumin adducts. Carcinogenesis 1993; 14: 1203 – 8. [DOI] [PubMed] [Google Scholar]
- 3. Skipper PL, Tannenbaum SR. Protein adducts in the molecular dosimetry of chemical carcinogens. Carcinogenesis 1990; 11: 507 – 18. [DOI] [PubMed] [Google Scholar]
- 4. Sharma RA, Farmer PB. Biological relevance of adduct detection to the chemoprevention of cancer. Clin Cancer Res 2004; 10: 4901 – 12. [DOI] [PubMed] [Google Scholar]
- 5. Jeffrey AM, Williams GM. Risk assessment of DNA‐reactive carcinogens in food. Toxicol Appl Pharmacol 2005; 207 (Suppl 2): 628 – 35. [DOI] [PubMed] [Google Scholar]
- 6. Groopman JD, Kensler TW. Role of metabolism and viruses in aflatoxin‐induced liver cancer. Toxicol Appl Pharmacol 2005; 206: 131 – 7. [DOI] [PubMed] [Google Scholar]
- 7. Shen HM, Ong CN. Mutations of the p53 tumor suppressor gene and ras oncogenes in aflatoxin hepatocarcinogenesis. Mutat Res 1996; 366: 23 – 44. [DOI] [PubMed] [Google Scholar]
- 8. Kodama M, Inoue F, Akao M. Enzymatic and non‐enzymatic formation of free radicals from aflatoxin B1. Free Radic Res Commun 1990; 10: 137 – 42. [DOI] [PubMed] [Google Scholar]
- 9. Wild CP, Jiang YZ, Sabbioni G et al. Evaluation of methods for quantitation of aflatoxin–albumin adducts and their application to human exposure assessment. Cancer Res 1990; 50: 245 – 51. [PubMed] [Google Scholar]
- 10. Droge W. Oxidative stress and aging. Adv Exp Med Biol 2003; 543: 191 – 200. [DOI] [PubMed] [Google Scholar]
- 11. Dean RT, Fu S, Stocker R et al. Biochemistry and pathology of radical‐mediated protein oxidation. Biochem J 1997; 324: 1 – 18. [DOI] [PMC free article] [PubMed] [Google Scholar]
- 12. Chevion M, Berenshtein E, Stadtman ER. Human studies related to protein oxidation: protein carbonyl content as a marker of damage. Free Radic Res 2000; 33 (Suppl): S99 – 108. [PubMed] [Google Scholar]
- 13. Wang JS, Qian GS, Zarba A et al. Temporal patterns of aflatoxin–albumin adducts in hepatitis B surface antigen‐positive and antigen‐negative residents of Daxin, Qidong County, People's Republic of China. Cancer Epidemiol Biomarkers Prev 1996; 5: 253 – 61. [PubMed] [Google Scholar]
- 14. Gan LS, Skipper PL, Peng XC et al. Serum albumin adducts in the molecular epidemiology of aflatoxin carcinogenesis: correlation with aflatoxin B1 intake and urinary excretion of aflatoxin M1. Carcinogenesis 1988; 9: 1323 – 5. [DOI] [PubMed] [Google Scholar]
- 15. Tao P, Zhi‐Ming L, Tang‐Wei L et al. Associated factors in modulating aflatoxin B1–albumin adduct level in three Chinese populations. Dig Dis Sci 2005; 50: 525 – 32. [DOI] [PubMed] [Google Scholar]
- 16. Chen CJ, Wang LY, Lu SN et al. Elevated aflatoxin exposure and increased risk of hepatocellular carcinoma. Hepatology 1996; 24: 38 – 42. [DOI] [PubMed] [Google Scholar]
- 17. Buss H, Chan TP, Sluis KB et al. Protein carbonyl measurement by a sensitive ELISA method. Free Radic Biol Med 1997; 23: 361 – 6. [DOI] [PubMed] [Google Scholar]
- 18. Halliwell B. Oxidative stress, nutrition and health. Experimental strategies for optimization of nutritional antioxidant intake in humans. Free Radic Res 1996; 25: 57 – 74. [DOI] [PubMed] [Google Scholar]
- 19. Willard RC, Joyce M. Extrapolation of toxicological and pharmacological data from animals to humans. Adv Drug Res 1991; 20: 1 – 116. [Google Scholar]
- 20. Yousef MI, Salem MH, Kamel KI et al. Influence of ascorbic acid supplementation on the haematological and clinical biochemistry parameters of male rabbits exposed to aflatoxin B1. J Environ Sci Health B 2003; 38: 193 – 209. [DOI] [PubMed] [Google Scholar]
- 21. Moundipa PF, Domngang FM. Effect of the leafy vegetable Solanum nigrum on the activities of some liver drug‐metabolizing enzymes after aflatoxin B1 treatment in female rats. Br J Nutr 1991; 65: 81 – 91. [DOI] [PubMed] [Google Scholar]
- 22. Guengerich FP, Arneson KO, Williams KM et al. Reaction of aflatoxin B1 oxidation products with lysine. Chem Res Toxicol 2002; 15: 780 – 92. [DOI] [PubMed] [Google Scholar]
- 23. Kensler TW, Qian GS, Chen JG et al. Translational strategies for cancer prevention in liver. Nat Rev Cancer 2003; 3: 321 – 9. [DOI] [PubMed] [Google Scholar]
- 24. Coulombe RA Jr, Sharma RP. Clearance and excretion of intratracheally and orally administered aflatoxin B1 in the rat. Food Chem Toxicol 1985; 23: 827 – 30. [DOI] [PubMed] [Google Scholar]
- 25. Wilson R, Ziprin R, Ragsdale S et al. Uptake and vascular transport of ingested aflatoxin. Toxicol Lett 1985; 29: 169 – 76. [DOI] [PubMed] [Google Scholar]
- 26. Ewaskiewicz JI, Devlin TM, Ch’ih JJ. The in vivo disposition of aflatoxin B1 in rat liver. Biochem Biophys Res Commun 1991; 179: 1095 – 100. [DOI] [PubMed] [Google Scholar]
- 27. Ch’ih JJ, Ewaskiewicz JI, Taggart P et al. Nuclear translocation of aflatoxin B1–protein complex. Biochem Biophys Res Commun 1993; 190: 186 – 91. [DOI] [PubMed] [Google Scholar]
- 28. Sabbioni G, Skipper PL, Buchi G et al. Isolation and characterization of the major serum albumin adduct formed by aflatoxin B1 in vivo in rats. Carcinogenesis 1987; 8: 819 – 24. [DOI] [PubMed] [Google Scholar]
- 29. Scholl PF, McCoy L, Kensler TW et al. Quantitative analysis and chronic dosimetry of the aflatoxin B1 plasma albumin adduct Lys‐AFB1 in rats by isotope dilution mass spectrometry. Chem Res Toxicol 2006; 19: 44 – 9. [DOI] [PubMed] [Google Scholar]
- 30. Wild CP, Hasegawa R, Barraud L et al. Aflatoxin–albumin adducts: a basis for comparative carcinogenesis between animals and humans. Cancer Epidemiol Biomarkers Prev 1996; 5: 179 – 89. [PubMed] [Google Scholar]
- 31. Hu ML, Louie S, Cross CE et al. Antioxidant protection against hypochlorous acid in human plasma. J Lab Clin Med 1993; 121: 257 – 62. [PubMed] [Google Scholar]
- 32. Rosenoer VM. Clinical aspects of albumin metablism. In: Rosenoer VM, Oratz M, Rothschild MA, eds. Albumin Structure, Function and Uses. Oxford, UK: Pergamon Press, 1977; 345 – 67. [Google Scholar]
- 33. Egner PA, Gange SJ, Dolan PM et al. Levels of aflatoxin–albumin biomarkers in rat plasma are modulated by both long‐term and transient interventions with oltipraz. Carcinogenesis 1995; 16: 1769 – 73. [DOI] [PubMed] [Google Scholar]
- 34. Wild CP, Jansen LA, Cova L et al. Molecular dosimetry of aflatoxin exposure: contribution to understanding the multifactorial etiopathogenesis of primary hepatocellular carcinoma with particular reference to hepatitis B virus. Environ Health Perspect 1993; 99: 115 – 22. [DOI] [PMC free article] [PubMed] [Google Scholar]
- 35. Pantke U, Volk T, Schmutzler M et al. Oxidized proteins as a marker of oxidative stress during coronary heart surgery. Free Radic Biol Med 1999; 27: 1080 – 6. [DOI] [PubMed] [Google Scholar]
- 36. Abu‐Zidan FM, Winterbourn CC, Bonham MJ et al. Small bowel ischaemia‐reperfusion increases plasma concentrations of oxidised proteins in rats. Eur J Surg 1999; 165: 383 – 9. [DOI] [PubMed] [Google Scholar]
- 37. Inagi R, Miyata T. Oxidative protein damage with carbohydrates and lipids in uremia: carbonyl stress. Blood Purif 1999; 17: 95 – 8. [DOI] [PubMed] [Google Scholar]
- 38. Baynes JW. Role of oxidative stress in development of complications in diabetes. Diabetes 1991; 40: 405 – 12. [DOI] [PubMed] [Google Scholar]
- 39. Popadiuk S, Korzon M, Renke J et al. Carbonyl groups content on the basis of protein peroxidation analysis with total antioxidant status in blood of children with cancers. Wiad Lek 1998; 51 (Suppl 4): 107 – 12. [PubMed] [Google Scholar]
- 40. Pignatelli B, Li CQ, Boffetta P et al. Nitrated and oxidized plasma proteins in smokers and lung cancer patients. Cancer Res 2001; 61: 778 – 84. [PubMed] [Google Scholar]
- 41. Yilmaz IA, Akcay T, Cakatay U et al. Relation between bladder cancer and protein oxidation. Int Urol Nephrol 2003; 35: 345 – 50. [DOI] [PubMed] [Google Scholar]
- 42. Danielski M, Ikizler TA, McMonagle E et al. Linkage of hypoalbuminemia, inflammation, and oxidative stress in patients receiving maintenance hemodialysis therapy. Am J Kidney Dis 2003; 42: 286 – 94. [DOI] [PubMed] [Google Scholar]
- 43. Dogra G, Ward N, Croft KD et al. Oxidant stress in nephrotic syndrome: comparison of F2‐isoprostanes and plasma antioxidant potential. Nephrol Dial Transplant 2001; 16: 1626 – 30. [DOI] [PubMed] [Google Scholar]
- 44. Stenvinkel P, Holmberg I, Heimburger O et al. A study of plasmalogen as an index of oxidative stress in patients with chronic renal failure. Evidence of increased oxidative stress in malnourished patients. Nephrol Dial Transplant 1998; 13: 2594 – 600. [DOI] [PubMed] [Google Scholar]
- 45. Grant AJ, Jessup W, Dean RT. Accelerated endocytosis and incomplete catabolism of radical‐damaged protein. Biochim Biophys Acta 1992; 1134: 203 – 9. [DOI] [PubMed] [Google Scholar]
- 46. Yao JK, Reddy R, Van Kammen DP. Abnormal age‐related changes of plasma antioxidant proteins in schizophrenia. Psychiatry Res 2000; 97: 137 – 51. [DOI] [PubMed] [Google Scholar]
- 47. Himmelfarb J, McMonagle E. Albumin is the major plasma protein target of oxidant stress in uremia. Kidney Int 2001; 60: 358 – 63. [DOI] [PubMed] [Google Scholar]
- 48. Witko‐Sarsat V, Friedlander M, Nguyen KT et al. Advanced oxidation protein products as novel mediators of inflammation and monocyte activation in chronic renal failure. J Immunol 1998; 161: 2524 – 32. [PubMed] [Google Scholar]
- 49. Mera K, Anraku M, Kitamura K et al. The structure and function of oxidized albumin in hemodialysis patients: Its role in elevated oxidative stress via neutrophil burst. Biochem Biophys Res Commun 2005; 334: 1322 – 8. [DOI] [PubMed] [Google Scholar]
- 50. Berlett BS, Stadtman ER. Protein oxidation in aging, disease, and oxidative stress. J Biol Chem 1997; 272: 20 313 – 16. [DOI] [PubMed] [Google Scholar]
- 51. Maldonado PA, Negrini LA, Kaizer RR et al. Oxidative status in patients, submitted to conization and radiation treatments for uterine cervix neoplasia. Clin Chim Acta 2005; 366: 174 – 8. [DOI] [PubMed] [Google Scholar]
- 52. Izuhara Y, Miyata T, Saito K et al. Ultrapure dialysate decreases plasma pentosidine, a marker of ‘carbonyl stress’. Am J Kidney Dis 2004; 43: 1024 – 9. [DOI] [PubMed] [Google Scholar]
- 53. Ceriello A, Mercuri F, Quagliaro L et al. Detection of nitrotyrosine in the diabetic plasma: evidence of oxidative stress. Diabetologia 2001; 44: 834 – 8. [DOI] [PubMed] [Google Scholar]