Abstract
Diffuse large B‐cell lymphoma is the most common form of non‐Hodgkin lymphoma. Although many studies have attempted to identify prognostic factors, most have focused on conventionally treated patients. The influence of anti‐CD20 antibody (rituximab) should be considered now. We evaluated the prognostic significance of serum soluble interleukin‐2 receptor levels and germinal center B‐cell‐like or non‐germinal center B‐cell like subgroups in 80 patients with diffuse large B‐cell lymphoma, who had been treated with rituximab. Serum soluble interleukin‐2 receptor levels ranged from 322 to 39900 U/mL (median 1365 U/mL). Sixteen (20%) were germinal center B‐cell‐like subgroups, and the remainder (80%) non‐germinal center B‐cell‐like. Survival analysis associated lower serum soluble interleukin‐2 receptor level and germinal center B‐cell‐like phenotype with better overall survival (P = 0.015), whereas multivariate analysis, including International Prognostic Index factors, revealed that only higher performance status score and higher serum lactate dehydrogenase levels significantly affected survival. However, serum soluble interleukin‐2 receptor levels were elevated in patients with higher International Prognostic Index scores as well as in the non‐germinal center B‐cell‐like subgroup. Serum soluble interleukin‐2 receptor levels, International Prognostic Index, and subphenotypes were strongly correlated with each other. Our study showed that soluble interleukin‐2 receptor is quite useful and may serve as a substitute for the International Prognostic Index, especially for patients undergoing treatment. Moreover, the differentiation between the germinal center B‐cell‐like and non‐germinal center B‐cell‐like phenotypes is also useful for predicting patients with diffuse large B‐cell lymphoma, even among those treated with rituximab. (Cancer Sci 2009; 100: 1255–1260)
Diffuse large B‐cell lymphoma (DLBCL) is one of the most common subtypes of non‐Hodgkin lymphoma (NHL), representing 30% to 40% of adult cases of NHL, and its incidence has increased in the past few decades. DLBCL is recognized clinically and biologically as a heterogeneous group of tumors.( 1 ) Recently, therapeutic methods have also improved. In particular, anti‐CD20 antibody (rituximab) is now the most powerful tool for B‐cell malignancies.
Many investigators have reported on the prognostic factors of NHL, and the most powerful one we have recognized is the International Prognostic Index (IPI).( 2 ) The IPI contains patients’ age, performance status (PS), Ann Arbor clinical stage (CS), serum lactate dehydrogenase (LDH) activity, and the number of extranodal lesions. In addition, in the rituximab era, a revised IPI has been proposed, which is better than the standard IPI.( 3 ) Several reports have revealed that serum soluble interleukin‐2 receptor (sIL‐2R) level may also be a prognostic factor for NHL.( 4 , 5 , 6 ) IL‐2R is expressed not only on the surface of activated T or B lymphocytes, but also on parts of lymphoid malignancies. sIL‐2R is released from the cell membrane by cleavage of IL‐2R, and its serum level rises in patients with some malignancies, including malignant lymphoma.( 7 , 8 )
Recently, by using a cDNA microarray profiling method, DLBCL was divided into two groups: a germinal center B‐cell‐like type (GCB‐type) and an activated B‐cell like type (ABC‐type).( 9 ) The GCB‐type DLBCL shows overexpression of the genes that characterize normal germinal center (GC) cells, whereas the ABC subgroup overexpresses a group of genes that are highly transcribed by in vitro–activated peripheral blood B‐cells.
Some reports have shown that GCB‐type DLBCL has a better prognosis than ABC‐type DLBCL.( 9 , 10 , 11 ) At present, however, a DNA microarray profiling method is not available for all DLBCL patients in most diagnostic pathology laboratories. Instead, immunohistochemistry is a clinically useful prognostic tool. Hans et al.( 12 ) showed that immunohistochemistry staining patterns for CD10, Bcl‐6, and MUM‐1 can be used to classify DLBCL into GCB and non‐GCB subgroups that correlate prognostically with the groups defined by the cDNA microarray method.
As far as we know, there is only one report which has clarified the prognostic factors after rituximab,( 13 ) and no report has analyzed both subgroups (GCB versus non‐GCB) and serum sIL‐2R simultaneously. We sought to compare both subtypes and serum sIL‐2R levels in terms of patient survival, and to evaluate the prognostic factors in patients who were treated with rituximab.
Materials and Methods
Patient characteristics. Formalin‐fixed, paraffin‐embedded tissue blocks of 107 primary biopsies of DLBCL were retrieved from the files of the Hiroshima Red Cross Hospital & Atomic‐Bomb Survivors Hospital, where the diagnoses were made between 1997 and 2007. Among these 107 patients, 80 patients were treated with rituximab containing chemotherapy as described below, and we analyzed these 80 cases (rituximab group). Informed consent for retrospective analysis and for additional immunophenotypic analysis was obtained according to the Declaration of Helsinki.
Cases were reclassified according to the World Health Organization classification.( 1 ) Patients were selected only on the basis of availability of clinical information and histological material. Histology was reviewed by three pathologists (TY, YS, TM), and only patients with DLBCL, not otherwise specified (NOS) were included.
All patients were previously untreated, and were treated according to standard primary anthracycline‐containing combination chemotherapy (predominantly cyclophosphamide, doxorubicine, vincristine, and predonisolone (CHOP) regimen). Seventy‐seven cases who started their first chemotherapy after September 2003 were treated by an anthracycline‐containing chemotherapy combination with rituximab, an anti‐CD20 monoclonal antibody, except for one case that was negative for CD20. Three cases that were diagnosed before 2003 received primary chemotherapy without rituximab. These cases relapsed after 27, 89, and 91 months, respectively, and then received secondary chemotherapy with rituximab. The median follow‐up period of the rituximab group was 22 months.
Immunohistochemistry. The panel of monoclonal antibodies included antibodies against the following antigens: CD20 (L26, 1:100; Novocastra, Newcastle upon Tyne, UK), CD3 epsilon (PS‐1, 1:50; Novocastra), CD5 (4C7, 1:100; Novocastra), CD10 (56C6, 1:50; Novocastra), Bcl‐2 (3.1, 1:200; Novocastra), Bcl‐6 (PG‐B6p, 1:50; Dako, Carpinteria, CA, USA), MUM1 (MUM1p, 1:50; Dako), Ki‐67 (MIB‐1, 1:1000; Novocastra), and p53 (Pab1801, 1:200; Santa Cruz Biotechnology, Santa Cruz, CA, USA). Three‐micrometer paraffin sections from formalin‐fixed material were dehydrated and deparaffinized according to standard procedures. A previous step of heat‐induced antigen retrieval was used for all antigens in all cases. After incubation with the primary antibodies, the immunoreaction was developed using the Dako Envision_System peroxidase technique (Dako) with diaminobenzidine (DAB) as chromogen. The slides were counterstained with Mayer's hematoxylin. Cases were considered positive if 30% or more of the tumor cells were stained with an antibody, as the previous reports recommended.( 12 , 14 )
Clinicopathological assessment. All cases were stratified into GCB and non‐GCB subgroups. The procedure to classify subgroups was that of Hans et al.( 12 )
The clinical parameters we assessed were International Prognostic Index (IPI) risk, gender, serum sIL‐2R level, B symptoms, bone marrow invasions, bulky masses, and survival rate. IPI scoring includes age, Eastern Cooperative Oncology Group (ECOG) performance status (PS), clinical stage, serum LDH level, and the number of extranodal sites. The survival rate was calculated from the time of diagnosis to the time of last follow‐up.
Statistical analysis. Survival curves were estimated by the Kaplan–Meier method.( 15 ) The significance of survival differences was determined by the log‐rank and generalized Wilcoxon tests. A difference was considered significant when either of these two tests found it to be so. Differences between groups were evaluated by the Mann–Whitney U‐test (non‐parametric analysis) or Fisher's exact test.
Cox multivariate analysis( 16 ) was carried out to estimate the prognostic impacts of the biomarkers and IPI risk factors. The level of significance was set at P < 0.05. Data were analyzed using SPSS software version 14.0 for Windows (SPSS, Chicago, IL, USA).
Results
Patient characteristics. The median age was 66.0 years (range, 29–87 years). Forty‐one (51.3%) were male and 39 (48.8%) were female. The median serum sIL‐2R level was 1365 U/mL (range, 322–39900 U/mL). Other patient characteristics are outlined in Table 1. Sixty‐nine patients (86.3%) achieved complete response (CR) and four patients showed partial remission (PR), for an overall response rate of 91.3%.
Table 1.
Main initial characteristics of 80 patients with diffuse large B‐cell lymphoma
| Characteristics | No. (%) |
|---|---|
| Performance status (ECOG ≥ 2) | 20 (25) |
| B symptoms (n = 60) † | 24 (40) |
| Ann Arbor stage | |
| I | 8 (10) |
| II | 18 (22) |
| III | 19 (24) |
| IV | 35 (44) |
| Bulky disease (n = 76) † | 22 (29) |
| Bone marrow invasion (n = 77) † | 17 (22) |
| High serum LDH levels (> normal) | 40 (50) |
| Revised International Prognostic Index | |
| Very good risk | 11 (14) |
| Good risk | 32 (40) |
| Poor risk | 37 (46) |
| High serum sIL‐2R levels (>1500 U/mL) | 37 (46) |
| Primary extranodal origin (excluding Waldeyer's ring) | 34 (43) |
| Complete remission (CR) rate | 69 (86) |
| Overall response rate (CR + PR) | 73 (91) |
| Number of relapse | 14 (18) |
| Treated with hematopoietic stem cell transplantation | 5 (6) |
The median age of the patients was 66 years (range, 29–87 years); 41 were male and 39 were female.
The n shown reflects the number of patients for whom data were available.
ECOG, Eastern Cooperative Oncology Group scale; LDH, lactate dehydrogenase; PR, partial remission; sIL‐2R, soluble interleukin‐2 receptor.
Immunophenotype of DLBCL. Following the criteria described by Hans et al.( 12 ) 16 cases (20%) were categorized in the GCB subgroup and 64 cases (80%) in the non‐GCB subgroup (Fig. 1). The GCB : non‐GCB ratio was 1:4. CD5 was expressed in 13.8% (11/80) of the tumors, Bcl‐2 in 67.5% (54/80), and p53 in 13.8% (11/80).
Figure 1.
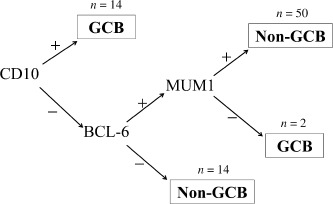
Classification of germinal center B‐cell‐like (GCB) and non‐GCB‐type diffuse large B‐cell lymphomas according to Hans et al.( 12 )
Survival analysis. According to the Kaplan–Meier method, the 5‐year‐overall survival rate was 78.4% (Fig. 2a). When the cases were divided into revised IPI risk groups, the very‐good risk group had the highest survival rate while the poor‐risk group had the lowest, and the survival rates differed significantly among groups (Fig. 2b). When the cases were divided into GCB and non‐GCB subgroups, patients who were in the GCB subgroup were all alive, while the 5‐year‐overall survival rate of the patients who were in the non‐GCB subgroup was 73.3%, and the median survival between subgroups differed significantly (Fig. 3a). We set a serum sIL‐2R cut‐off level at 1500 U/mL because this was close to the median sIL‐2R level, 1365 U/mL. The patients’ 4‐year survival rates for the high (>1500 U/mL) and low (≤1500 U/mL) sIL‐2R groups were 65.8% and 89.3%, respectively (P = 0.010, Fig. 3b). A three‐group classification, in which GCB and non‐GCB subgroups were divided between higher and lower sIL‐2R levels, showed that the GCB subgroup had the best survival rate, while the non‐GCB subgroup with a higher sIL‐2R level (>1500 U/mL) had the worst; this confirmed significant differences among the groups (Fig. 3c).
Figure 2.
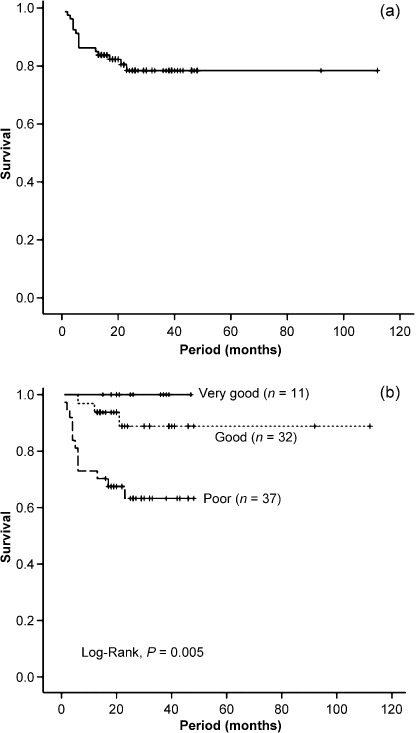
Overall survival of the study population. (a) Overall survival of 80 patients with diffuse large B‐cell lymphoma (DLBCL) treated with rituximab. (b) Overall survival according to the revised International Prognostic Index risk groups.
Figure 3.
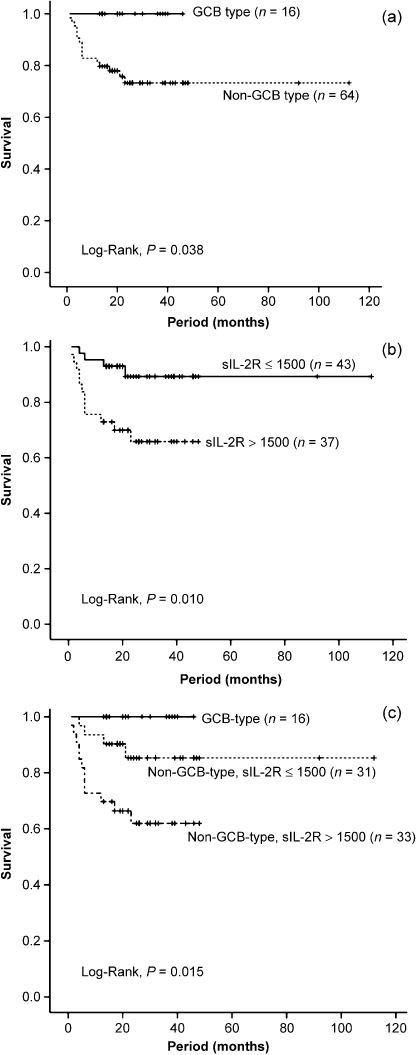
Overall survival according to (a) germinal center B‐cell‐like (GCB) and non‐GCB subtypes, (b) serum soluble interleukin‐2 receptor (sIL‐2R) level is higher than 1500 U/mL or lower, and (c) both subphenotype and serum soluble interleukin‐2 receptor (sIL‐2R) levels.
Univariate and multivariate analyses of overall survival. As shown in Table 2, univariate analysis showed that the overall survival was significantly worse for patients aged 60 years or older, patients with a PS score above 2, patients who had B symptoms, bulky masses, or bone marrow invasion, patients with elevated serum LDH levels, and patients with tumors expressing CD5. Multivariate analysis showed that higher PS score (score 2 or over) and above‐normal serum LDH levels were independent prognostic factors for overall survival (Table 3).
Table 2.
Prognostic factors in univariate analysis
| Numbers | P‐values | |||
|---|---|---|---|---|
| Log‐rank | G‐Wilcoxon | |||
| CD5 | Positive | 11 | 0.002 | 0.012 |
| Negative | 69 | |||
| Bcl‐2 | Positive | 54 | 0.954 | 0.848 |
| Negative | 26 | |||
| p53 | Positive | 11 | 0.1 | 0.078 |
| Negative | 69 | |||
| Age | ≤60 years | 30 | 0.005 | 0.007 |
| >60 years | 50 | |||
| Gender | Male | 41 | 0.109 | 0.074 |
| Female | 39 | |||
| Performance status | 0, 1 | 60 | <0.001 | <0.001 |
| 2, 3, 4 | 20 | |||
| LDH | Normal | 40 | 0.001 | 0.001 |
| Higher | 40 | |||
| Stage | I or II | 26 | 0.054 | 0.062 |
| III or IV | 54 | |||
| No. of extranodal sites (n = 74) † | ≤1 | 49 | 0.46 | 0.475 |
| >1 | 25 | |||
| B symptom (n = 60) † | Present | 24 | 0.003 | 0.003 |
| Absent | 36 | |||
| Bulky disease (n = 76) † | Present | 22 | <0.001 | <0.001 |
| Absent | 54 | |||
| Bone marrow invasion (n = 77) † | Present | 17 | 0.004 | 0.002 |
| Absent | 60 | |||
The n shown reflects the number of patients for whom data were available.LDH, lactate dehydrogenase.
Table 3.
Cox multivariate analysis for overall survival
| Variable | Unfavorable | HR | 95% CI | P‐values |
|---|---|---|---|---|
| Age | >60 year | 7.954 | 0.991–63.811 | 0.051 |
| PS | ≥2 | 2.962 | 1.014–8.653 | 0.047 |
| LDH | >normal | 6.531 | 1.105–38.594 | 0.038 |
| sIL‐2R | >1500 U/mL | 0.82 | 0.213–3.152 | 0.773 |
CI, confidence interval; HR, hazard ratio; LDH, lactate dehydrogenase; PS, performance status; sIL‐2R, soluble interleukin‐2 receptor.
Effects of rituximab on patients’ prognoses. As shown in the patients’ characteristics, we firstly chose 107 cases: 80 were in the rituximab group and the other 27 were treated without rituximab (non‐rituximab group). The results of patients’ prognoses were shown in Fig. 4. The overall survival curve of the rituximab group showed a better tendency than the non‐rituximab group, but there were no statistically significant differences.
Figure 4.
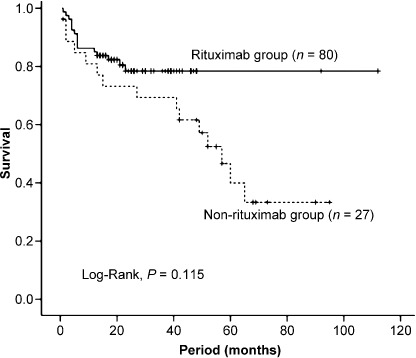
Overall survival according to whether patients received rituximab‐containing chemotherapy or not.
Discussion
Survival analysis in the present study showed that GCB‐type patients had better prognoses, whereas patients with elevated sIL‐2R levels or who were in the non‐GCB subgroup had poorer prognoses in DLBCL. In multivariate analysis, however, a higher sIL‐2R level was not an independent prognostic factor. We wondered if this was attributable to the strong correlations between IPI risk groups and sIL‐2R levels. Indeed, as shown in Figure 5, the serum sIL‐2R level was closely correlated with revised‐IPI risk groups. As the figure shows, the worse the revised‐IPI risk becomes, the higher the sIL‐2R level is, and there are significant differences among all revised‐IPI risk groups. Many reports indicate that the determination of the IPI risk group at the initial point before treatment is a very powerful prognostic tool. Our data showed a similar result. However, such determination is not appropriate when the patients are followed‐up after treatment, or at a time of tumor relapse. This is because the IPI risk groups include several criteria. On the other hand, serum sIL‐2R level is a continuous variable and is suitable for following the measured levels continuously. Our data suggest that sIL‐2R may be prognostically useful with DLBCL patients after their treatments. Serum sIL‐2R levels can be elevated not only in malignant lymphomas but also in non‐hematopoietic disorders such as collagen diseases( 17 ) or other malignancies.( 18 ) Thus, we should consider these other factors, too.
Figure 5.
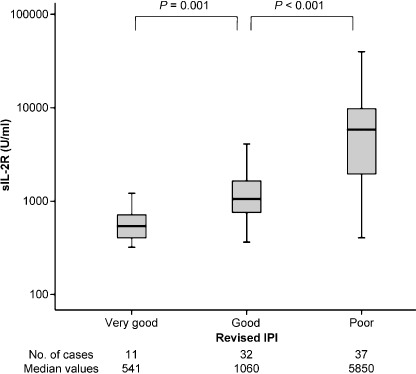
Serum soluble interleukin‐2 receptor (sIL‐2R) levels according to revised International Prognostic Index (IPI) risk group.
Interestingly, there are mutual relationships between the IPI poor‐risk group and the non‐GCB subgroup (by Fisher's exact test, P = 0.023). And the serum sIL‐2R levels are higher in patients in the non‐GCB subgroup than in those of the GCB subgroup (by Mann–Whitney U‐test, P = 0.007, Fig. 6). When we classified cases into GCB and non‐GCB subgroups, the GCB : non‐GCB ratio was 1:4. Shiozawa et al.( 19 ) reported that the GCB subgroup was less frequent in Asian countries; the approximate GCB : non‐GCB ratio was 1:1.5–1:2.5. They described that non‐GCB dominance in Asian countries is different from that in Western countries, where almost no differences between these two groups.( 20 , 21 , 22 )
Figure 6.
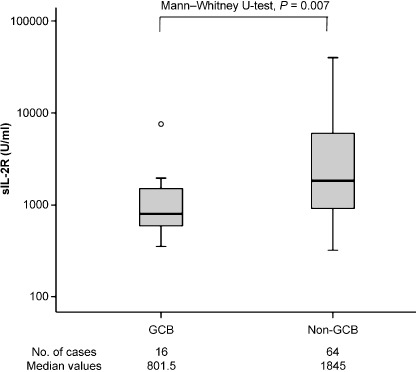
Serum soluble interleukin‐2 receptor (sIL‐2R) levels according to subphenotype.
Several reports indicate that the GCB‐type of DLBCL has a better prognosis than the non‐GCB type.( 9 , 10 , 11 ) But most of those reports concerned the administration of chemotherapy without rituximab. Nowadays, anthracycline‐containing combination chemotherapy with rituximab is a standard treatment protocol for patients with DLBCL. Several investigators have reported that in patients with DLBCL who were treated with rituximab‐containing chemotherapy, there were no significant differences in outcomes between GCB and non‐GCB subgroups.( 23 , 24 ) Costa et al.( 25 ) reported that GCB‐type and non‐GCB‐type DLBCL had similar outcomes following autologous hematopoietic stem cell transplantation. Our present data, however, showed that there were significant differences in survival between GCB and non‐GCB subgroups (Fig. 3a). This finding is similar to that reported by Fu et al.( 13 ) Although the reasons for the different conclusions between our data and those in previous reports remain unclear, Fu et al.( 13 ) referred that one of the reasons was a technical problem. Significantly greater numbers of cases need to be examined in order to reach a clearer conclusion. Even so, our clinical data came from a single institute whose treatment strategy is quite uniform, and we believe that classifying DLBCL patients into GCB versus non‐GCB subgroups probably is also prognostically useful.
We also analyzed CD5 and p53 expression by immunohistochemistry. Both are prognostic biomarkers in DLBCL.( 26 , 27 , 28 ) Our data showed that 11 cases of DLBCL were positive for CD5 and 11 cases of DLBCL had overexpression of p53. In univariate analysis, the cases that were positive for CD5 showed poorer prognoses than the negative ones (P < 0.05), whereas p53 did not show significant differences in survival. Multivariate analysis compared with IPI showed significant differences for CD5 (CD5: relative risk, 3.26 [95% confidence interval: 1.17–9.10], P = 0.024; p53: relative risk, 2.11 [95% confidence interval: 0.67–6.69], P = 0.205), so we confirmed that CD5 is an independent prognostic marker. The report from Chang et al.( 28 ) is the one in which patients received chemotherapy without rituximab; thus p53 may not be a prognostic biomarker in the rituximab era.
In conclusion, it is useful to distinguish between GCB and non‐GCB subgroups and to measure serum sIL‐2R among DLBCL patients treated with rituximab in order to evaluate the risk, tumor activity, and prognosis more accurately. CD5 are also useful biomarkers.
Acknowledgments
We are grateful to Dr. Toshiharu Mitsuhashi for suggestions on the statistics, and to the pathologists and clinicians involved in the diagnosis and treatment of patients at Hiroshima Red Cross Hospital & Atomic‐Bomb Survivors Hospital.
References
- 1. Swerdlow SH, Campo E, Harris NL et al . WHO Classification of Tumours of Haematopoietic and Lymphoid Tissues. Lyon, France: IARC Press, 2008. [Google Scholar]
- 2. The International Non‐Hodgkin's Lymphoma Prognostic Factors Project . A predictive model for aggressive non‐Hodgkin's lymphoma. N Engl J Med 1993; 329: 987–94. [DOI] [PubMed] [Google Scholar]
- 3. Sehn LH, Berry B, Chhanabhai M et al . The revised International Prognostic Index (R‐IPI) is a better predictor of outcome than standard IPI for patients with diffuse large B‐cell lymphoma treated with R‐CHOP. Blood 2007; 109: 1857–61. [DOI] [PubMed] [Google Scholar]
- 4. Niitsu N, Iijima K, Chizuka A. A high serum‐soluble interleukin‐2 receptor level is associated with a poor outcome of aggressive non‐Hodgkin's lymphoma. Eur J Haematol 2001; 66: 24–30. [DOI] [PubMed] [Google Scholar]
- 5. Goto H, Tsurumi H, Takemura M et al . Serum‐soluble interleukin‐2 receptor (sIL‐2R) level determines clinical outcome in patients with aggressive non‐Hodgkin's lymphoma: in combination with the International Prognostic Index. J Cancer Res Clin Oncol 2005; 131: 73–9. [DOI] [PubMed] [Google Scholar]
- 6. Oki Y, Kato H, Matsuo K et al . Prognostic value of serum soluble interleukin‐2 receptor level in patients with diffuse large B cell lymphoma, treated with CHOP‐ or RCHOP‐based therapy. Leuk Lymphoma 2008; 49: 1345–51. [DOI] [PubMed] [Google Scholar]
- 7. Rubin LA, Kurman CC, Fritz ME et al . Soluble interleukin 2 receptors are released from activated human lymphoid cells in vitro. J Immunol 1985; 135: 3172–7. [PubMed] [Google Scholar]
- 8. Rubin LA, Nelson DL. The soluble interleukin‐2 receptor: biology, function, and clinical application. Ann Intern Med 1990; 113: 619–27. [DOI] [PubMed] [Google Scholar]
- 9. Alizadeh AA, Eisen MB, Davis RE et al . Distinct types of diffuse large B‐cell lymphoma identified by gene expression profiling. Nature 2000; 403: 503–11. [DOI] [PubMed] [Google Scholar]
- 10. Wright G, Tan B, Rosenwald A, Hurt EH, Wiestner A, Staudt LM. A gene expression‐based method to diagnose clinically distinct subgroups of diffuse large B cell lymphoma. Proc Natl Acad Sci USA 2003; 100: 9991–6. [DOI] [PMC free article] [PubMed] [Google Scholar]
- 11. Muris J, Meijer C, Vos W et al . Immunohistochemical profiling based on Bcl‐2, CD10 and MUM1 expression improves risk stratification in patients with primary nodal diffuse large B cell lymphoma. J Pathol 2006; 208: 714–23. [DOI] [PubMed] [Google Scholar]
- 12. Hans CP, Weisenburger DD, Greiner TC et al . Confirmation of the molecular classification of diffuse large B‐cell lymphoma by immunohistochemistry using a tissue microarray. Blood 2004; 103: 275–82. [DOI] [PubMed] [Google Scholar]
- 13. Fu K, Weisenburger DD, Choi WW et al . Addition of rituximab to standard chemotherapy improves the survival of both the germinal center B‐cell‐like and non‐germinal center B‐cell‐like subtypes of diffuse large B‐cell lymphoma. J Clin Oncol 2008; 26: 4587–94. [DOI] [PubMed] [Google Scholar]
- 14. Natkunam Y, Warnke RA, Montgomery K, Falini B, Van De Rijn M. Analysis of MUM1/IRF4 protein expression using tissue microarrays and immunohistochemistry. Mod Pathol 2001; 14: 686–94. [DOI] [PubMed] [Google Scholar]
- 15. Kaplan E, Meier P. Nonparametric estimation from incomplete observations. Am Stat Assoc J 1958; 53: 457–81. [Google Scholar]
- 16. Cox D. Regression models and life‐tables. J R Stat Soc 1972; 34: 187–202. [Google Scholar]
- 17. Rubin LA, Snow KM, Kurman CC, Nelson DL, Keystone EC. Serial levels of soluble interleukin 2 receptor in the peripheral blood of patients with rheumatoid arthritis: correlations with disease activity. J Rheumatol 1990; 17: 597–602. [PubMed] [Google Scholar]
- 18. Hurteau JA, Woolas RP, Jacobs IJ et al . Soluble interleukin‐2 receptor alpha is elevated in sera of patients with benign ovarian neoplasms and epithelial ovarian cancer. Cancer 1995; 76: 1615–20. [DOI] [PubMed] [Google Scholar]
- 19. Shiozawa E, Yamochi‐Onizuka T, Takimoto M, Ota H. The GCB subtype of diffuse large B‐cell lymphoma is less frequent in Asian countries. Leukemia Res 2007; 31: 1579–83. [DOI] [PubMed] [Google Scholar]
- 20. Berglund M, Thunberg U, Amini RM et al . Evaluation of immunophenotype in diffuse large B‐cell lymphoma and its impact on prognosis. Mod Pathol 2005; 18: 1113–20. [DOI] [PubMed] [Google Scholar]
- 21. Van Imhoff GW, Boerma EJ, Van Der Holt B et al . Prognostic impact of germinal center‐associated proteins and chromosomal breakpoints in poor‐risk diffuse large B‐cell lymphoma. J Clin Oncol 2006; 24: 4135–42. [DOI] [PubMed] [Google Scholar]
- 22. Chang CC, McClintock S, Cleveland RP et al . Immunohistochemical expression patterns of germinal center and activation B‐cell markers correlate with prognosis in diffuse large B‐cell lymphoma. Am J Surg Pathol 2004; 28: 464–70. [DOI] [PubMed] [Google Scholar]
- 23. Saito B, Shiozawa E, Usui T et al . Rituximab with chemotherapy improves survival of non‐germinal center type untreated diffuse large B‐cell lymphoma. Leukemia 2007; 21: 2563–6. [DOI] [PubMed] [Google Scholar]
- 24. Winter JN, Weller EA, Horning SJ et al . Prognostic significance of Bcl‐6 protein expression in DLBCL treated with CHOP or R‐CHOP. A prospective correlative study. Blood 2006; 107: 4207–13. [DOI] [PMC free article] [PubMed] [Google Scholar]
- 25. Costa LJ, Feldman AL, Micallef IN et al . Germinal center B (GCB) and non‐GCB cell‐like diffuse large B cell lymphomas have similar outcomes following autologous haematopoietic stem cell transplantation. Br J Haematol 2008; 142: 404–12. [DOI] [PubMed] [Google Scholar]
- 26. Yamaguchi M, Nakamura N, Suzuki R et al . De novo CD5+ diffuse large B‐cell lymphoma: results of a detailed clinicopathological review in 120 patients. Haematologica 2008; 93: 1195–202. [DOI] [PubMed] [Google Scholar]
- 27. Ennishi D, Takeuchi K, Yokoyama M et al . CD5 expression is potentially predictive of poor outcome among biomarkers in patients with diffuse large B‐cell lymphoma receiving rituximab plus CHOP therapy. Ann Oncol 2008; 19: 1921–6. [DOI] [PubMed] [Google Scholar]
- 28. Chang CC, Liu YC, Cleveland RP, Perkins SL. Expression of c‐Myc and p53 correlates with clinical outcome in diffuse large B‐cell lymphomas. Am J Clin Pathol 2000; 113: 512–8. [DOI] [PubMed] [Google Scholar]


