

Abstract
Chemotherapy is ineffective against metastatic renal cell carcinoma (RCC). Interferon (IFN)‐α has become the most common agent used in clinical therapy to overcome this malignant tumor, although a satisfactory response has not been achieved and the mechanism of resistance of RCC to IFN‐α remains unclear. The purpose of the present study was to evaluate the susceptibility of RCC cells to IFN‐α and clarify the mechanism of IFN‐α resistance in RCC. Six RCC cell lines and three types of IFN‐α were used, and the expression, activation and effects of transfection of possible proteins or factors reported to be involved in IFN‐α signaling were examined to clarify the mechanism of resistance. The results suggest that the resistance of RCC to IFN‐α is associated with the lack of Jak1, Tyk2 and Stat1 expression and defective Jak–Stat activation, but not with a lack of IFN‐α receptor, suppressors of cytokine signaling induction or other factors examined. Moreover, phosphorylation of Jak–Stat pathway components and reversion of IFN‐α resistance in RCC were observed upon transfection with Jak1, Tyk2 or Stat1 vector. These results suggest that restoring the expression of Jak or Stat1 might strikingly increase the susceptibility of RCC to IFN‐α and may be a new strategy for improving the response of RCC to IFN‐α treatment. The Jak–Stat pathway should therefore be an appropriate target for the treatment of RCC. (Cancer Sci 2007; 98: 1259–1264)
Interferons (IFN) are a family of cytokines consisting of the multiple type I species (IFN‐α, IFN‐β, IFN‐ω and IFN‐κ) and one type II species (IFN‐γ), which elicit pleiotropic biological effects against tumors. IFN‐α may mediate antitumor effects either indirectly by modulating immunomodulatory and antiangiogenic responses or directly by antiproliferation effects and inducing the cellular differentiation of tumor cells. Both the direct and indirect effects of IFN‐α result in the induction of IFN‐stimulated genes.( 1 ) IFN‐α exerts its effects by binding to cell surface receptors and thus activating members of the Janus kinase (Jak) family. Activated Jak1 and Tyk2 can phosphorylate signal transducers and activators of transcription (Stat), and then the activated Stat proteins translocate to the nucleus and interact with specific regulatory elements to induce target gene transcription.( 2 ) However, the activation of Jak–Stat signaling induced by a wide variety of cytokines, hormones and growth factors can be impaired by suppressors of cytokine signaling (SOCS).( 3 )
Renal cell carcinoma (RCC) is the most frequent and lethal malignant tumor of the kidney in adults. Approximately 20–30% of patients present with metastatic disease at the time of diagnosis and 20–40% of patients who undergo nephrectomy for clinically localized RCC are expected to relapse at distant sites.( 4 ) Once metastatic disease develops, the prognosis is extremely poor, with 5‐year survival ranging from 0 to 20%.( 5 , 6 ) At present, IFN‐α has become a first‐line agent for treating some cancers, and treatment regimens using IFN‐α have been applied abroad in clinical therapy to overcome RCC. IFN‐α alone was reported to have a therapeutic response rate of around 26% in patients with metastatic RCC.( 7 , 8 ) Despite the relative beneficial effects of IFN‐α in RCC, a substantial proportion of patients with RCC fail to respond to IFN‐α treatment, and the mechanisms forming the basis for the resistance of RCC to IFN‐α are still not completely clear. Thus, a better understanding of the mechanisms that are responsible for a lack of response to IFN‐α would undoubtedly lead to improved use of IFN‐α in RCC.
In the present study, we investigated the antiproliferative effect of IFN‐αin vitro and established IFN‐α‐sensitive, ‐moderately sensitive and ‐resistant RCC cell lines. Deficiency of the expression of proteins in the Jak–Stat pathway was confirmed to be associated with resistance of RCC to IFN‐α, and these results demonstrate that therapy for restoring Jak or Stat1 expression should be useful for improving the rate of response of RCC to IFN‐α.
Materials and Methods
Cell culture and agents. Six RCC cell lines, ACHN, Caki‐1, Caki‐2, NC65, KY/RC‐9 and KY/RC‐17, were cultured in complete RPMI‐1640 medium (Gibco Bio‐cult, UK) supplemented with 25 mM HEPES, 2 mM l‐glutamine, 1% non‐essential amino acids, 100 units/mL penicillin, 100 µg/mL streptomycin and 10% heat‐inactivated fetal bovine serum. Cell lines were maintained as monolayers on 10‐cm plastic dishes and incubated in a humidified atmosphere containing 5% CO2 at 37°C.
Three types of IFN‐α were used, namely, Sumiferon (natural type; Sumitomo Pharmaceutical Co., Japan), Intron A (recombinant IFN‐α2b; Schering‐Plough Corporation, USA) and OIF (natural type; Otsuka Pharmaceutical Co., Japan).
WST‐1 assay. The effects of IFN‐α on RCC cells were determined using the WST‐1 assay. Exponentially growing cells were harvested and seeded at 2000 cells/well in a 96‐well microtiter plate. After 4 h incubation, IFN‐α or penicillin–streptomycin‐free medium as the untreated control were added, followed by continuous incubation for 48 h. Ten microliters of WST‐1 (Roche, Germany) was added to each well and incubation was continued for 2 h. The absorbance was measured using a microculture plate reader (Immunoreader; Japan Intermed Co., Japan) at 450 nm. The percentage cytotoxicity was calculated using the following formula:
| % cytotoxicity = (1 – [absorbance of experimental well‐ absorbance of blank]/[absorbance of untreated control well‐absorbance of blank]) × 100%. |
Reverse transcription–polymerase chain reaction and real‐time polymerase chain reaction. Total RNA was isolated using an RNeasy mini kit (Qiagen, Germany), and a first‐strand cDNA synthesis kit (Amersham Biosciences, UK) was used for reverse transcription. Polymerase chain reaction (PCR) conditions were set according to the manufacturer's instructions, and the expected size of the PCR products was confirmed by agarose gel electrophoresis. Quantitative real‐time PCR was carried out using SYBR Green PCR Master Mix (Applied Biosystems, USA), and the products of PCR were quantified with a GeneAmp 5700 Sequence Detection System (Applied Biosystems, USA). All primer sets used in the present study are shown in Table 1.
Table 1.
Primer sequences used in the present study
| Gene | Forward primer (5′→3′) | Reverse primer (5′→3′) | Length of PCR product (bp) |
|---|---|---|---|
| Jak1 | GGGGTACCCCCCACCATGCAGTATCTAAATATA | GGGGGATATCCCCCTTATTTTAAAAGTGCTTC | Full‐length coding sequence |
| Tyk2 | GGGGTACCCCCCACCATGCCTCTGCGCCACT | GGGGGATATCCCCCTCAGCACACGCTGAACA | Full‐length coding sequence |
| Stat1 | GGGGTACCCCCCACCATGTCTCAGTGGTACGA | GGGGGATATCCCCCCTATACTGTGTTCATCATA | Full‐length coding sequence |
| IFN‐AR1 | GCAGCACTACTTACGTCATG | TACGCGGAGAAGGTAAATTC | 312 |
| IFN‐AR2 | AACGTTGTTCAGTTGCTCAC | ACTGCTTGCTCATCACTGTG | 309 |
| IFN‐AR2 isoform 1 | TTTTGATAGCATTGGTCTTG | AGTTTTGGAGTCATCTCATTAT | 807 |
| IFN‐AR2 isoform 2 | CACCAGAGTTTGAGATTGT | GCTGTACTGTTTGCTCTTTATTT | 628 |
| SOCS1 | TGCTTTTTCGCCCTTAG | AAGAGGCAGTCGAAGCTC | 113 |
| SOCS2 | TTAAAACATCAGCTGGACC | ATCAG ATGAACCACACTGTC | 121 |
| SOCS3 | CCTATTACATCTACTCCGGG | TTTCTCATAGGAGTCCAGGT | 128 |
| GAPDH | GAAGGTGAAGGTCGGAGTC | GAAGATGGTGATGGGATTTC | 226 |
GAPDH, glyceraldehyde‐3‐phosphate dehydrogenase; IFN, interferon; PCR, polymerase chain reaction; SOCS, suppressors of cytokine signaling.
Western blotting. Protein was extracted and its concentration assessed using the Bradford dye‐binding protein assay (Bio‐Rad, USA), and sodium dodecyl sulfate–polyacrylamide gel electrophoresis was carried out. Phospho‐Jak1 (Tyr1022/1023) and Jak1, phospho‐Tyk2 (Tyr1054/1055) and Tyk2, phospho‐Stat1 (Tyr701) and Stat1 (9H2) antibody were purchased from Cell Signaling (Beverly, MA, USA) and anti‐β‐actin monoclonal antibody (Abcam, UK) was used as an internal control. The immune complexes were detected using the ECL plus western blotting detection system (Amersham Biosciences).
Construction of vectors and transfection. The full‐length protein coding sequence of Jak1, Tyk2 and Stat1 (GenBank accession numbers NM_002227, NM_003331 and NM_007315, respectively) were synthesized by reverse transcription (RT)‐PCR using cDNA of ACHN as substrate, and primers modified with the restriction enzyme KpnI and EcoRV sites, which are shown in Table 1. Purified PCR products were digested with KpnI and EcoRV, inserted into the mammalian expression vector pcDEF3, and confirmed by sequence analysis. RCC cell lines were transfected with these vectors or pcDEF3 alone without an insert using Lipofectamine 2000 (Invitrogen, USA) according to the manufacturer's instructions. Selection of stable clones was carried out using G418 and confirmed by western blotting and cDNA sequencing.
Statistical analysis. All determinations were repeated in triplicate, and the results were expressed as the mean ± SD. Statistical significance was determined using Student's t‐test, and a P‐value of 0.05 or less was considered significant.
Results
Susceptibility of RCC cell lines to IFN‐α. Three types of IFN‐α each caused dosage‐dependent cell growth inhibition in all of the RCC cell lines tested except Caki‐2 (Fig. 1, results for Sumiferon are shown). IFN‐α exerted its growth inhibitory activity at the low concentration of 100 IU/mL, which was around the therapeutic concentration. However, IFN‐α could not suppress the growth of Caki‐2 cells even at 1600 IU/mL (results for ACHN, Caki‐1, NC 65 and Caki‐2 are shown). No significant difference in growth inhibition was observed among the three types of IFN‐α, and only the data for Sumiferon was shown in the following experiments. The IC50 of IFN‐α in the different cell lines were as follows: ACHN, 1715 ± 145; Caki‐1, 2738 ± 187; NC 65, 2986 ± 243; KY/RC9, 2879 ± 256; and KY/RC‐17, 1825 ± 182 IU/mL. (The IC50 concentration is the concentration at which cell growth is inhibited by 50%, calculated from the regression line based on 48‐h WST‐1 assay). Based on the susceptibility of these cell lines to IFN‐α, ACHN and KY/RC‐17 were categorized as IFN‐α‐sensitive RCC cell lines, Caki‐1, NC 65 and KY/RC‐9 as moderately sensitive lines, and Caki‐2 as a resistant line.
Figure 1.

Growth inhibition by Sumiferon in renal cell carcinoma cell lines.
Expression of IFN‐α receptor in RCC cell lines. To clarify the mechanism of resistance of RCC cells to IFN‐α, we investigated the mRNA expression of IFN‐α receptor in RCC cell lines. Despite the different susceptibilities of the RCC cells to IFN‐α, the expression of IFN‐α receptor 1 (IFN‐AR1) and receptor 2 (IFN‐AR2) showed no significant difference among the six RCC cell lines, as shown using RT‐PCR (Fig. 2a, results for ACHN, Caki‐1, NC 65 and Caki‐2 are shown). The same result was also confirmed by quantitative real‐time PCR (Fig. 2b, results for ACHN, Caki‐1, NC 65 and Caki‐2 are shown). Moreover, we analyzed the expression of the two isoforms of IFN‐AR2 in RCC cell lines, and no difference was found between isoforms 1 and 2 (Fig. 2c, results for ACHN, Caki‐1, NC 65 and Caki‐2 are shown). The same result was also confirmed by real‐time PCR (Fig. 2d, results for ACHN, Caki‐1, NC 65 and Caki‐2 are shown). These findings suggest that IFN‐α susceptibility is not associated with the expression of IFN‐α receptors or IFN‐α binding sites in RCC cells.
Figure 2.
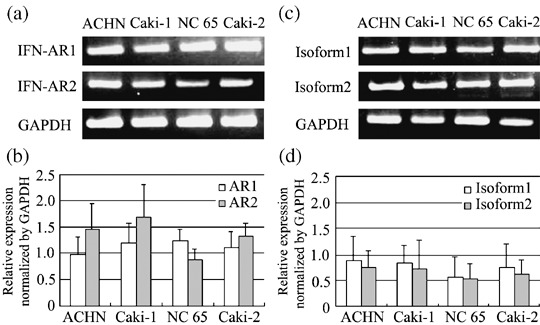
mRNA expression of the interferon (IFN)‐α receptor in renal cell carcinoma cell lines. IFN‐AR1 and ‐AR2 expression examined by (a) reverse transcription (RT)–polymerase chain reaction (PCR) and (b) real‐time PCR. mRNA expression of isoform 1 and isoform 2 of IFN‐AR2 was examined by (c) RT‐PCR and (d) real‐time PCR.
Expression of SOCS in RCC cell lines. To clarify the mechanism of resistance of RCC to IFN‐α, we examined the induction of SOCS family members by IFN‐α in six RCC cell lines. When treated with IFN‐α, high expression levels of SOCS1, SOCS2 and SOCS3 were induced in ACHN and KY/RC‐17, but no significant alteration in SOCS expression was found when other RCC cell lines were treated with IFN‐α, as shown using RT‐PCR (Fig. 3a, results for ACHN, Caki‐1, NC 65 and Caki‐2 are shown). The same results were confirmed by real‐time PCR (Fig. 3b, results for ACHN and Caki‐2 are shown). This demonstrated that SOCS does not interfere with IFN‐related signal transduction and does not participate in the resistance of RCC cells to IFN‐α.
Figure 3.

Induction of mRNA expression of suppressors of cytokine signaling by interferon‐α examined using (a) reverse transcription–polymerase chain reaction (PCR) and (b) real‐time PCR in renal cell carcinoma cell lines.
Phosphorylation of Jak–Stat pathway components by IFN‐α in RCC cell lines. We evaluated the induction of phosphorylation of Jak–Stat pathway components by IFN‐α using western blotting to clarify the mechanism of resistance of RCC cells to IFN‐α. Jak1, Tyk2 and Stat1 were expressed at high levels and significantly phosphorylated in ACHN and KY/RC‐17 when they were treated with 50 or 100 IU/mL IFN‐α for 30 min. However, Stat1 was expressed and activated at a more moderate level by IFN‐α in the three IFN‐α moderately sensitive RCC cell lines compared with ACHN and KY/RC‐17. In Caki‐2, an IFN‐α‐resistant RCC cell line, although expression of Stat1 was observed at a level similar to that in ACHN and KY/RC‐17, no phosphorylation was found when the Caki‐2 cells were treated with IFN‐α. Moreover, neither protein expression nor phosphorylation of Jak1 and Tyk2 induced by IFN‐α were observed in Caki‐2 (Fig. 4, results for ACHN, Caki‐1, NC 65 and Caki‐2 are shown). The same results were confirmed using two other types of IFN‐α, Intron A and OIF (data not shown). These results suggest that deficiency in the Jak–Stat pathway might contribute to the resistance of RCC cells to IFN‐α treatment.
Figure 4.

Tyrosine phosphorylation of the Jak–Stat pathway in renal cell carcinoma cell lines treated with interferon‐α.
Effect of restoring Jak–Stat on susceptibility of RCC cells to IFN‐α. The susceptibility of Caki‐2 transfected with Jak1 or Tyk2 vector to IFN‐α was evaluated. In transfected Caki‐2, Jak1, Tyk2 and Stat1 were significantly phosphorylated when the cells were treated with 50 or 100 IU/mL IFN‐α for 30 min compared to phosphorylation in the mock‐transfected line (Fig. 5a,b). Moreover, resistance to IFN‐α was also reversed and dose‐dependent growth suppression was observed in the transfected Caki‐2 (Fig. 5c). We also examined the susceptibility of Caki‐1 and NC 65 transfected with Stat1 vector. In these transfected lines, higher Stat1 phosphorylation was observed after treatment with 100 IU/mL IFN‐α for 30 min (Fig. 6a), and higher susceptibility to IFN‐α was found compared to those in the mock‐transfected lines (Fig. 6b).
Figure 5.

Tyrosine phosphorylation of Stat1 is increased in Caki‐2 transfected with (a) Jak1 or (b) Tyk2 vector, and (c) resistance of Caki‐2 to interferon‐α is also reversed by transfection.
Figure 6.

(a) Higher tyrosine phosphorylation of Stat1 is induced by interferon (IFN)‐α in Caki‐1 and NC 65 transfected with Stat1 vector, and (b) susceptibility of Caki‐1 and NC 65 to IFN‐α is also increased by transfection.
Discussion
Although IFN‐α therapy is the most common option for treating metastatic RCC at present, this treatment does not achieve a satisfactory response rate, and the mechanism of resistance remains obscure. In the present study, we evaluated the susceptibility of six RCC cell lines to three types of IFN‐α, and demonstrated that expression of Jak1, Tyk2 and Stat1 is required for the sensitivity of RCC to IFN‐α. The proteins in the Jak–Stat pathway were expressed at a high level in IFN‐α‐sensitive RCC cell lines, whereas they were expressed at lower levels and could not be phosphorylated effectively in IFN‐α‐resistant and ‐moderately sensitive RCC lines. Restoring the expression of Jak1, Tyk2 or Stat1 in IFN‐α‐resistant or ‐moderately sensitive RCC lines could reverse the resistance to IFN‐α. The effect of three types of IFN‐α showed the same conclusion in all analyses in our study and the data from three types of IFN‐α was reproducible.
We examined other possible factors affecting IFN‐α signaling, such as IFN‐α receptor, SOCS and protein tyrosine phosphatase (PTP), and eliminated these as possible causes of the resistance of RCC to IFN‐α. The type I IFN receptor is composed of two subunits, IFN‐AR1 and IFN‐AR2, encoding transmembrane polypeptides. IFN‐AR1 contributes to signal transduction,( 9 ) whereas IFN‐AR2 has a dominant role in ligand binding.( 10 ) The resistance of RCC cells to IFN‐α's antiproliferative action was previously reported not to be due to defects in IFN‐AR1.( 11 ) In our study, neither IFN‐AR1 nor AR2 showed differences of expression and no mutation was detected using cDNA sequencing in any of the RCC cell lines examined. In addition, IFN‐AR2 occurs in multiple isoforms, including a full‐length transmembrane receptor (isoform 1), a transmembrane receptor with a truncated cytoplasmic domain (isoform 2), and a soluble isoform (isoform 3). The results of one study suggested that isoform 2 is a non‐functional variant,( 12 ) whereas another study suggested a dominant‐negative role of isoform 2, and that different ratios of isoform 1 versus isoform 2 could account for differences in the response to IFN‐α treatment.( 13 ) In our study, despite the different susceptibilities of RCC cell lines to IFN‐α, the expression levels of isoform 1 and isoform 2 did not show significant differences.
Several studies have demonstrated that SOCS1, SOCS2 and SOCS3 inhibit IFN‐α induced activation of the Jak–Stat pathway,( 14 , 15 ) and one study showed that an IFN‐α‐resistant cell line exhibited enhanced SOCS3 mRNA expression in response to IFN stimulation, and that blocking SOCS3 partially restored IFN sensitivity.( 16 ) In our study, the expression of SOCS was not upregulated by IFN‐α in IFN‐α‐resistant RCC cell lines, and the expression of SOCS was not involved in the resistance of RCC to IFN‐α. The Jak–Stat pathway is also negatively regulated by PTP.( 17 , 18 ) We found that PTP inhibitor II enhanced the phosphorylation of Jak1, Tyk2 and Stat1 in IFN‐α‐sensitive RCC cell lines treated with IFN‐α, but could not activate the Jak–Stat pathway in IFN‐α‐resistant RCC cell lines (data not shown). This suggests that suppressing PTP activity might increase susceptibility to IFN‐α in Jak–Stat‐expressing RCC, but PTP was not associated with IFN‐α resistance in the defective Jak–Stat‐expressing RCC lines. Moreover, Jak inhibitor I, a potent inhibitor of Jak1 and Tyk2 activity, was used to analyze Jak activity and the effect on the susceptibility to IFN‐α in RCC cell lines. In IFN‐α‐sensitive RCC lines with high Jak expression, significant resistance to IFN‐α was induced by Jak inhibitor I, but no impact of this inhibitor on the antiproliferative effects of IFN‐α was observed in IFN‐α‐resistant RCC cell lines (data not shown). This suggests that Jak deficiency prevents IFN‐α signal transduction and leads to IFN‐α resistance in RCC.
Regulated intramembrane proteolysis (RIP) has emerged as a mechanistically simple and evolutionarily conserved mechanism for relaying a signal from a membrane surface to the nucleus.( 19 , 20 ) IFN‐AR2 can be proteolytically cleaved in response to IFN‐α, releasing the extracellular domain and generating a stub and intracellular domain, whose cleavage can block the tyrosine phosphorylation of Jak–Stat components by IFN‐α.( 21 ) Only a minor fraction of the total IFN‐AR2 seems to be cleaved and obvious proteolysis only appeared after 2 h treatment; the role of RIP of IFN‐AR2 in RCC cells remains unclear. Moreover, the released extracellular domain and soluble isoform 3 of IFN‐AR2 could bind and neutralize extracellular IFN‐α and attenuate its antiproliferative activity. In addition, some autocrine and paracrine growth factors in RCC were reported to participate in regulating the Jak–Stat pathway.( 22 , 23 , 24 ) Thus, the relationship of the peptide released by RIP, soluble isoform 3 of IFN‐AR2, excreted growth factors and IFN‐α resistance of Caki‐2 were investigated. When ACHN cells were incubated with IFN‐α diluted with conditioned medium of 24 h continually cultured Caki‐2 or with IFN‐α used to treat Caki‐2 cells, the phosphorylation of Jak–Stat pathway components was not decreased compared to that in ACHN cells treated with IFN‐α directly (data not shown). Thus, excreted proteins or RIP did not appear to cause IFN‐α resistance in RCC.
Stat3 is another transcription factor that can be activated by IFN‐α. Although Stat3 was also reported to have antiproliferative and antioncogenic effects,( 25 ) it mainly appears to play a critical role in cell proliferation, differentiation and survival.( 26 , 27 ) In the present study, Stat3 was also activated by IFN‐α in parallel to the phosphorylation of Stat1 in all six RCC cell lines, which implies that the lack of Jak prevents normal signal transduction of IFN‐α in Caki‐2. We speculate that different ratios of Stat1 versus Stat3 could account for the different responses to IFN‐α, and blocking Stat3 might increase the susceptibility of RCC to IFN‐α. Although IFN‐α mediates immune modulation against renal tumors in vivo,( 28 , 29 ) IFN‐α also protects RCC cells from lysis by activated natural killer cells.( 30 ) The in vitro response was not relevant to in vivo efficacy in clinical RCC, so a study with clinical RCC samples should be encouraged to clarify the role of Jak–Stat in IFN‐α resistance. Although a previous study that focused on Stat1 showed that low phosphorylation of Stat1 by IFN‐α participated in IFN‐α resistance, phosphorylation of the Jak family has not been reported previously.( 31 ) The resistance of RCC to IFN‐α is complex and elusive; IFN‐α signaling transduction and IFN‐α‐stimulated genes were commonly analyzed, but no one mechanism could explain the total resistance of RCC to IFN‐α. Although Shimazui et al. suggested that the protein level of Jak–Stat is independent of IFN‐α sensitivity,( 32 ) in our study the expression of Jak–Stat is associated with IFN‐α resistance, and suggests a new reason for IFN‐α resistance.
In conclusion, we examined various possible mechanisms of resistance to IFN‐α in RCC, and concluded that defective Jak–Stat activation is associated with the resistance of RCC to IFN‐α. Our results suggest that restoring the expression of Jak and Stat1 should be useful for improving the response rate to IFN‐α against RCC, and that the Jak–Stat pathway might be an appropriate target for the treatment of RCC.
Acknowledgments
This study was supported by a grant from the Ministry of Education, Culture, Sports, Science and Technology, Japan.
References
- 1. Stark GR, Kerr IM, Williams BRG, Silverman RH, Schreiber RD. How cells respond to interferons. Ann Rev Biochem 1998; 67: 227–64. [DOI] [PubMed] [Google Scholar]
- 2. Darnell JE Jr, Kerr IM, Stark GR. Jak‐STAT pathways and transcriptional activation in response to IFNs and other extracellular signaling proteins. Science 1994; 264: 1415–21. [DOI] [PubMed] [Google Scholar]
- 3. Kile BT, Alexander WS. The suppressors of cytokine signalling (SOCS). Cell Mol Life Sci 2001; 58: 1627–35. [DOI] [PMC free article] [PubMed] [Google Scholar]
- 4. Janzen NK, Kim HL, Figlin RA, Belldegrun AS. Surveillance after radical or partial nephrectomy for localized renal cell carcinoma and management of recurrent disease. Urol Clin North Am 2003; 30: 843–52. [DOI] [PubMed] [Google Scholar]
- 5. Lanigan D. Prognostic factors in renal cell carcinoma. Br J Urol 1995; 75: 565–71. [DOI] [PubMed] [Google Scholar]
- 6. Jemal A, Siegel R, Ward E et al . Cancer statistics 2006. CA Cancer J Clin 2006; 56: 106–30. [DOI] [PubMed] [Google Scholar]
- 7. Swanson DA, Quesada JR. Interferon therapy for metastatic renal cell carcinoma. Semin Surg Oncol 1988; 4: 174–7. [DOI] [PubMed] [Google Scholar]
- 8. Bex A, Kerst M, Mallo H et al . Interferon alpha 2b as medical selection for nephrectomy in patients with synchronous metastatic renal cell carcinoma: a consecutive study. Eur Urol 2006; 49: 76–81. [DOI] [PubMed] [Google Scholar]
- 9. Bousquet C, Zatelli MC, Melmed S. Direct regulation of pituitary proopiomelanocortin by STAT3 provides a novel mechanism for immuno‐neuroendocrine interfacing. J Clin Invest 2000; 106: 1417–25. [DOI] [PMC free article] [PubMed] [Google Scholar]
- 10. Owczarek CM, Hwang SY, Holland KA et al . Cloning and characterization of soluble and transmembrane isoforms of a novel component of the murine type I interferon receptor, IFNAR 2. J Biol Chem 1997; 272: 23 865–70. [DOI] [PubMed] [Google Scholar]
- 11. Pfeffer LM, Wang C, Constantinescu SN et al . Human renal cancers resistant to IFN's antiproliferative action exhibit sensitivity to IFN's gene‐inducing and antiviral actions. J Urol 1996; 156: 1867–71. [PubMed] [Google Scholar]
- 12. Pfeffer LM, Basu L, Pfeffer SR et al . The short form of the interferon alpha/beta receptor chain 2 acts as a dominant negative for type I interferon action. J Biol Chem 1997; 272: 11 002–5. [DOI] [PubMed] [Google Scholar]
- 13. Gazziola C, Cordani N, Carta S, De Lorenzo E, Colombatti A, Perris R. The relative endogenous expression levels of the IFNAR2 isoforms influence the cytostatic and pro‐apoptotic effect of IFNα on pleomorphic sarcoma cells. Int Oncol 2005; 26: 129–40. [PubMed] [Google Scholar]
- 14. Vlotides G, Sorensen AS, Kopp F et al . SOCS‐1 and SOCS‐3 inhibit IFN‐α‐induced expression of the antiviral proteins 2,5‐OAS and MxA. Biochem Biophys Res Commun 2004; 320: 1007–14. [DOI] [PubMed] [Google Scholar]
- 15. Shen X, Hong F, Nguyen VA, Gao B. IL‐10 attenuates IFN‐α‐activated STAT1 in the liver: involvement of SOCS2 and SOCS3. FEBS Lett 2000; 480: 132–6. [DOI] [PubMed] [Google Scholar]
- 16. Zhu H, Nelson DR, Crawford JM, Liu C. Defective Jak–Stat activation in hepatoma cells is associated with hepatitis C viral IFN‐α resistance. J Interferon Cytokine Res 2005; 25: 528–39. [DOI] [PubMed] [Google Scholar]
- 17. Hackett RH, Wang YD, Sweitzer S, Feldman G, Wood WI, Larner AC. Mapping of a cytoplasmic domain of the human growth hormone receptor that regulates rates of inactivation of Jak2 and Stat proteins. J Biol Chem 1997; 272: 11 128–32. [DOI] [PubMed] [Google Scholar]
- 18. Stofega MR, Herrington J, Billestrup N, Carter‐Su C. Mutation of the SHP‐2 binding site in growth hormone (GH) receptor prolongs GH‐promoted tyrosyl phosphorylation of GH receptor, JAK2, and STAT5B. Mol Endocrinol 2000; 14: 1338–50. [DOI] [PubMed] [Google Scholar]
- 19. Brown MS, Ye J, Rawson RB, Goldstein JL. Regulated intramembrane proteolysis: a control mechanism conserved from bacteria to humans. Cell 2000; 100: 391–8. [DOI] [PubMed] [Google Scholar]
- 20. Weihofen A, Martoglio B. Intramembrane‐cleaving proteases: controlled liberation of proteins and bioactive peptides. Trend Cell Biol 2003; 13: 71–8. [DOI] [PubMed] [Google Scholar]
- 21. Saleh AZ, Fang AT, Arch AE, Neupane D, El Fiky A, Krolewski JJ. Regulated proteolysis of the IFNaR2 subunit of the interferon‐alpha receptor. Oncogene 2004; 23: 7076–86. [DOI] [PubMed] [Google Scholar]
- 22. Horiguchi A, Oya M, Marumo K, Murai M. STAT3, but not ERKs, mediates the IL‐6‐induced proliferation of renal cancer cells, ACHN and 769P. Kidney Int 2002; 61: 926–38. [DOI] [PubMed] [Google Scholar]
- 23. Zhang YW, Wang LM, Jove R, Vande Woude GF. Requirement of Stat3 signaling for HGF/SF‐Met mediated tumorigenesis. Oncogene 2002; 21: 217–26. [DOI] [PubMed] [Google Scholar]
- 24. Tejman‐Yarden N, Zlotnik M, Lewis E, Etzion O, Chaimovitz C, Douvdevani A. Renal cells express a functional interleukin‐15 receptor. Nephrol Dial Transplant 2005; 20: 516–23. [DOI] [PubMed] [Google Scholar]
- 25. Schick N, Oakeley EJ, Hynes NE, Badache A. TEL/ETV6 is a signal transducer and activator of transcription 3 (Stat3)‐induced repressor of Stat3 activity. J Biol Chem 2004; 279: 38 787–96. [DOI] [PubMed] [Google Scholar]
- 26. Hirano T, Ishihara K, Hibi M. Roles of STAT3 in mediating the cell growth, differentiation and survival signals relayed through the IL‐6 family of cytokine receptors. Oncogene 2000; 19: 2548–56. [DOI] [PubMed] [Google Scholar]
- 27. Barton BE, Karras JG, Murphy TF, Barton A, Huang HF. Signal transducer and activator of transcription 3 (STAT3) activation in prostate cancer: Direct STAT3 inhibition induces apoptosis in prostate cancer lines. Mol Cancer Ther 2004; 3: 11–20. [PubMed] [Google Scholar]
- 28. Verra N, De Jong D, Bex A et al . Infiltration of activated dendritic cells and T cells in renal cell carcinoma following combined cytokine immunotherapy. Eur Urol 2005; 48: 527–33. [DOI] [PubMed] [Google Scholar]
- 29. Wersall P, Mellstedt H. Increased LAK and T cell activation in responding renal cell carcinoma patients after low dose cyclophosphamide, IL‐2 and α‐IFN. Med Oncol 1995; 12: 69–77. [DOI] [PubMed] [Google Scholar]
- 30. Imai T, Katagiri A, Saito K, Tomita Y. Interferon‐α‐induced protection of renal cell cancer cell line from lysis by natural killer cells and increase of susceptibility by treatment with 5‐fluorouracil. Cancer Lett 1995; 94: 191–7. [DOI] [PubMed] [Google Scholar]
- 31. Brinckmann A, Axer S, Jakschies D et al . Interferon‐α resistance in renal carcinoma cells is associated with defective induction of signal transducer and activator of transcription 1 which can be restored by a supernatant of phorbol 12‐myristate 13‐acetate stimulated peripheral blood mononuclear cells. Br J Cancer 2002; 86: 449–55. [DOI] [PMC free article] [PubMed] [Google Scholar]
- 32. Shimazui T, Ami Y, Yoshikawa K et al . Prediction of in vitro response to interferon‐α in renal cell carcinoma cell lines. Cancer Sci 2007; 98: 529–34. [DOI] [PMC free article] [PubMed] [Google Scholar]