

Abstract
Through analysis of the detailed genome‐wide gene expression profiles of 81 breast tumors, we identified a novel gene, G‐patch domain containing 2 (GPATCH2), that was overexpressed in the great majority of breast cancer cases. Treatment of breast cancer cells MCF‐7 and T47D with siRNA against GPATCH2 effectively suppressed its expression, and resulted in the growth suppression of cancer cells, suggesting its essential role in breast cancer cell growth. We found an interaction of GPATCH2 protein with hPrp43, an RNA‐dependent ATPase. Their interaction could significantly enhance the ATPase activity of hPrp43 and induce a growth‐promoting effect on mammalian cells. Because northern blot analyses of normal human organs implied GPATCH2 to be a novel cancer/testis antigen, targeting GPATCH2 or inhibition of the interaction between GPATCH2 and hPrp43 could be a promising novel therapeutic strategy of breast cancer. (Cancer Sci 2009)
Breast cancer is the most common with an estimated 1.15 million new cases worldwide in 2002.( 1 ) Although the incidence of breast cancer has been significantly increasing, its mortality rate in developed countries has decreased as a result of a range of measures, including implementation of screening, improvements in the local management of patients with early breast cancer, and the introduction of adjuvant treatments.( 2 , 3 , 4 ) Cancer therapies such as tamoxifen, aromatase inhibitors, and trastuzumab (Herceptin) that are directed at specific molecular targets have proven to be effective for treatment of advanced breast cancer.( 5 ) The former two drugs suppress the estrogen‐related signaling pathway and trastuzumab is a monoclonal antibody that blocks the human epidermal growth factor 2 (HER‐2, ErbB‐2) signaling pathway.( 5 , 6 ) Hence, patients with tumors that express estrogen or HER‐2 receptors can have benefits with either of these therapies and are expected to have a better quality of life and prognosis. However, increases in the risk of endometrial cancer with long‐term tamoxifen administration and severe cardiac toxicity with trastuzumab treatment, as well as the risk of bone fracture due to osteoporosis in postmenopausal women with aromatase inhibitor prescription are recognized side effects.( 2 , 3 , 4 , 5 , 6 ) Due to the emergence of side effects and drug resistance to these drugs as well as the lack of an effective treatment modality for triple‐negative breast cancer, it is necessary to search for novel drugs with well‐characterized mechanisms of action.
Gene expression profiles obtained by cDNA microarray analysis were proven to provide detailed characterization of individual cancers and such information should contribute to choosing more appropriate clinical strategies for individual patients through providing the basis of personalized treatment and development of novel drugs.( 7 ) Through the genome‐wide expression analysis we identified a number of genes that function as oncogenes in breast cancers and reported candidate molecular targets that could be applicable for the development of breast cancer therapy.( 8 , 9 , 10 , 11 , 12 , 13 ) In the present paper, we report the identification and characterization of G‐patch domain containing 2 (GPATCH2), which was significantly overexpressed in a great majority of breast cancer cases.
The G‐patch domain motif, which is a pattern of conserved glycines, is conserved among eukaryotes( 14 ) and is suspected to possess RNA‐binding affinity; in fact, some proteins containing the G‐patch domain have been implicated in RNA processing roles.( 14 ) Moreover, the G‐patch motif was found in splicing factor 45 and other DNA‐binding proteins.( 14 , 15 ) Thus, proteins containing the G‐patch domain might regulate a broad range of cellular functions. Although the GPATCH2 protein contains a highly conserved G‐patch domain, its pathophysiological roles and biological functions in breast cancer cells are totally unknown.
Here we report overexpression of GPATCH2 in breast cancer cells and its undetectable level of expression in normal human tissues except testis. We further demonstrated that downregulation of GPATCH2 expression resulted in significant growth suppression of breast cancer cells. In addition, we demonstrated that GPATCH2 interacted with hPrp43, which is a human ortholog of yeast Prp43, and drastically enhanced the ATPase activity of hPrp43. Our findings shown in this paper suggest that GPATCH2 might play critical roles in tumor cell growth and be a promising target for the development of anticancer drugs for breast cancer.
Materials and Methods
Cell lines and tissue samples. The human breast cancer cell lines MCF‐7 and T47D, as well as the African green monkey kidney fibroblast cell line COS‐7 and human fetal kidney cell line HEK 293T, were purchased from American Type Culture Collection (Rockville, MD, USA) and cultured under their respective depositors’ recommendations. All cells were cultured according to previous reports.( 9 , 10 , 11 , 12 , 13 ) Tissue samples from surgically resected breast cancers and their corresponding clinical information were obtained from the Department of Breast Surgery, Cancer Institute Hospital, Tokyo after obtaining written informed consent. This study as well as the use of all clinical materials described above were approved by individual institutional Ethical Committees.
Semiquantitative RT‐PCR. Total RNA was extracted from each microdissected breast cancer clinical sample and microdissected normal breast ductal cells using RNeasy Micro Kits (Qiagen, Valencia, CA, USA) as described previously.( 8 ) PolyA(+) RNA isolated from mammary gland, lung, liver, and heart were purchased from Takara Clontech (Kyoto, Japan). Subsequently, T7‐based amplification and reverse transcription reactions were carried out as described previously.( 8 ) We prepared appropriate dilutions of each single‐stranded cDNA for subsequent PCR by monitoring the amount of glyceraldehyde‐3‐phosphate dehydrogenase (GAPDH) as a quantitative control. The sequences of each set of primers were as follows: 5′‐TGTGTCAATACTTTCCGATGCT‐3′ and 5′‐TGGTGATAACAACGATGAGGTT‐3′ for GPATCH2; 5′‐CGACC ACTTTGTCAAGCTCA‐3′ and 5′‐GGTTGAGCACAGGGTACT TTATT‐3′ for GAPDH.
Northern blot analysis. Human multiple‐tissue northern blots (Clontech, CA, USA) were hybridized with (α32P)‐dCTP‐labeled PCR products of GPATCH2 with the megaprime DNA labeling system (GE Healthcare, Buckinghamshire, UK) The cDNA probes of GPATCH2 were prepared by RT‐PCR using the following primers: forward 5′‐TGGGTAACAAGAGAATGGTT‐3′ and reverse 5′‐ATCCAAGTCCTAATCCCTTTGG‐3′. Pre‐hybridization, hybridization, and washing were carried out as described previously.( 16 ) The blots were autoradiographed with intensifying screens at –80°C for 14 days.
Plasmid constructions. We obtained an open reading frame sequence of GPATCH2 by RT‐PCR using KOD‐Plus DNA polymerase (Toyobo, Osaka, Japan) with the following primer set: forward 5′‐AAAGAATTCGGGTGTCGTTAATGTTCGGGG‐3′ and reverse 5′‐AAAGCGGCCG CTTAGGCGGATTTTCCTGCA‐3′ (the restriction enzyme sites are underlined). The PCR product was cloned into the EcoRI and NotI sites of the pCMV‐myc vector (Takara Clontech) in frame with a myc‐tag at the N‐terminus. For generation of recombinant protein, the open reading frame of GPATCH2 was cloned into the EcoRI and NotI sites of the pET21c vector in frame with an N‐terminal T7‐tag and C‐terminal 6 × His‐tag (Merck, Novagen, Madison, WI, USA). For construction of the hPrp43 expression vector, the entire coding sequence of hPrp43 cDNA was generated by RT‐PCR using the following primers: forward 5′‐AGAATGCGGCCGCACTATGTCCAAGCGGCA CCGGT‐3′ and reverse 5′‐TCCGCTCGAGCGTTCATCTTTT AAAGCTGTCCTCT‐3′. The PCR product was cloned into the NotI site of the pCAGGSn3FH vector in frame with a Flag‐tag at the N‐terminus by the blunt‐end ligation method. The DNA sequences of all constructs were confirmed by DNA sequencing (ABI3700; PE Applied Biosystems, Foster, CA, USA).
Gene silencing effect by siRNA. We had previously established a vector‐based RNAi expression system using the psiU6‐siRNA expression vector as described previously.( 17 ) The target sequence of synthetic oligonucleotides for siRNA were as follows: si‐scramble (si‐sc), 5′‐TCCCGCGCGCTTTGTAGGATTCGTTCAAGAG ACGAATCCTACAAAGCGCGC‐3′ and 5′‐AAAAGCGCGCTT TGTAGGATTCGTCTCTTGAACGAATCCTACAAAGCGCGC‐3′; GPATCH2 (si‐1), 5′‐TCCCGTATATCTTGCCCTCTGAATTC AAGAGATTCAGAGGGCAAGATATAC‐3′ and 5′‐AAAAG TATA TCTTGCCCTCTGAATCTCTTGAATTCAGAGGGCAAGATAT AC‐3′; GPATCH2 (si‐2), 5′‐TCCCTATTGGAAACCGAATGCTT TTCAAGAGAAAGCATTCGGTTTCCAATA‐3′ and 5′‐AAAATA TTGGAAACCGAATGCTTTCTCTTGAAAAGCATTCGGTTT CCAATA‐3′; si‐hPrp43 (si‐1), 5′‐TCCCGCAGCAATTC GAACAGTTATTCAAGAGATAACTGTTCGAATTGCTGC‐3′ and 5′‐AAAAGCAGCAATTCGAACAGTTATCTCTTGAATAA CTGTTCGAATTGCTGC‐3′; and si‐hPrp43 (si‐2), 5′‐TCCCGAGGGAGATCTTCTTCTTTTTCAAGAGAAAAGAAG AAGATCTCCCTC‐3′ and 5′‐AAAAGAGGGAGATCTTCTTCTT TTCTCTTGAAAAAGAAGAAGATCTCCCTC‐3′.
The human breast cancer cell lines T47D and MCF‐7 were plated in 15‐cm dishes (4 × 10⁶ cells/dish), and transfected with 16 µg each of psiU6BX3.0‐SC (si‐#SC) or psiU6BX3.0‐GPATCH2 (si#1 and si#2) using FuGENE6 transfection reagent (Roche, Mannheim, Germany). After 24 h of transfection, cells were reseeded for the use of RT‐PCR (1 × 10⁶ cells/dish), colony formation assay (3 × 10⁶ cells/dish), and MTT assay (2 × 10⁵ cells/well). We selected the psiU6BX3.0‐introduced T47D or MCF‐7 cells in medium containing 0.7 or 0.6 mg/mL neomycin (Geneticin; Invitrogen, Carlsbad, CA, USA). To evaluate the effect of siRNA by semiquantitative RT‐PCR, total RNA was extracted from the transfected cells after a 7‐day incubation with geneticin. The specific primer sets used for semiquantitative RT‐PCR were as follows: 5′‐TTAG CTGTGCTCGCGCTACT‐3′ and 5′‐TCACATGGTTCACACGGC AG‐3′ for β2‐microgloblin; 5′‐TTAAGTGAAGGCTCTGATTCTA GTT‐3′ and 5′‐GTCCTTATTGGTCTGGTTCGTT‐3′ for GPATCH2; and 5′‐TTGTACTGGTTGGTGAGACTGG‐3′ and 5′‐CAACTC TGATTCGAGGATTG‐3′ for DDX15/hPrp43. T47D or MCF‐7 cells expressing siRNA were grown for 3 weeks in medium containing 0.7 or 0.6 mg/mL neomycin, and then fixed with 100% methanol for 10 min at room temperature before staining with Giemsa's solution (Merck, Whitehouse Station, NJ, USA) to assess colony formation. To quantify cell viability, an MTT assay was carried out with cell‐counting kit 8 (Dojindo Molecular Laboratories, Kumamoto, Japan) at 7 days after transfection according to the manufacturer's recommendation.
Generation of recombinant protein. The recombinant GPATCH2 protein was expressed in Escherichia coli strain BL21 codon‐plus (DE3) RIL competent cells (Stratagene, La Jolla, CA, USA), and purified using Ni‐NTA resin agarose beads (Qiagen, Hilden, Germany) under denaturing conditions according to the supplier's protocol. Subsequently, the denatured GPATCH2 protein was refolded using the buffer according to previous reports.( 18 , 19 ) Briefly, the protein was lysed with lysis buffer under denaturing condition (0.1 M NaHCO3, 0.5 M NaCl, pH 7.5, 8.0 M urea) and then refolded using the buffer (0.1 M NaHCO3, 0.5 M NaCl, pH 7.5 and 0.1 M arginine) by gradual removal of urea by means of stepwise dialysis from 8 to 0 M though 4, 2, 1, and 0.5 M.
Immunoprecipitation and mass spectrometry. HEK 293T cells (4 × 10⁶ cells/dish in 15‐cm dishes) were transiently transfected with 8 µg pCMV‐myc‐GPATCH2 or pCMV‐myc‐Mock (without insert) vector using FuGENE6 transfection reagent. After a 36‐h incubation, the cells were lysed with 0.1% Nonidet P‐40 (NP‐40) lysis buffer. The cell lysates were precleared with normal mouse IgG and rec‐Protein A Sepharose 4B (Zymed, San Francisco, CA, USA) at 4°C for 30 min with rotation. After centrifugation at 7 720 g for 5 min at 4°C, the supernatants were incubated at 4°C with 1 µg anti‐myc antibodies (9E10; Santa Cruz Biotechnology, Santa Cruz, CA, USA) and 30 µg Protein A Sepharose 4B beads for 12 h with rotation. After the beads were collected from each sample by centrifugation at 1 930 g for 2 min and washed five times with lysis buffer, immunoprecipitates were resuspended in 30 µL Laemmli SDS sample buffer and boiled for 3 min before the proteins were separated on 7.5% discontinuous SDS‐PAGE gels (Invitrogen). After electrophoresis, proteins in SDS‐PAGE gels were silver‐stained using the SilverQuest Silver Staining Kit (Invitrogen) according to the manufacturer's instructions. Bands that were specifically observed in the GPATCH2‐transfected lane were excised with a clean, sharp scalpel and the extracted proteins were used for peptide mass fingerprint analysis by MALDI‐TOF‐MS (Shimadzu Biotech, Tsukuba, Japan). To confirm the interaction between GPATCH2 and hPrp43, we carried out immunoprecipitation experiments as follows. HEK 293T cells were cotransfected with 4 µg each of pCMV‐myc‐GPATCH2 and pCAGGS‐Flag‐hPrp43 vectors using FuGENE6 transfection reagent. Thirty‐six hours later, cells were lysed with 1% NP‐40, followed by immunoprecipitation with anti‐myc (9E10) or anti‐Flag M2 antibodies (Santa Cruz). The immunoprecipitation was examined by western blot analysis with antimyc antibody (A‐14; Santa Cruz) or rabbit anti‐Flag antibody (Santa Cruz).
Western blot analysis. For confirmation of protein interaction, proteins were separated on 10% SDS gels before being transferred to nitrocellulose membrane (GE Healthcare). Membranes were blocked with BlockAce (Dainippon Pharmaceutical, Osaka, Japan) for 1 h at room temperature followed by incubation with anti‐myc antibody (9E10) or anti‐hPrp43 antibody (Abcam, Cambridge, MA, USA). Visualization of blots was carried out using ECL Detection Reagent kit (GE Healthcare).
Immunocytochemical staining analysis. HEK 293T cells were transfected with either 1 µg pCMV‐myc‐GPATCH2 or pCAGGS‐Flag‐hPrp43 or both vectors. After 36 h of transfection, cells were fixed with 4% paraformaldehyde for 30 min at 4°C before treatment with 0.1% Triton X‐100 for 3 min. Cells were subsequently blocked with 3% bovine serum albumin (BSA) for 1 h and incubated with anti‐myc antibody (9E10), anti‐Flag antibody, or both antibodies (diluted 1:1000 in 3% BSA). Following incubation with Alexa‐488 (mouse) or Alexa‐594 (rabbit) secondary antibodies, the cells were analyzed by confocal microscopy (Leica TCS SP2, Exton, PA, USA).
Cell proliferation assay. To examine the effect of GPATCH2 and hPrp43 on cell growth, COS‐7 cells (2.0 × 10⁴ cells/well in 12‐well plates) were transiently transfected with pCAGGS‐hPrp43–3 × FLAG, pCAGGS‐GPATCH2‐HA, or both using FuGENE6 transfection reagent, and maintained in serum‐free DMEM. After a 7‐day incubation, cell viability was measured by MTT assay using cell‐counting kit 8.
ATPase assay. To prepare the immunoprecipitated hPrp43 for ATPase assay, HEK 293T cells were transfected with 16 µg pCAGGS‐Flag‐hPrp43 vector or pCAGGS‐Flag‐mock vector as a negative control using FuGENE6 transfection reagent according to the manufacturer's instructions. Forty‐eight hours after transfection, protein was immunoprecipitated using 30 µL Flag‐M2‐conjugated agarose (Sigma, St Louis, MO, USA). Immunoprecipitated protein was eluted with 100 µL 3 × Flag peptides in lysis buffer. Protein concentrations were determined using the Bio‐Rad DC protein assay kit (Bio‐Rad, Hercules, CA) with BSA as the standard. The ATPase buffer (70 µL) containing 45 mM Tris‐HCl (pH 8.0), 25 mM NaCl, 2.2 mM DTT, 1 mM MgCl2, 0.6 µM (γ‐32P)ATP (770 MBq/mL), 50 µM cold ATP, 0.6 mM poly(A) (measured as the concentration of AMP) (GE Healthcare), 0.01% Triton X‐100, and 0.1 mM EDTA was mixed with 30 µL hPrp43 (3 µg) and GPATCH2 (3 µg). The reaction mixture was incubated for 1 h at 30°C. An aliquot (5 µL) of each reaction was removed at 10‐min intervals and then stopped by the addition of 200 µL of a 5% (w/v) suspension of activated charcoal in 20 mM phosphoric acid. The mixtures were further incubated on ice for 10 min, followed by filtration with a 0.22‐µm Ultrafree Centrifugal Filter Device (Millipore). The radioactivity of 32P in the supernatant (5 µL) was quantified by a liquid scintillation counter. All values are averages from two independent experiments.
Results
GPATCH2 transactivation in breast cancer cells. To elucidate the molecular mechanisms of breast carcinogenesis and identify molecules that could be targets for the development of novel therapeutic drugs, we previously carried out genome‐wide gene expression profile analysis of 81 clinical breast cancers.( 8 ) Among dozens of upregulated genes, we focused on the novel gene GPATCH2 whose expression was upregulated (>3‐fold more than normal ductal cells) in 17 of the 42 informative breast cancers. We confirmed the elevated GPATCH2 expression in 7 of 11 breast cancer cases by semiquantitative RT‐PCR analysis (Fig. 1a). Subsequent northern blot analysis using mRNA from normal human tissues confirmed that an approximately 2.4‐kb transcript of GPATCH2 was hardly detectable in any of 23 normal human organs examined except the testis (Fig. 1b), suggesting GPATCH2 to be a possible cancer‐testis antigen. The GPATCH2 full‐length cDNA sequence of 2336 nucleotides encodes a peptide of 528 amino acids (GenBank accession number NM_018040). The GPATCH2 gene consists of nine exons, spanning an approximately 220‐kb genomic region on chromosomal band 1q41. In silico analysis suggested that the protein contained a highly conserved G‐patch domain in its C‐terminal region. Human GPATCH2 shares approximately 80% identity in amino acids with its murine homologs (Mus musculus and Rattus norvegicus) and 71% with a homolog in Xenopus laevis, indicating that GPATCH2 is highly conserved among the species.
Figure 1.
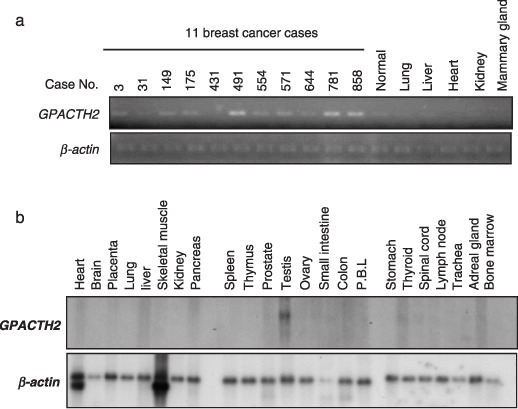
Expression of G‐patch domain containing 2 (GPATCH2) in breast tumors, normal tissues and its subcellular‐lozalization. (a) Expression of GPATCH2 in 11 clinical breast cancer specimens (case number: 3, 31, 149, 175, 431, 491, 554, 571, 644, 781 and 858) by semiquantitative RT‐PCR. β‐actin served as a quantitative internal control. (b) Northern blot analysis of the GPATCH2 transcript in various normal human tissues. GPATCH2 was exclusively expressed in the testis. PBL, peripheral blood leukocytes.
GPATCH2 is indispensable for breast cancer cell growth. To assess whether GPATCH2 plays any role in growth or survival of breast cancer cells, we silenced the expression of endogenous GPATCH2 in the breast cancer cell lines T47D and MCF‐7, which expressed a high level of GPATCH2, by means of the mammalian vector‐based RNAi technique. Semiquantitative RT‐PCR analysis showed that the GPATCH2‐specific siRNA (si‐1) significantly suppressed the expression of GPATCH2 compared with a si‐scramble construct (si‐sc) or a noneffective construct (si‐2) (Fig. 2a). In concordance with the knockdown effect, we observed significant decreases in the number of colonies in a colony formation assay (Fig. 2b) and in the number of viable cells of both T47D and MCF‐7 measured by MTT assay (T47D, si‐1, P < 0.001; MCF‐7, si‐1, P < 0.001; Student's t‐test) (Fig. 1c). Moreover, we demonstrated that knockdown of GPATCH2 expression by different siRNA sequences (si‐3, si‐4) also significantly suppressed the growth of T47D cells, indicating no off‐target effect (Supporting Information Fig. S1). In addition, we examined how downregulation of GPATCH2 decreased cell proliferation by FACS analysis. The results showed that knockdown of GPATCH2 expression by siRNA clearly inhibited cell transition from G1 to S phase in T47D cells, indicating induction of G1 arrest but no induction of apoptosis of T47D cells (Supporting Information Fig. S2a–c). These results suggest that GPATCH2 is essential for the growth of breast cancer cells.
Figure 2.
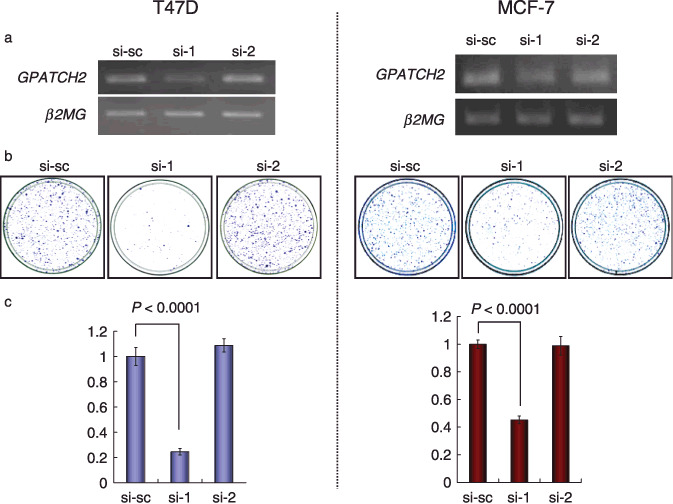
Growth‐inhibitory effects of G‐patch domain containing 2 (GPATCH2) siRNA on breast cancer cells. (a) Semiquantitative RT‐PCR showing suppression of endogenous expression of GPATCH2 by GPATCH2‐specific siRNA (si‐1 and si‐2) in the breast cancer cell lines T47D (left panels) and MCF‐7 (right panels). Scramble‐siRNA (si‐sc) was used as a negative control. β2‐microgloblin (β2MG) was used as a quantitative control for RT‐PCR. (b) Colony formation assay demonstrating a decrease in the numbers of colonies by knockdown of GPATCH2 in T47D (left panels) and MCF‐7 (right panels) cells. (c) MTT assay demonstrating a decrease in the numbers of cells by knockdown of GPATCH2 in T47D (left panel; si‐1 P < 0.0001; unpaired t‐test) and MCF‐7 (right panel; si‐1 P < 0.0001; unpaired t‐test) cells.
GPATCH2 interacted with hPrp43. To investigate the biological functions of GPATCH2 in breast cancer cell growth, we attempted to identify proteins interacting with GPATCH2 by immunoprecipitation and mass spectrometry analyses. Lysates of HEK 293T cells, which were transfected with pCMV‐myc‐GPATCH2 or pCMV‐myc‐Mock vectors (control), were immunoprecipitated with antimyc monoclonal antibody. The immunoprecipitated proteins were silver‐stained on SDS‐PAGE gels. An approximately 95‐kDa protein, which was seen in the immunoprecipitates from lysates of the cells transfected with the myc‐tagged GPATCH2 plasmid but not in those with mock control plasmid (data not shown), was extracted and analyzed by mass spectrometry. This approach identified hPrp43, a human ortholog of yeast Prp43, which is known to be an RNA‐dependent ATPase/helicase,( 20 ) as a candidate that interacts with GPATCH2 protein. We confirmed co‐upregulation of GPATCH2 and hPrp43 in breast cancer cells by semiquantitative RT‐PCR analysis (data not shown). To validate their interaction, we constructed plasmids that were designed to express myc‐tagged GPATCH2 (myc‐GPATCH2) or Flag‐tagged hPrp43 (Flag‐hPrp43). These plasmids were cotransfected into HEK 293T cells, and then the proteins were immunoprecipitated with anti‐Flag antibody. Immunoblotting of the precipitates using antimyc antibody indicated that myc‐GPATCH2 was coprecipitated with Flag‐hPrp43 (Fig. 3a; left panel). Conversely, we carried out immunoprecipitation using anti‐myc antibody and subsequently immunoblot analysis of the precipitates using anti‐Flag antibody. The results showed that Flag‐hPrp43 was coprecipitated with myc‐GPATCH2 (Fig. 3a; right panel). We additionally confirmed the interaction of exogenously expressed GPATCH2 (myc‐GPATCH2) with endogenous hPrp43 in HEK293 cells by immunoprecipitation experiments (Fig. 3b).
Figure 3.

Interaction of G‐patch domain containing 2 (GPATCH2) with hPrp43. (a) Co‐immunoprecipitation of GPATCH2 and hPrp43 proteins. Cell lysates from HEK 293T cells transfected with myc‐tagged GPATCH2 (myc‐GPATCH2) and Flag‐tagged hPrp43 (Flag‐hPrp43) were immunoprecipitated with anti‐Flag (left panels) or anti‐myc (right panels) antibodies. Immunoprecipitates (IP) were immunoblotted (IB) using monoclonal anti‐Flag or anti‐myc antibodies. (b) Confirmation of an interaction between exogenous GPATCH2 and endogenous hPrp43 protein. HEK 293T cells were transfected with the myc‐tagged GPATCH2 (myc‐GPATCH2), immunoprecipitated with anti‐myc antibody, and immunoblotted with anti‐hPrp43 polyclonal antibody. (c) Co‐localization of exogenous GPATCH2 and hPrp43 in the nuclear speckles (upper panels) and nucleoli (lower panels). HEK 293T cells were transfected with myc‐tagged GPATCH2 or Flag‐tagged hPrp43, and immunostained with anti‐myc (green) or anti‐Flag (red) antibodies, and DAPI (blue) to discriminate the nucleus. (d) The rectangular region of nucleoli in Fig. 3c is enlarged. Scale bar = 5 µm.
Furthermore, to investigate the subcellular localization of GPATCH2 and hPrp43 in mammalian cells, we cotransfected myc‐tagged GPATCH2 and Flag‐tagged hPrp43 constructs into HEK 293T cells, and then carried out immunocytochemical staining analysis. The results showed colocalization of myc‐GPATCH2 and Flag‐hPrp43 in the nuclear speckles (Fig. 3c) as well as nucleoli (Fig. 3d). Taken together, our results implied that GPATCH2 possibly interacted and colocalized with hPrp43 in nuclear speckles and nucleoli of mammalian cells.
Oncogenic activity of the GPATCH2–hPrp43 complex. To further validate the biological significance of hPrp43 in breast carcinogenesis, we constructed hPrp43‐specific siRNA expression vectors, and examined the knockdown effect of each construct in T47D and MCF‐7 breast cancer cell lines, which expressed a high‐level of hPrp43 as well as GPATCH2 (data not shown). Semiquantitative RT‐PCR and western blot analyses showed that si‐hPrp43 (si‐1) had a drastic knockdown effect on hPrp43 expression at the transcriptional and protein levels compared with an si‐scramble (si‐sc) (negative control) or a noneffective construct (si‐2) (Fig. 4a). Introduction of si‐hPrp43 (si‐1) into T47D or MCF‐7 cells resulted in a significant decrease in the number of colonies and viable cells, whereas si‐sc and si‐2 had no or little effect on the colony number or the cell viability (Fig. 4b,c). Moreover, we demonstrated that knockdown of hPrp43 expression by a different siRNA sequence (si‐3) also significantly suppressed growth of T47D cells as well as si‐1, indicating no off‐target effect (Supporting Information Fig. S3). These findings suggest that hPrp43 is also likely to have crucial roles in the growth of breast cancer cells.
Figure 4.

Effect of G‐patch domain containing 2 (GPATCH2) and hPrp43 on proliferation of breast cancer cells. (a) Growth‐inhibitory effects of hPrp43 siRNA on breast cancer cells. Semiquantitative RT‐PCR (1st and 2nd panels) and western blot (3rd and 4th panels) analyses showing suppression of endogenous expression of hPrp43 by hPrp43‐specific siRNA (si‐1 and si‐2) in the breast cancer cell lines T47D (left panels) and MCF‐7 (right panels). Scramble‐siRNA (si‐sc) was used as a negative control. β2‐microgloblin (β2MG) and β‐actin were used as quantitative controls for RT‐PCR and western blot analyses, respectively. (b) MTT assay demonstrating a decrease in the numbers of cells by knockdown of hPrp43 in T47D (left panel; si‐1 P < 0.0001; unpaired t‐test) and MCF‐7 (right panel; si‐1 P < 0.0001; unpaired t‐test) cells. (c) Colony formation assay demonstrating a decrease in the numbers of colonies by knockdown of hPrp43 in T47D (left panels) and MCF‐7 (right panels) cells. (d) Western blot analysis shows the expression of hPrp43–3 × FLAG and GPATCH2‐HA, respectively. Expression of β‐actin is served as a loading control. (e) Co‐overexpression of GPATCH2 and hPrp43 enhances cell growth. COS‐7 cells were transfected with GPATCH2 and hPrp43 under the serum‐starved condition and subjected to MTT assay at day 7 (*P = 0.007; unpaired t‐test).
To further examine the growth‐promoting effect of the GPATCH2–hPrp43 complex, we transfected COS7 cells with HA‐tagged GPATCH2, Flag‐tagged hPrp43, or both and investigated cell viability by MTT assay. We confirmed the expression of exogenous GPATCH2 and hPrp43 proteins by western blot analysis using anti‐HA and anti‐Flag antibodies (Fig. 4d). Double‐transfected COS7 cells showed a significantly higher cell proliferation than those transfected with mock‐plasmid, GPATCH2 alone, or hPrp43 alone under serum‐starved conditions (Fig. 4e), although no significant difference in their growth was observed under the normal serum (10%) condition (Supporting Information Fig. S4).
GPATCH2 enhanced the ATPase activity of hPrp43.
It has been reported that yeast Prp43 functions as an RNA‐dependent ATPase/helicase,( 20 , 21 ) and dysfunction of the ATPase activity of Prp43 is lethal in yeast cells.( 21 ) Therefore, we first investigated whether GPATCH2 could affect the in vitro enzymatic activity of hPrp43 though their interaction. After adjustment of the amount of hPrp43 and GPATCH2 recombinant protein, we measured the ATPase activity of the immunoprecipitated hPrp43 and found that it hydrolyzed 32p in a time‐dependent manner (Fig. 5a). Interestingly, its ATPase activity was enhanced in the presence of GPATCH2 protein in a dose‐dependent manner under the conditions we examined. The ATPase activity of hPrp43 at the 10‐min time point of the incubation was enhanced approximately 45‐fold in the presence of GPATCH2 (Fig. 5b), whereas GPATCH2 protein alone had no ATPase activity (Fig. 5). Our results imply that overexpression of GPATCH2 is likely to act as an accessory factor for upregulating the ATPase activity of hPrp43.
Figure 5.
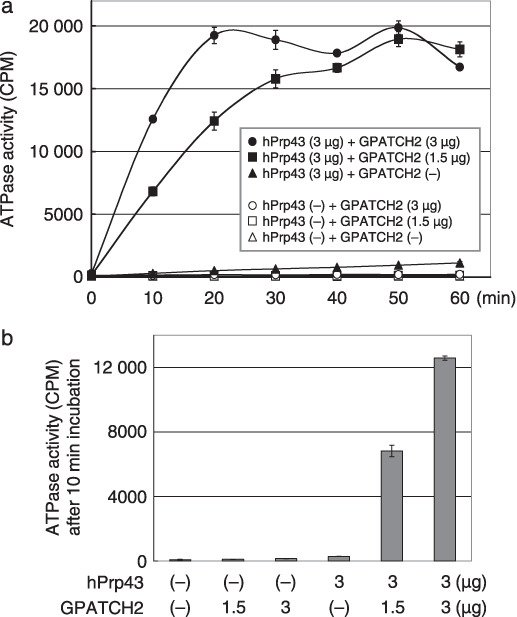
G‐patch domain containing 2 (GPATCH2) stimulates the ATPase activity of hPrp43 in vitro. (a) The kinetic reaction of ATP hydrolysis by immunoprecipitated hPrp43 in the presence or absence of GPATCH2 recombinant protein was plotted every 10 min up to 60 min. ATP hydrolysis on the y‐axis was expressed as counts per minute (CPM). (b) ATPase activity after a 10‐min incubation. The number indicates the amount of immunoprecipitated hPrp43 or GPATCH2 recombinant protein in the reaction.
Discussion
Significant advances in the development of molecular‐targeting drugs for cancer therapy have been achieved in the last two decades. However, the proportion of patients showing a good response to presently available treatments is still very limited and a subset of the patients suffer from severe adverse reactions without any clinical benefit.( 2 , 3 , 4 , 5 ) Hence, it is essential to develop new anticancer agents that are effective for patients who have no therapeutic modalities at present. If such drugs are highly specific to malignant cells with a minimum risk of adverse reactions, they are more desirable. Through precise expression profile analysis of clinical breast cancers using a combination of laser microbeam microdissection and cDNA microarray technology, we identified GPATCH2 to be significantly overexpressed in the majority of breast cancer cases. Northern blot and semiquantitative RT‐PCR analyses revealed that GPATCH2 expression was hardly detectable in any of 23 normal human tissues examined except the testis, implicating GPATCH2 to be a cancer‐testis antigen. Moreover, knockdown of endogenous GPATCH2 expression with its specific siRNA resulted in significant growth suppression of breast cancer cells due to induction of G1 arrest, implying its critical involvement in breast cancer cell growth. These data suggest that GPATCH2 could serve as a promising target for the development of novel anticancer drugs or cancer peptide vaccines for breast cancer.
The GPATCH2 gene encodes a putative 528‐amio acid protein with a single G‐patch domain, which was suggested to have RNA‐binding affinity.( 14 ) However, as the biological roles of the GPATCH2 protein in cancer cells are totally unknown, we screened proteins interacting with GPATCH2 and identified hPrp43, a member of the DEAH‐box putative RNA helicase superfamily,( 20 , 21 ) as an interacting partner for GPATCH2. We confirmed their in vivo interaction and colocalization at the nucleoli and nuclear speckles of HEK 293T cells.
Yeast DEXH/D‐box ATPases, Prp2, Prp16, Prp22, and Prp43, are known to remodel the spliceosome at multiple steps during pre‐mRNA splicing.( 22 ) Among these splicing factors, Prp2, Prp16, and Prp22 are required in the early steps of spliceosome assembly.( 22 ) On the other hand, Prp43 functions in the final stage of the splicing pathway, the dissociation of lariat–intron and spliceosomal disassembly.( 21 ) In yeast, an ATPase‐defective Prp43 mutant was shown to block the release of excised lariat–intron from the spliceosome, indicating that catalytic reaction by Prp43 is likely to be essential for intron release.( 20 , 21 ) Moreover, overexpression of the ATPase‐defective mutant protein in a wild‐type yeast strain caused dominant‐negative growth inhibition.( 21 , 22 , 23 ) This evidence suggests that the hydrolysis of ATP by Prp43 is crucial in the pre‐mRNA splicing pathway. We demonstrated that the binding of GPATCH2 to hPrp43 is likely to enhance the ATPase activity of hPrp43 and that introduction of both GPATCH2 and hPrp43 into COS7 cells revealed a synergistic growth‐promoting effect, although it was observed only under the serum‐starved condition. Moreover, we demonstrated colocalization of GPATCH2 and hPrp43 proteins in nucleoli, the site of ribosome biogenesis. Recently, it has been reported that the ATPase activity of yeast Prp43 is required for the early steps of pre‐rRNA processing and accumulation of mature rRNA in the nucleolus, implying that Prp43 plays an essential role in ribosome biogenesis as well as spliceosomal disassembly.( 23 , 24 ) These data suggest that overexpression of GPATCH2 causes the growth‐promoting effect though enhancement of the ATPase activity of hPrp43. As recent studies have suggested that rapidly growing tumors have an elevated ribosome content,( 25 ) further studies are required to clarify the mechanism of how overexpression of GPATCH2 enhances hPrp43 ATPase activity for ribosome biogenesis and spliceosomal disassembly in cancer cells. Although further analysis of the function of GPATCH2 is necessary, these data strongly imply the possibility of designing new anticancer drugs to specifically target the enzymatic activity of the GPATCH2–hPrp43 complex as a promising therapeutic strategy for treatment of breast cancer patients.
Supporting information
Fig. S1. Growth‐inhibitory effects of GPATCH2 siRNAs on breast cancer cells. (a) Semiquantitative RT‐PCR showing suppression of endogenous expression of GPATCH2 by GPATCH2‐specific siRNAs (si‐3 and si‐4) in breast cancer cell line, T47D. EGFP (Enhanced green fluorescent protein)‐siRNA (si‐EGFP) was used as a negative control. β‐actin was used as a quantitative control. (b) MTT assay demonstrating a decrease in the numbers of cells by knockdown of GPATCH2 in T47D cells (si‐3, si‐4; P < 0.0001; unpaired t‐test).
Fig. S2. Effects of GPATCH2 knockdown on the cell cycle. (a) Semiquantitative RT‐PCR for GPATCH2 transcripts in T47D cells transfected with siRNA oligonucleotides targeting either GPATCH2 or EGFP (Enhanced green fluorescent protein) at 24 and 48 h after transfection. β‐actin is served as an internal control. (b) FACS analysis showed cell cycle populations of T47D cells transfected with siRNA oligonucleotides targeting either GPATCH2 (si‐3 and si‐4) or EGFP (siEGFP). Arrows indicate the S‐phase populations of the cells transfected with GPATCH2 siRNA (si‐3 and si‐4). (c) FACS analysis showed cell cycle populations of T47D cells transfected with siRNA oligonucleotides targeting either GPATCH2 (si‐3 and si‐4) or EGFP (siEGFP). Upper right panel indicates the schematic diagram of each cell cycle population.
Fig. S3. Growth‐inhibitory effects of hPrp43 siRNA on breast cancer cells. (a) Semiquantitative RT‐PCR showing suppression of endogenous expression of hPrp43 by hPrp43‐specific siRNA (si‐1, si‐2, and si‐3) in the breast cancer cell lines, T47D. Scramble‐siRNA (si‐sc) was used as a negative control. β2‐microgloblin (β2MG) was used as a quantitative control for RT‐PCR. (b) MTT assay demonstrating a decrease in the numbers of cells by knockdown of hPrp43 in T47D cells (left panel; si‐1 P < 0.0001; unpaired t‐test). (c) Colony formation assay demonstrating a decrease in the number of colonies by knockdown of hPrp43 in T47D cells.
Fig. S4. Effect of overexpression of GPATCH2 and hPrp43 on cell growth. COS‐7 cells were transfected with GPATCH2 and hPrp43, and then subjected to MTT assay at day 7 under the 10% serum condition (NS = no significant difference; unpaired t‐test).
Supplementary Materials and methods
Please note: Wiley‐Blackwell are not responsible for the content or functionality of any supporting materials supplied by the authors. Any queries (other than missing material) should be directed to the corresponding author for the article.
Supporting info item
Supporting info item
Supporting info item
Supporting info item
Supporting info item
Supporting info item
Supporting info item
Acknowledgments
We gratefully thank Ms Yoshiko Fujisawa and Ms Aya Sasaki for technical assistance.
References
- 1. Parkin DM, Bray F, Ferlay J, Pisani P. Global cancer statistics, 2002. CA Cancer J Clin 2005; 55: 74–108. [DOI] [PubMed] [Google Scholar]
- 2. Berry DA, Cronin KA, Plevritis SK et al . Effect of screening and adjuvant therapy on mortality from breast cancer. N Engl J Med 2005; 353: 1784–92. [DOI] [PubMed] [Google Scholar]
- 3. Early Breast Cancer Trialists’ Collaborative Group . Effects of chemotherapy and hormonal therapy for early breast cancer on recurrence and 15 year survival. Lancet 2005; 365: 1687–717. [DOI] [PubMed] [Google Scholar]
- 4. Romond EH, Perez EA, Bryant J et al . Trastuzumab plus adjuvant chemotherapy for operable HER2‐positive breast cancer. N Engl J Med 2005; 353: 1673–84. [DOI] [PubMed] [Google Scholar]
- 5. Bilancia D, Rosati G, Dinota A, Germano D, Romano R, Manzione L. Lapatinib in breast cancer. Ann Oncol 2007; 18: 26–30. [DOI] [PubMed] [Google Scholar]
- 6. Adamo V, Iorfida M, Montalto E, Festa V, Garipoli C, Scimone A. Overview and new strategies in metastatic breast cancer (MBC) for treatment of tamoxifen‐resistant patients. Ann Oncol 2007; 18: 53–7. [DOI] [PubMed] [Google Scholar]
- 7. Petricoin EF 3rd, Hackett JL, Lesko LJ et al . Medical applications of microarray technologies: a regulatory science perspective. Nat Genet 2002; 32: 474–9. [DOI] [PubMed] [Google Scholar]
- 8. Nishidate T, Katagiri T, Lin ML et al . Genome‐wide gene expression profiles of breast‐cancer cells purified with laser microbean microdissection: identification of gene associated with progression and metastasis. Int J Oncol 2004; 25: 797–819. [PubMed] [Google Scholar]
- 9. Park JH, Lin ML, Nishidate T, Nakamura Y, Katagiri T. PDZ‐binding kinase/T‐LAK cell‐originated protein kinase, a putative cancer/testis antigen having an oncogenic activity in breast cancer. Cancer Res 2006; 66: 9186–95. [DOI] [PubMed] [Google Scholar]
- 10. Shimo A, Nishidate T, Ohta T, Fukuda M, Nakamura Y, Katagiri T. Elevated expression of PRC1, protein regulator of cytokinesis 1, involved in the growth of breast cancer cells. Cancer Sci 2007; 98: 174–81. [DOI] [PMC free article] [PubMed] [Google Scholar]
- 11. Lin ML, Park JH, Nishidate T, Nakamura Y, Katagiri T. Involvement of maternal embryonic leucine zipper kinase (MELK) in mammary carcinogenesis through interaction with Bcl‐G, a pro‐apoptotic member of Bcl‐2 family. Breast Cancer Res 2007; 9: R17. [DOI] [PMC free article] [PubMed] [Google Scholar]
- 12. Shimo A, Tanikawa C, Nishidate T et al . Involvement of kinesin family member 2C/mitotic centromere‐associated kinesin overexpression in mammary carcinogenesis. Cancer Sci 2008; 99: 62–70. [DOI] [PMC free article] [PubMed] [Google Scholar]
- 13. Ueki T, Nishidate T, Park JH et al . Involvement of elevated expression of multiple cell‐cycle regulator, DTL/RAMP (denticleless/RA‐regulated nuclear matrix associated protein), in the growth of breast cancer cells. Oncogene 2008; 27: 5672–83. [DOI] [PubMed] [Google Scholar]
- 14. Aravind L, Koonin EV. G‐patch. a new conserved domain in eukaryotic RNA‐processing proteins and type D retroviral polyproteins. Trends Biochem Sci 1999; 24: 342–4. [DOI] [PubMed] [Google Scholar]
- 15. Dendouga N, Callebaut I, Tomavo S. A novel DNA repair enzyme containing RNA recognition, G‐patch and specific splicing factor 45‐like motifs in the protozoan parasite Toxoplasma gondii . Eur J Biochem 2002; 269: 3393–401. [DOI] [PubMed] [Google Scholar]
- 16. Katagiri T, Ozaki K, Fujiwara T et al . Cloning, expression and chromosome mapping of adducin‐like 70 (ADDL), a human cDNA highly homologous to human erythrocyte adducin. Cytogenet Cell Genet 1996; 74: 90–5. [DOI] [PubMed] [Google Scholar]
- 17. Shimokawa T, Furukawa Y, Sakai M et al . Involvement of the FGF18 gene in colorectal carcinogenesis, as a novel downstream target of the beta‐catenin/T‐cell factor complex. Cancer Res 2003; 63: 6116–20. [PubMed] [Google Scholar]
- 18. Arakawa T, Tsumoto K. The effects of arginine on refolding of aggregated proteins: not facilitate refolding, but suppress aggregation. Biochem Biophys Res Commun 2003; 304: 148–52. [DOI] [PubMed] [Google Scholar]
- 19. Tsumoto K, Ejima D, Kita Y, Arakawa T. Review: why is arginine effective in suppressing aggregation? Protein Pept Lett 2005; 12: 613–19. [DOI] [PubMed] [Google Scholar]
- 20. Arenas JE, Abelson JN. Prp43: an RNA helicase‐like factor involved in spliceosome disassembly. Proc Natl Acad Sci USA 1997; 94: 11 798–802. [DOI] [PMC free article] [PubMed] [Google Scholar]
- 21. Martin A, Schneider S, Schwer B. Prp43 is an essential RAN‐dependent ATPase required for release of lariat‐intron from the spliceosome. J Biol Chem 2002; 277: 17 743–50. [DOI] [PubMed] [Google Scholar]
- 22. Staley JP, Guthrie C. Mechanical devices of the spliceosome: motors, clocks, springs, and things. Cell 1998; 92: 315–26. [DOI] [PubMed] [Google Scholar]
- 23. Lebaron S, Froment C, Fromont‐Racine M, Rain JC, Monsarrat B, Caizergues‐Ferrer M et al . The splicing ATPase Prp43p is a component of multiple preribosomal particles. Mol Cell Biol 2005; 25: 9269–82. [DOI] [PMC free article] [PubMed] [Google Scholar]
- 24. Leeds NB, Small EC, Hiley SL, Hughes TR, Staley JP. The splicing factor Prp43p, a DEAH box ATPase, functions in ribosome biogenesis. Mol Cell Biol 2006; 26: 513–22. [DOI] [PMC free article] [PubMed] [Google Scholar]
- 25. Elser JJ, Nagy JD, Kuang Y. Biological stoichiometry: an ecological perspective on tumor dynamics. Bioscience 2003; 53: 1112–20. [Google Scholar]
Associated Data
This section collects any data citations, data availability statements, or supplementary materials included in this article.
Supplementary Materials
Fig. S1. Growth‐inhibitory effects of GPATCH2 siRNAs on breast cancer cells. (a) Semiquantitative RT‐PCR showing suppression of endogenous expression of GPATCH2 by GPATCH2‐specific siRNAs (si‐3 and si‐4) in breast cancer cell line, T47D. EGFP (Enhanced green fluorescent protein)‐siRNA (si‐EGFP) was used as a negative control. β‐actin was used as a quantitative control. (b) MTT assay demonstrating a decrease in the numbers of cells by knockdown of GPATCH2 in T47D cells (si‐3, si‐4; P < 0.0001; unpaired t‐test).
Fig. S2. Effects of GPATCH2 knockdown on the cell cycle. (a) Semiquantitative RT‐PCR for GPATCH2 transcripts in T47D cells transfected with siRNA oligonucleotides targeting either GPATCH2 or EGFP (Enhanced green fluorescent protein) at 24 and 48 h after transfection. β‐actin is served as an internal control. (b) FACS analysis showed cell cycle populations of T47D cells transfected with siRNA oligonucleotides targeting either GPATCH2 (si‐3 and si‐4) or EGFP (siEGFP). Arrows indicate the S‐phase populations of the cells transfected with GPATCH2 siRNA (si‐3 and si‐4). (c) FACS analysis showed cell cycle populations of T47D cells transfected with siRNA oligonucleotides targeting either GPATCH2 (si‐3 and si‐4) or EGFP (siEGFP). Upper right panel indicates the schematic diagram of each cell cycle population.
Fig. S3. Growth‐inhibitory effects of hPrp43 siRNA on breast cancer cells. (a) Semiquantitative RT‐PCR showing suppression of endogenous expression of hPrp43 by hPrp43‐specific siRNA (si‐1, si‐2, and si‐3) in the breast cancer cell lines, T47D. Scramble‐siRNA (si‐sc) was used as a negative control. β2‐microgloblin (β2MG) was used as a quantitative control for RT‐PCR. (b) MTT assay demonstrating a decrease in the numbers of cells by knockdown of hPrp43 in T47D cells (left panel; si‐1 P < 0.0001; unpaired t‐test). (c) Colony formation assay demonstrating a decrease in the number of colonies by knockdown of hPrp43 in T47D cells.
Fig. S4. Effect of overexpression of GPATCH2 and hPrp43 on cell growth. COS‐7 cells were transfected with GPATCH2 and hPrp43, and then subjected to MTT assay at day 7 under the 10% serum condition (NS = no significant difference; unpaired t‐test).
Supplementary Materials and methods
Please note: Wiley‐Blackwell are not responsible for the content or functionality of any supporting materials supplied by the authors. Any queries (other than missing material) should be directed to the corresponding author for the article.
Supporting info item
Supporting info item
Supporting info item
Supporting info item
Supporting info item
Supporting info item
Supporting info item