

Abstract
Expression of fascin‐1, an actin bundling protein, is a poor prognostic factor in hepatocellular carcinoma (HCC). However, its biological role in HCC cells remains unclear. Using human HCC tissues and cell lines HLE, Hep3B, and Huh7, we investigated whether fascin‐1 is involved in epithelial–mesenchymal transition (EMT) and increases invasiveness, thus serving as a promoter of cancer aggressiveness. Immunohistochemical analysis revealed that fascin‐1 expression in 19% of primary HCCs was associated with repression of E‐cadherin expression, indicating EMT. In vitro, HLE cells showed high fascin‐1 expression, loss of E‐cadherin, and efficient invasion through Matrigel. Knockdown of fascin‐1 significantly repressed invasiveness of the HLE cells and slightly induced E‐cadherin expression. In contrast, Huh7 cells had low fascin‐1 levels, high E‐cadherin expression, and were expectedly non‐invasive. However, forced overexpression of fascin‐1 conferred only modest invasiveness without E‐cadherin repression, indicating that fascin‐1 alone cannot effectively stimulate invasiveness or EMT. Furthermore, Hep3B cells were non‐invasive despite high fascin‐1 expression. Nevertheless, fascin‐1 overexpression dramatically increased the migratory potential of Huh7 cells. We then evaluated matrix metalloproteinases (MMPs) 2 and 9 from the HCC cell lines. Significant MMP secretion was only found in HLE cells. Although MMP levels were not elevated in fascin‐1‐overexpressing Huh7 cells, their invasiveness was remarkably augmented by coculture with HLE cells, and was suppressed in the presence of an MMP inhibitor. In conclusion, we propose that fascin‐1 primarily acts as a migration factor associated with EMT in HCC cells and facilitates their invasiveness in combination with MMPs. (Cancer Sci 2011; 102: 1228–1235)
Fascin‐1 is an actin‐bundling protein that plays a pivotal role in cell movement under physiological or pathological conditions.( 1 ) By cross‐linking actin filaments, fascin‐1 is a constituent of filopodia at the leading edge of migrating cells.( 1 , 2 ) Fascin‐1 also supports a variety of cellular structures including lamellipodia, microspikes, and other actin‐based membranous protrusions.( 1 ) The actin‐bundling function of fascin‐1 has been shown to be suppressed through phosphorylation by protein kinase C,( 3 ) but the exact role of fascin‐1 in actin dynamics remains unknown. Rac1 GTPase of the Rho family has been proposed to promote cell migration by regulating the interaction of fascin‐1 with protein kinase C.( 4 ) More recently, the drosophila homologue Rab35, a Rab family GTPase, was shown to stimulate the assembly of actin filaments through direct association with fascin‐1.( 5 )
In adult mammals, fascin‐1 expression is restricted to particular tissues including the brain, endothelium, and testis, and is absent or generally low in epithelia.( 1 ) However, our previous study revealed its high expression in migrating fetal rat hepatoblasts during the early stage of hepatogenesis.( 6 ) Expression was repressed when hepatoblasts ceased to migrate and differentiated into mature hepatocytes. Thus, immature epithelial cells may express a high level of fascin‐1 associated with movement necessary for organogenesis.
Fascin‐1 may also be highly expressed in epithelial cells during neoplastic transformation. Various human epithelial cancers have been reported to express fascin‐1 associated with clinically unfavorable phenotypes, that is, invasion and metastasis.( 1 ) Moreover, in vitro experiments of overexpression or knockdown of fascin‐1 revealed that its expression promotes both migration and invasiveness of adenocarcinoma( 7 , 8 , 9 ) or squamous cell carcinoma cell lines.( 10 , 11 , 12 ) Consequently, fascin‐1 is considered an evidence‐based biomarker of aggressiveness for those types of carcinomas.
As fetal rat hepatoblasts highly express fascin‐1,( 6 ) we aimed to elucidate the role of fascin‐1 in human hepatocellular carcinomas (HCCs). Although an immunohistochemical study has shown that fascin‐1 expression was found in 16.8% of surgically resected HCC cases associated with poor prognosis,( 13 ) the actual effects of fascin‐1 on HCC cells are unknown.
In the present study, we observed that fascin‐1 expression in HCCs was associated with loss of E‐cadherin, indicating epithelial–mesenchymal transition (EMT).( 14 ) Furthermore, fascin‐1 was found to increase the invasiveness of HCC cell lines in combination with matrix metalloproteinases (MMPs).( 15 )
Materials and Methods
Surgical materials and cell lines. Formalin‐fixed and paraffin‐embedded tissue blocks from 53 surgically resected HCC cases were collected from our institutional archive. Their use was approved by the Ethical Review Board of Kochi Medical School (Nankoku, Japan). Three human HCC cell lines, HLE, Hep3B, and Huh7, were obtained from the Health Science Research Resources Bank (Osaka, Japan) or the American Type Culture Collection (Manassas, VA, USA). They were cultured at 37°C using DMEM (Sigma‐Aldrich, St. Louis, MO, USA) supplemented with 10% FBS unless otherwise specified.
Immunohistochemistry. Immunohistochemical staining was carried out as previously described.( 16 ) Primary antibodies were against human fascin‐1 (Dako, Carpinteria, CA, USA), E‐cadherin (Dako), vimentin (Dako), MMP2 (Abcam, Cambridge, UK), and MMP9 (Abcam).
Western blot analysis. Monolayer cell cultures at 80% confluency were lysed with RIPA buffer (Wako, Osaka, Japan). Each denatured sample containing 20 μg total protein was electrophoresed on a 10% polyacrylamide gel with 0.1% SDS and electrically blotted onto Hybond‐P filter paper (Amersham Biosciences, Little Chalfont, UK). Targeted proteins were detected as previously described using mouse mAbs against human fascin‐1, E‐cadherin, vimentin, or β‐actin (Dako).( 17 )
Transmembrane invasion and migration assay. The invasion assay was carried out using BioCoat Matrigel invasion chambers in 24‐well plates (BD Labware, Bedford, MA, USA) essentially as previously described.( 18 ) A suspension of 2.5 × 10⁴ cells in 0.5 mL serum‐free DMEM was applied onto a Matrigel‐coated, 8 μm pore‐sized polycarbonate membrane at the bottom of an upper chamber, which was inserted into a lower well containing 0.75 mL DMEM with 10% FBS as the chemoattractant. After 22 h incubation, cells remaining on the upper surface of the membrane were removed with a cotton swab, and those invaded onto the under surface were fixed with 4% paraformaldehyde and stained with crystal violet. Cells were observed under a light microscope and four randomly selected fields at ×100 magnification were photographed. Invasion efficiency was expressed as the mean number of cells per photographed microscopic field. Each experiment was carried out in triplicate. The protocol for the migration assay was the same as the invasion assay except that a membrane without Matrigel coating was used (BioCoat control culture inserts; BD Labware).
Semiquantitative RT‐PCR. Total RNA isolation from cultured cells at 80% confluency, generation of cDNA, and subsequent PCR was carried out as previously described.( 6 ) The PCR products were run on a native 7% polyacrylamide gel, stained with ethidium bromide, and visualized by UV illumination. Staining intensity was quantified by densitometry using ImageJ software (http://rsb.info.nih.gov/ij/). The screened gene panel included human SNAI1, SNAI2, TWIST1, ZEB1, ZEB2, RHOA, CDC42, and RAC1. GAPDH was screened as the control housekeeping gene. The primer sequences, product sizes, and PCR cycle numbers are listed in Table 1. The cycle number for each gene was determined as the amplification that was within a linear range.
Table 1.
List of genes analyzed by semiquantitative RT‐PCR
| Gene | Primer sequence (5′–3′) | Product size | PCR cycle number |
|---|---|---|---|
| SNAI1 | TTTACCTTCCAGCAGCCCTA | 199 | 33 |
| CCTCATCTGACAGGGAGGTC | |||
| SNAI2 | CTTTTTCTTGCCCTCACTGC | 161 | 33 |
| ACAGCAGCCAGATTCCTCAT | |||
| TWIST1 | GGAGTCCGCAGTCTTACGAG | 162 | 27 |
| CCAGCTTGAGGGTCTGAATC | |||
| ZEB1 | GCACAACCAAGTGCAGAAGA | 190 | 27 |
| CATTTGCAGATTGAGGCTGA | |||
| ZEB2 | CGCTTGACATCACTGAAGGA | 204 | 30 |
| CTTGCCACACTCTGTGCATT | |||
| RHOA | TATCGAGGTGGATGGAAAGC | 172 | 27 |
| TTCTGGGGTCCACTTTTCTG | |||
| CDC42 | TACTGCAGGGCAAGAGGATT | 172 | 27 |
| CCCAACAAGCAAGAAAGGAG | |||
| RAC1 | TTTGAAAATGTCCGTGCAAA | 250 | 24 |
| TCGCTTCGTCAAACACTGTC | |||
| GAPDH | ACCACAGTCCATGCCATCAC | 452 | 27 |
| TCCACCACCCTGTTGCTGTA |
Plasmids and transfection. For stable knockdown of fascin‐1, pLKO.1‐puro plasmid vector with an expression construct of shRNA against fascin‐1 and the puromycin‐resistance gene was purchased from Sigma‐Aldrich (Clone ID: NM_003088.2‐1699s1c1). The same plasmid without the shRNA sequence was used as the negative control. For stable overexpression of fascin‐1, the pCMV6‐AC plasmid vector with an expression construct of the human fascin‐1 cDNA and the G418‐resistance gene was obtained from OriGene (Rockville, MD, USA). Transfection of cultured HCC cells with each plasmid was carried out using the FuGene6 reagent (Roche Diagnostics, Basel, Switzerland) according to the manufacturer’s instructions. Stable transfectants were selected for 2 weeks with 1.8 ng/mL puromysin (Sigma‐Aldrich) or 1 mg/mL G418 (Roche Diagnostics), depending on the resistance gene, and cloned to establish cell lines.
Phalloidin staining. Cells cultured on a cover slip were fixed with acetone and stained with fluorescein isothiocyanate‐labeled phalloidin (Sigma‐Aldrich), which binds to actin filaments, as specified in the manufacturer’s manual. The green fluorescence of stained cells was observed under a fluorescence microscope.
Cell growth study. At day 0, 105 cells were seeded onto a 10 cm culture dish. Cell number per dish as the mean of three experiments was sequentially determined at days 3, 4, and 7. The doubling time was deduced at the exponential growth phase.
Gelatin zymography. Confluent, monolayer cells were incubated for 24 h under serum‐free conditions. Conditioned media were concentrated 40‐fold with a Microcon Ultracel YM‐3 (Millipore, Billerica, MA, USA). Each concentrate (10 μL) was electrophoresed by SDS‐PAGE containing 0.5% gelatin and analyzed by gelatin zymography using a complete kit (Primary Cell Co., Sapporo, Japan).
Coculture experiment. The Huh7‐Hi cell line, a derivative of Huh7, was labeled for 15 min with CellTracker CM‐DiI reagent (Invitrogen, Carlsbad, CA, USA) according to the manufacturer’s instructions. A suspension of 1.25 × 10⁴ Huh7‐Hi cells labeled with the reagent were combined with that of an equal number of unlabeled Huh7‐Hi or HLE cells, or that of a half number of unlabeled HLE cells. Each combined suspension was then examined by the transmembrane invasion assay described above. For inhibition of MMPs, a broad‐spectrum MMP inhibitor, GM6001 (10 mM) dissolved in DMSO (Calbiochem, Gibbstown, NJ, USA) was added to the media of both the upper chamber and lower well at a final concentration of 25 μM. The equivalent volume of DMSO was added for the rest of the coculture experiments. After fixation of invaded cells with 4% paraformaldehyde, CM‐DiI‐emitted orange fluorescence was observed by fluorescence microscopy and photographed at ×100 magnification. Relative invasion efficiencies of the labeled Huh7‐Hi cells were evaluated as fluorescence‐occupied area per photographed microscopic field measured by ImageJ software. In some cases, nuclei of invaded cells were counterstained with DAPI (Sigma‐Aldrich). All the experiments were done in triplicate. Exactly the same coculture experiments were also carried out using Hep3B cells instead of Huh7‐Hi cells.
Statistical analysis. For statistical comparison of mean values, Student’s t‐test was used. The categorical grade‐dependent linear trend of proportion values was analyzed by the Cochran–Armitage trend test. The Jonckheere–Terpstra trend test was used to assess the dose–response trend of mean values. The significance level was set at P < 0.05.
Results
Fascin‐1 expression and EMT in primary human HCCs. Fifty‐three cases of surgically resected human HCCs were immunohistochemically analyzed for fascin‐1 expression. Fascin‐1 expression was detected in 19% of cases and confirmed to be more frequent in histologically less differentiated tumors (Table 2).( 13 )
Table 2.
Fascin‐1 expression in primary human hepatocellular carcinomas
| No. of cases | ||||
|---|---|---|---|---|
| Histopathologic degree of differentiation | ||||
| Well | Moderate | Poor | Total | |
| Analyzed | 14 | 31 | 8 | 53 |
| Fascin‐1 positive (%) | 0 (0)† | 5 (16)† | 5 (63)† | 10 (19) |
†P < 0.001 by the the Cochran–Armitage trend test.
All fascin‐1‐positive HCCs were stained in a mosaic pattern. The staining was generally associated with the loss of typical trabecular HCC structures sustained by sinusoidal endothelia that are normally positive for fascin‐1 (Fig. 1). This structural change caused solid growth and/or capsular invasion of the tumor cells (Fig. 1C). In addition to endothelial cells, normal bile duct cells and fibroblasts occasionally showed weak staining for fascin‐1.
Figure 1.
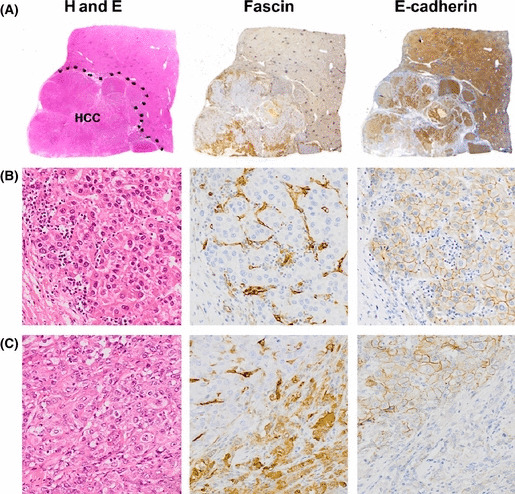
Serial sections of a poorly differentiated hepatocellular carcinoma (HCC) stained for H&E, fascin‐1 (fascin), or E‐cadherin. (A) Macroscopic views. The tumor area is illustrated by a dotted curve in the H&E section. Note that fascin‐1 and E‐cadherin expressions generally are mutually exclusive. The fascin‐1‐positive HCC cells tend to invade and replace the fibrous stroma or capsule. (B) Microscopic view of a minor, relatively well differentiated section of this tumor. The strongly fascin‐1‐positive endothelial cells highlight a typical trabecular pattern of the HCC with organized sinusoidal structure. All the HCC cells are negative for fascin‐1 but positive for E‐cadherin. (C) Predominant component of this tumor. Although the H&E section displays a solid growth of poorly differentiated tumor cells, fascin‐1 staining reveals sinusoidal structures with fascin‐1‐negative HCC cells in the upper left area. In contrast, the sinusoidal structure is lost due to invasive growth of fascin‐1‐positive HCC cells, as shown in the lower right area. Note that fascin‐1 and E‐cadherin have inverse staining patterns.
To evaluate EMT, we further analyzed the epithelial marker E‐cadherin and the mesenchymal marker vimentin by immunohistochemistry. The fascin‐1‐positive tumor cell populations invariably showed reduced expression of E‐cadherin, indicating EMT (Fig. 1). However, vimentin expression was detectable in only one case of poorly differentiated HCC (data not shown).
Fascin‐1 expression, EMT, and invasiveness of HCC cells in vitro. Western blot analysis of three human HCC cell lines, HLE, Hep3B, and Huh7, revealed that fascin‐1 was highly expressed in HLE and Hep3B cells, whereas Huh7 cells expressed minimal levels (Fig. 2A). Consistent with the in vivo observation, E‐cadherin expression was drastically lost in HLE cells and minimal in Hep3B cells, but was higher in Huh7 cells (Fig. 2A). Although vimentin was detectable in all three cell lines, there was an inverse correlation between vimentin and E‐cadherin levels. Semiquantitative RT‐PCR analysis of mRNA levels of SNAI1, SNAI2, and TWIST1, the major EMT regulator genes,( 14 ) indicated that SNAI2 showed an expression pattern similar to that of fascin‐1 (Fig. 2B).
Figure 2.
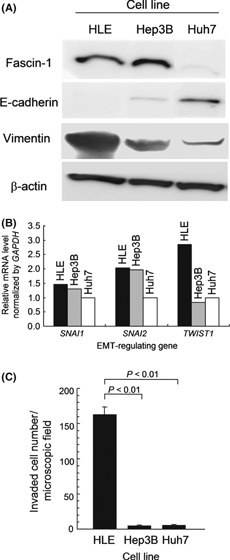
Characterization of human hepatocellular carcinoma cell lines HLE, Hep3B, and Huh7. (A) Western blot analysis. (B) Relative mRNA levels evaluated by semiquantitative RT‐PCR. (C) Transmembrane invasion assay (P‐values determined by Student’s t‐test). EMT, epithelial–mesenchymal transition. Error bar = SEM.
The transmembrane invasion assay with a Matrigel matrix barrier showed that invasiveness of the HLE cell line was high, but Huh7 cells were not significantly invasive (Fig. 2C). Unexpectedly, Hep3B cells, which have high fascin‐1 levels, were not invasive (Fig. 2C). These results indicate that fascin‐1 is functionally unrelated to invasiveness or that it promotes invasiveness but requires cooperation with other factors.
Knockdown of fascin‐1 expression suppresses invasiveness. To test whether fascin‐1 can modulate efficiency of invasion, we stably knocked down fascin‐1 expression in the highly invasive HLE cell line. The HLE cells were transfected with a fascin‐1‐specific shRNA expression construct and stably transfected clones were isolated. Two clones, designated HLE‐Kd1 and HLE‐Kd2, that had strong and moderate knockdown of fascin‐1, respectively, were selected for subsequent studies (Fig. 3A). The HLE‐Mock clone, transfected with the plasmid vector, served as the negative control (Fig. 3A). Western blot studies indicated that E‐cadherin expression was marginally induced in HLE‐Kd1 cells without reduction in vimentin levels (Fig. 3A).
Figure 3.
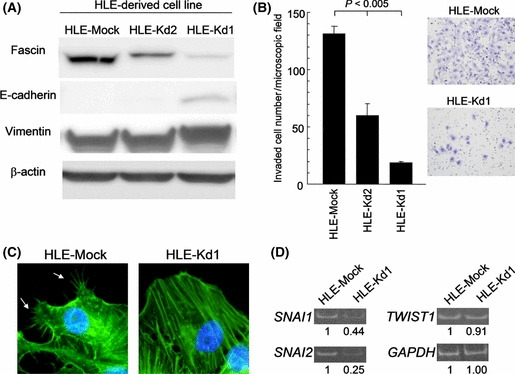
Characterization of HLE‐derived fascin‐1 knockdown cell lines HLE‐Kd1 and HLE‐Kd2. HLE‐Mock is a negative control transfected with the vector only. (A) Western blot analysis. (B) Transmembrane invasion assay. A fascin‐1 dose‐dependent increasing trend of invasion efficiency is statistically evident (P < 0.005 by the Jonckheere–Terpstra trend test). The photographs show invaded HLE‐Mock and HLE‐Kd1 cells. Error bar = SEM. (C) Fluorescently labeled phalloidin staining of actin filaments in HLE‐Mock and HLE‐Kd1 cells. Typical filopodial extensions of HLE‐Mock cells, indicated by white arrows, are not evident in HLE‐Kd1 cells. (D) Representative results of semiquantitative RT‐PCR. The numerical values are relative expression levels.
The transmembrane invasion assay revealed that knocking down fascin‐1 significantly suppressed invasiveness, which was negatively correlated with fascin‐1 levels (P < 0.005; Fig. 3B). These data indicate that fascin‐1 plays a role in promoting the invasiveness of HLE cells. Fluorescently‐labeled phalloidin staining of actin filaments showed poor formation of filopodia in HLE‐Kd1 cells relative to HLE‐Mock cells, which is in agreement with the known function of fascin‐1 (Fig. 3C).( 2 ) Doubling times for HLE‐Mock and HLE‐Kd1 cells were 31 and 41 h, respectively. Therefore, knockdown of fascin slightly inhibited cell growth.
Fascin‐1 knockdown and expression profile of genes relevant to EMT or actin dynamics. To determine if knockdown of fascin‐1 affects the expression profile of genes relevant to EMT or actin dynamics, HLE‐Mock and HLE‐Kd1 cells were comparatively analyzed by semiquantitative RT‐PCR. Our screening panel included SNAI1, SNAI2, TWIST1, ZEB1, and ZEB2 genes as representative EMT‐inducing transcription factor genes, RHOA, RAC1, and CDC42 genes of the RHO GTPase gene family, and the RAB35 gene as a fascin‐1 modulator gene. GAPDH was used as a control housekeeping gene. With a threshold value of a 50% difference, which was empirically set considering the experimental error, only the SNAI1 and SNAI2 genes were differentially expressed (Fig. 3D). Both genes were downregulated in HLE‐Kd1 cells.
Overexpression of fascin‐1 modestly promotes invasiveness. We next transfected Huh7 cells with human fascin‐1 cDNA to induce its overexpression. Among the stably transfected clones, the Huh7‐Hi clone, with high fascin‐1 levels, and the Huh7‐Lo clone, with low fascin‐1 levels equivalent to that of the parental Huh7 cells, were selected for further studies. In both Huh7‐Lo and Huh7‐Hi cells, E‐cadherin and vimentin expression were not affected (Fig. 4A). The doubling times for Huh7‐Hi and Huh7‐Lo cells were 46 and 47 h, respectively.
Figure 4.
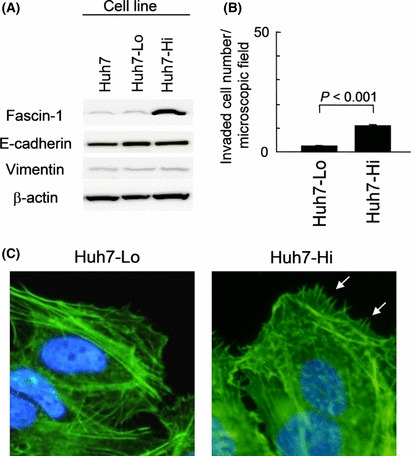
Characterization of Huh7‐derived cell lines, Huh7‐Hi and Huh7‐Lo, transfected with an expression construct of fascin‐1 cDNA. (A) Western blot analysis. (B) Transmembrane invasion assay (P‐value by Student’s t‐test). Error bar = SEM. (C) Fluorescently labeled phalloidin staining of actin filaments in Huh7‐Lo and Huh7‐Hi cells. More developed filopodia of Huh7‐Hi cells are indicated by white arrows.
Results of transmembrane invasion assays indicated that Huh7‐Hi cells were more invasive than Huh7‐Lo cells (P < 0.001; Fig. 4B). Phalloidin staining of actin filaments confirmed more developed filopodia in Huh7‐Hi cells than in Huh7‐Lo cells (Fig. 4C). Nevertheless, Huh7‐Hi cells were only 11% as invasive as HLE‐Mock cells and slightly less invasive than HLE‐Kd1 cells, which had low fascin‐1 levels. These data imply that fascin‐1 is not the single major promoter of invasiveness. The semiquantitative RT‐PCR analysis revealed that none of the genes listed in Table 1 was differentially expressed between Huh7‐Lo and Huh7‐Hi cells with significance (data not shown).
Fascin‐1 expression and migration. Fascin‐1 may play a primary role in migration rather than invasion. To test this hypothesis, we carried out the transmembrane migration assay under the same conditions as the invasion assay except for the exclusion of the Matrigel coating barrier (Fig. 5A). As predicted, HLE‐Kd1 cells were significantly less migratory than HLE‐Mock cells. Furthermore, Huh7‐Hi cells were almost nine times more migratory than Huh7‐Lo cells. As such, increased fascin‐1 expression in Huh7‐Hi cells likely has a greater effect on cellular migration than invasion. Indeed, Huh7‐Hi cells migrated faster than HLE‐Kd1 cells (P = 0.02). Hep3B cells, which have high fascin‐1 levels but were not invasive, were significantly more migratory than Huh7 and Huh7‐Lo cells. However, Hep3B cells were less migratory than HLE‐Kd1 cells, implicating that fascin‐1 is not the sole determinant of migration.
Figure 5.

Migration efficiencies of cell lines with either low or high fascin‐1 expression. (A) Transmembrane migration assay carried out under the same conditions as the invasion assay except without the Matrigel coating barrier (P‐values by Student’s t‐test). Relative fascin‐1 expression levels adjusted by those of β‐actin were obtained by Western blot analysis. (B) Comparison of invasion and migration efficiencies of cell lines expressing high levels of fascin‐1. Segregation of invasion and migration is more prominent in Huh7‐Hi and Hep3B cells than in HLE‐Mock cells. Error bar = SEM.
Taken together, the results of the invasion and migration assays indicate that the Matrigel barrier obstructed the transmembrane movement of fascin‐1‐expressing cells in a cell line‐dependent manner. Although the invasion efficiency of HLE‐Mock cells was as high as 79% of their migration efficiency, the percentages for Huh7‐Hi and Hep3B cells were only 25% and 24%, respectively (Fig. 5B). Thus, the Matrigel more effectively blocked the movement of Huh7‐Hi and Hep3B cells than HLE‐Mock cells, which suggests that fascin‐1 is primarily a migration factor and is unable to overcome the matrix barrier.
Cooperation between fascin‐1 and MMPs for invasion. It is plausible that the transmembrane movement of Huh7‐Hi and Hep3B cells was severely blocked by the Matrigel due to a lack of matrix‐degrading secretory factors. Matrix metalloproteinases are such candidate factors, as it has been reported that HLE cells secrete a large amount of pro‐MMP2.( 19 )
Our gelatin zymographic analysis revealed that the highly invasive HLE cell line secreted high levels of pro‐MMP2 and pro‐MMP9 into the medium, but Huh7 and Hep3B cells secreted only trace amounts (Fig. 6A). Overexpression of fascin‐1 in the Huh7‐Hi cell line did not induce MMP secretion, although knockdown of fascin‐1 in HLE‐Kd1 cells led to a selective inhibition of pro‐MMP9 secretion (Fig. 6A). Thus, invasion of the Matrigel by Huh7‐Hi and Hep3B cells might be inhibited because of their lack of MMPs, despite their high levels of fascin‐1.
Figure 6.
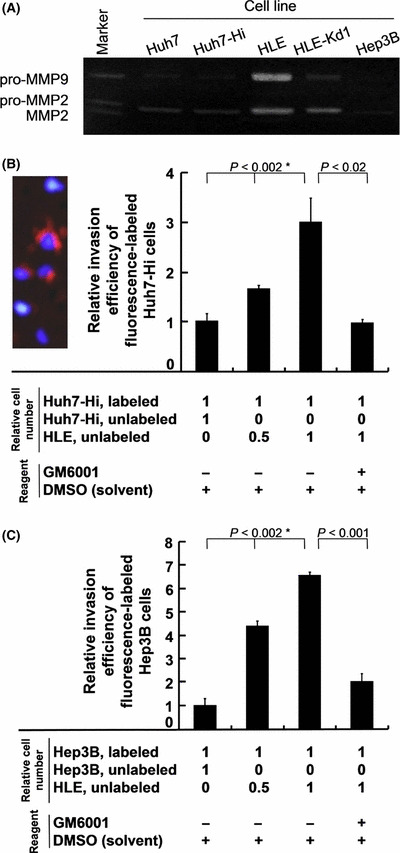
Matrix metalloproteinases (MMPs) and coculture experiments. (A) Gelatin zymographic analysis of pro‐MMP2 and pro‐MMP9 in conditioned media. (B) Relative invasion efficiency of fluorescently labeled Huh7‐Hi cells cocultured with unlabeled Huh7‐Hi or HLE cells in the absence (−) or presence (+) of an MMP inhibitor, GM6001. The photograph shows orange fluorescence emitted from three invaded Huh7‐Hi cells labeled with CellTracker CM‐DiI reagent. The nuclei were stained with DAPI in blue. The three unlabeled cells were cocultured HLE cells. P‐values with an asterisk were obtained by the Jonckheere–Terpstra trend test; P‐values without an asterisk were obtained by Student’s t‐test. (C) Relative invasion efficiency of fluorescently labeled Hep3B cells cocultured with unlabeled Hep3B or HLE cells. Error bar = SEM.
To further investigate the cooperation between fascin‐1 and secretory factors in invasiveness, Huh7‐Hi cells were labeled with CellTracker CM‐DiI reagent and examined by the transmembrane invasion assay with coculturing with either unlabeled Huh7‐Hi cells as control or unlabeled HLE cells. The cocultured HLE cells promoted invasiveness of the labeled Huh7‐Hi cells in a dose‐dependent manner, consistent with the hypothesis that secretory factors from HLE cells could further augment fascin‐1‐promoted invasion of Huh7‐Hi cells (Fig. 6B). Moreover, we observed that the augmentation effect of HLE cells was abolished in the presence of the MMP inhibitor, GM6001, indicating that this effect may depend on MMPs. The coculture experiments were also carried out using Hep3B cells instead of Huh7‐Hi cells. Essentially the same results were obtained (Fig. 6C).
Immunohistochemical analysis of MMP2 and MMP9 in primary HCCs with fascin‐1 expression. To evaluate the possible cooperation between fascin‐1 and MMPs in vivo, nine of the fascin‐1‐positive primary HCCs were further analyzed for expression of MMP2 and MMP9 by immunohistochemistry. Consistent with a previous report,( 20 ) no significant difference in MMP2 expression was observed between HCCs and their corresponding non‐tumorous liver tissues (data not shown). However, although non‐tumorous liver tissues were negative or only faintly positive for MMP9, five out of the nine HCCs showed definite positive staining for MMP9 with a heterogeneous pattern. The MMP9‐positive HCC cells had a propensity to be localized at the invasive front of each cancerous nodule, and simultaneously expressed fascin‐1. They showed an infiltrative growth pattern in the surrounding fibrous stroma (Fig. 7A). Conversely, fascin‐1‐positive HCC cells did not necessarily express MMP9. Those with no detectable MMP9 expression tended to show a compressive growth pattern at the tumor margin (Fig. 7B). However, they could also display a highly infiltrative growth pattern when accompanied by numerous MMP9‐positive inflammatory cells, most of which were neutrophils or macrophages (Fig. 7C).
Figure 7.
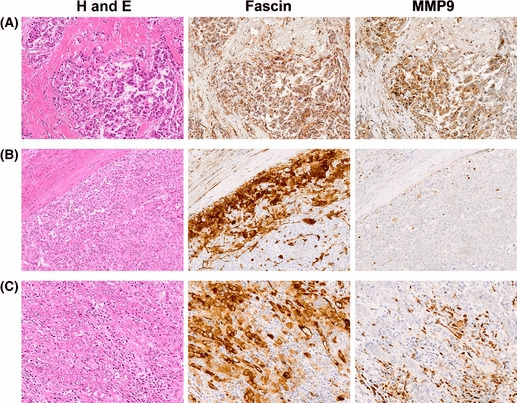
Immunohistochemical analysis of MMP9 expression in fascin‐1‐positive primary hepatocellular carcinomas (HCCs). (A) Serial sections of a poorly differentiated HCC stained for H&E, fascin‐1 (fascin), or MMP9. Tumor cells at the invasive front are shown. They express both fascin‐1 and MMP9, and show an infiltrative growth pattern in the fibrous stroma. (B) Serial sections of a moderately differentiated HCC. Fascin‐1‐positive tumor cells with no detectable MMP9 expression are localized in the marginal area, and show a compressive growth pattern. (C) Serial sections of another moderately differentiated HCC. Although fascin‐1‐positive HCC cells produce no detectable MMP9, they show a highly infiltrative growth pattern accompanied by numerous MMP9‐positive inflammatory cells, most of which are neutrophils.
Discussion
Hepatocellular carcinomas are unique in terms of their stroma, which is typically composed of sinusoidal structures rather than fibrous tissue. In the normal liver, hepatocellular cords are lined by sinusoidal endothelium lacking a basement membrane. However, in response to chronic inflammation, fibrosis, or growth of HCC cells, de novo basement membrane rich in type IV collagen appears in the space of Disse.( 21 ) Hence, thickened trabecular cords of HCC cells are wrapped with this membrane and hampered from disseminating into the sinusoidal blood flow or invading the fibrous capsule of each tumor nodule. Our in vitro results indicated that fascin‐1 might be one of the factors promoting HCC cells to penetrate the basement membrane and subsequently to destroy the sinusoid.
Although fascin‐1 is capable of promoting migration and invasion of HCC cells, it should be stressed that fascin‐1 is not the sole major determinant. As observed with Huh7‐Hi and Hep3B cells, which highly express fascin‐1, the effect of fascin‐1 on invasion relative to migration was considerably weaker, implying that fascin‐1 might primarily be a migration factor. We also analyzed HepG2 cells, another human hepatoma cell line, and found that their phenotypes were very similar to those of Hep3B cells, that is, high fascin‐1 expression, low E‐cadherin expression, low invasiveness, and low MMP expression (data not shown). These results contrast with those obtained by previous studies on other cancer types, for which fascin‐1 alone significantly enhanced invasiveness.( 7 , 8 , 9 , 10 , 11 , 12 )
Nevertheless, the migratory effect of fascin‐1 on HCC cells led to efficient invasion when assisted with secretory factors from intrinsically highly invasive cells such as MMP2 and 9, which fascin‐1 alone could not upregulate. These MMPs should digest type IV collagen, a major component of the basement membrane and Matrigel.( 15 ) We also observed that primary HCC cells expressing both fascin‐1 and MMP9 showed an infiltrative growth pattern in vivo, consistent with a previous report that expression of MMP9 rather than MMP2 correlated with aggressive phenotypes of human HCC cells.( 20 ) These observations further strengthen the idea that fascin‐1 cooperates with MMPs during invasive spreading of HCC cells.
Although HCC cells may express a high level of MMPs,( 19 , 20 ) non‐neoplastic hepatic cells such as stellate cells, Kupffer cells, macrophages, and neutrophils, may also produce these enzymes and contribute to remodeling of hepatic structures under chronic hepatitis, resulting in fibrosis and cirrhosis.( 22 ) Thus, even if fascin‐1‐expressing HCC cells lacked sufficient MMPs to degrade the basement membrane, their invasive growth would be facilitated by either neoplastic or non‐neoplastic MMP‐producing cells in the vicinity, as observed in our coculture experiments. In fact, fascin‐1‐positive primary HCC cells with no MMP9 expression were found to show an infiltrative growth pattern when accompanied by numerous MMP9‐positive inflammatory cells.
It is intriguing that knockdown of fascin‐1 in HLE cells resulted in selective repression of pro‐MMP9 secretion. It has been reported that tumor necrosis factor α‐induced MMP9 production in cholangiocellular carcinoma cells is concurrent with enhanced fascin‐1 expression.( 23 ) As silencing of fascin‐1 expression abrogated MMP9 induction, fascin‐1 was proposed to be involved in the signaling pathway for tumor necrosis factor α‐related MMP9 production.( 23 ) This hypothesis is consistent with our observations in HLE cells. However, overexpression of fascin‐1 in Huh7‐Hi cells did not result in increased secretion of pro‐MMP9 or pro‐MMP2. Accordingly, the signaling pathway to induce MMP9 might be complicated, and fascin‐1 may be insufficient to initiate the necessary signaling.
Native fascin‐1 expression in both primary HCCs and cultured HCC cell lines was accompanied by a reduction in the levels of the epithelial marker, E‐cadherin, which is associated with EMT, thus augmenting cancer invasiveness.( 24 ) In addition, fascin‐1 expression in vitro was associated with elevated expression of the EMT‐promoting SNAI2 gene.( 25 ) Knockdown of fascin‐1 in HLE cells led to a marginal induction of E‐cadherin, a more than twofold downregulation of the SNAI1 and SNAI2 genes, and a suppression of pro‐MMP9 secretion. All of these results indicate that fascin‐1 might be involved in EMT.( 25 , 26 ) However, forced overexpression of fascin‐1 in Huh7 cells did not influence any EMT‐related parameters except for migratory potential. Thus, fascin‐1 alone may only have a limited influence; it needs to cooperate or interact with other factors in order to initiate EMT in HCC cells. Further studies are required to fully understand the relationship between fascin‐1 and EMT.
It should be noted that a mesenchymal marker, vimentin, was only rarely detected in primary HCCs. In contrast, vimentin was detected in all three HCC cell lines, although its expression levels inversely correlated with those of E‐cadherin. This discrepancy could be attributed to the low sensitivity of immunohistochemistry or the differences between in vivo and in vitro conditions. In fact, even primary normal hepatocytes, which are negative for vimentin in vivo, express vimentin in vitro.( 27 )
It is yet to be elucidated how EMT leads to de novo induction of fascin‐1 in HCC cells. Although Rho signaling is one of the best characterized EMT‐related pathways for human HCCs,( 28 ) our preliminary experimental results indicated that a Rho signaling‐specific inhibitor did not repress fascin‐1 expression in the HLE cell line. Recently, galectin‐3 and microRNAs (miR‐145 and miR‐133a) were shown to modulate fascin‐1 expression in gastric and bladder cancer cells, respectively.( 29 , 30 ) The relationship between these factors and EMT has yet to be determined.
In summary, fascin‐1 promoted invasiveness of HCC cells in an MMP‐dependent manner. It was recently reported that fascin‐1 is the direct target for synthetic migrastatin analogues, which are potent inhibitors of experimental invasion and metastasis of breast cancer cells.( 31 ) These data, together with our present results, suggest the possibility of an evidence‐based cancer therapy targeting fascin‐1 expressed in HCCs.
Disclosure Statement
The authors have no conflict of interest.
References
- 1. Hashimoto Y, Skacel M, Adams JC. Roles of fascin in human carcinoma motility and signaling: prospects for a novel biomarker? Int J Biochem Cell Biol 2005; 37: 1787–804. [DOI] [PubMed] [Google Scholar]
- 2. Vignjevic D, Kojima S, Aratyn Y, Danciu O, Svitkina T, Borisy GG. Role of fascin in filopodial protrusion. J Cell Biol 2006; 174: 863–75. [DOI] [PMC free article] [PubMed] [Google Scholar]
- 3. Ono S, Yamakita Y, Yamashiro S et al. Identification of an actin binding region and a protein kinase C phosphorylation site on human fascin. J Biol Chem 1997; 272: 2527–33. [DOI] [PubMed] [Google Scholar]
- 4. Parsons M, Adams JC. Rac regulates the interaction of fascin with protein kinase C in cell migration. J Cell Sci 2008; 121: 2805–13. [DOI] [PubMed] [Google Scholar]
- 5. Zhang J, Fonovic M, Suyama K, Bogyo M, Scott MP. Rab35 controls actin bundling by recruiting fascin as an effector protein. Science 2009; 4: 325. [DOI] [PubMed] [Google Scholar]
- 6. Hayashi Y, Toda K, Saibara T et al. Expression of fascin‐1, an actin‐bundling protein, in migrating hepatoblasts during rat liver development. Cell Tissue Res 2008; 334: 219–26. [DOI] [PubMed] [Google Scholar]
- 7. Jawhari AU, Buda A, Jenkins M et al. Fascin, an actin‐bundling protein, modulates colonic epithelial cell invasiveness and differentiation in vitro . Am J Pathol 2003; 162: 69–80. [DOI] [PMC free article] [PubMed] [Google Scholar]
- 8. Hashimoto Y, Parsons M, Adams JC. Dual actin‐bundling and protein kinase C‐binding activities of fascin regulate carcinoma cell migration downstream of Rac and contribute to metastasis. Mol Biol Cell 2007; 18: 4591–602. [DOI] [PMC free article] [PubMed] [Google Scholar]
- 9. Darnel AD, Behmoaram E, Vollmer RT et al. Fascin regulates prostate cancer cell invasion and is associated with metastasis and biochemical failure in prostate cancer. Clin Cancer Res 2009; 15: 1376–83. [DOI] [PubMed] [Google Scholar]
- 10. Hashimoto Y, Ito T, Inoue H et al. Prognostic significance of fascin overexpression in human esophageal squamous cell carcinoma. Clin Cancer Res 2005; 11: 2597–605. [DOI] [PubMed] [Google Scholar]
- 11. Xie JJ, Xu LY, Zhang HH et al. Role of fascin in the proliferation and invasiveness of esophageal carcinoma cells. Biochem Biophys Res Commun 2005; 337: 355–62. [DOI] [PubMed] [Google Scholar]
- 12. Chen SF, Lin CY, Chang YC et al. Effects of small interfering RNAs targeting fascin on gene expression in oral cancer cells. J Oral Pathol Med 2009; 38: 722–30. [DOI] [PubMed] [Google Scholar]
- 13. Iguchi T, Aishima S, Umeda K et al. Fascin expression in progression and prognosis of hepatocellular carcinoma. J Surg Oncol 2009; 100: 575–9. [DOI] [PubMed] [Google Scholar]
- 14. Kalluri R, Weinberg RA. The basis of epithelial‐mesenchymal transition. J Clin Invest 2009; 119: 1420–8. [DOI] [PMC free article] [PubMed] [Google Scholar]
- 15. Kessenbrock K, Plaks V, Werb Z. Matrix metalloproteinases: regulators of the tumor microenvironment. Cell 2010; 141: 52–67. [DOI] [PMC free article] [PubMed] [Google Scholar]
- 16. Yamasaki K, Hayashi Y, Okamoto S, Osanai M, Lee G‐H. Insulin‐independent promotion of chemically induced hepatocellular tumor development in genetically diabetic mice. Cancer Sci 2010; 101: 65–72. [DOI] [PMC free article] [PubMed] [Google Scholar]
- 17. Osanai M, Ogawa K, Lee G‐H. Phenobarbital causes apoptosis in conditionally immortalized mouse hepatocytes depending on deregulated c‐myc expression: characterization of an unexpected effect. Cancer Res 1997; 57: 2896–903. [PubMed] [Google Scholar]
- 18. Osanai M, Sawada N, Lee G‐H. Oncogenic and cell survival properties of the retinoic acid metabolizing enzyme, CYP26A1. Oncogene 2010; 29: 1135–44. [DOI] [PubMed] [Google Scholar]
- 19. Giannelli G, Bergamini C, Fransvea E, Marinosci F, Quaranta V, Antonaci S. Human hepatocellular carcinoma cells require both α3β1 integrin and matrix metalloproteinases activity for migration and invasion. Lab Invest 2001; 81: 613–27. [DOI] [PubMed] [Google Scholar]
- 20. Grigioni WF, D’Errico A, Mancini AM et al. Hepatocellular carcinoma: expression of basement membrane glycoproteins. An immunohistochemical approach. J Pathol 1987; 152: 325–32. [DOI] [PubMed] [Google Scholar]
- 21. Arii S, Mise M, Harada T et al. Overexpression of matrix metalloproteinase 9 gene in hepatocellular carcinoma with invasive potential. Hepatology 1996; 24: 316–22. [DOI] [PubMed] [Google Scholar]
- 22. Arthur MJ. Degradation of matrix proteins in liver fibrosis. Pathol Res Pract 1994; 190: 825–33. [DOI] [PubMed] [Google Scholar]
- 23. Onodera M, Zen Y, Harada K et al. Fascin is involved in tumor necrosis factor‐α‐dependent production of MMP9 in cholangiocarcinoma. Lab Invest 2009; 89: 1261–74. [DOI] [PubMed] [Google Scholar]
- 24. Machesky LM, Li A. Fascin: invasive filopodia promoting metastasis. Commun Integr Biol 2010; 3: 263–70. [DOI] [PMC free article] [PubMed] [Google Scholar]
- 25. Thiery JP, Acloque H, Huang RY, Nieto MA. Epithelial‐mesenchymal transitions in development and disease. Cell 2009; 139: 871–90. [DOI] [PubMed] [Google Scholar]
- 26. Radisky ES, Radisky DC. Matrix metalloproteinase‐induced epithelial‐mesenchymal transition in breast cancer. J Mammary Gland Biol Neoplasia 2010; 15: 201–12. [DOI] [PMC free article] [PubMed] [Google Scholar]
- 27. Kaimori A, Potter J, Kaimori JY, Wang C, Mezey E, Koteish A. Transforming growth factor‐β1 induces an epithelial‐to‐mesenchymal transition state in mouse hepatocytes in vitro . J Biol Chem 2007; 27: 22089–101. [DOI] [PubMed] [Google Scholar]
- 28. Grise F, Bidaud A, Moreau V. Rho GTPases in hepatocellular carcinoma. Biochim Biophys Acta 2009; 1795: 137–51. [DOI] [PubMed] [Google Scholar]
- 29. Kim SJ, Choi IJ, Cheong TC et al. Galectin‐3 increases gastric cancer cell motility by up‐regulating fascin‐1 expression. Gastroenterology 2010; 138: 1035–45. [DOI] [PubMed] [Google Scholar]
- 30. Chiyomaru T, Enokida H, Tatarano S et al. miR‐145 and miR‐133a function as tumour suppressors and directly regulate FSCN1 expression in bladder cancer. Br J Cancer 2010; 102: 883–91. [DOI] [PMC free article] [PubMed] [Google Scholar]
- 31. Chen L, Yang S, Jakoncic J, Zhang JJ, Huang XY. Migrastatin analogues target fascin to block tumour metastasis. Nature 2010; 464: 1062–6. [DOI] [PMC free article] [PubMed] [Google Scholar]