

Abstract
KRAS mutations have been identified as a strong predictor of resistance to anti‐epidermal growth factor receptor (EGFR) therapies. Besides inhibiting the EGFR pathway, anti‐EGFR monoclonal antibodies may exert antitumor effects through antibody‐dependent cell‐mediated cytotoxicity (ADCC). Through this mechanism, the antibody fragment C portion (Fcγ) interacts with Fc receptors (FcγRs) expressed by immune effectors cells. We investigated the association of FcγR polymorphisms and KRAS mutation with the clinical outcome of 104 refractory metastatic colorectal cancer (mCRC) patients treated with anti‐EGFR antibodies. FcγRIIa‐H131R and FcγRIIIa‐V158F polymorphisms were analyzed in genomic DNA using a 48.48 dynamic array on the BioMark system (Fluidigm, South Sanfrancisco, CA, USA). Tumor tissues from 96 cases were screened for KRAS mutations. KRAS mutation was associated with a lower response rate (RR) (P = 0.035) and a shorter progression‐free survival (PFS) (3 vs 7 months; P = 0.36). FcγRIIa‐H131R and FcγRIIIa‐V158F polymorphisms did not show statistically significant associations with response, PFS, or KRAS status. In the logistic regression analysis, KRAS status (P = 0.04) and skin toxicity (P = 0.03) were associated with RR. By multivariate analysis, the clinical risk classification (P = 0.006) and skin toxicity (P < 0.0001) were found to be independent risk factors for PFS. In conclusion, the FcγRIIa and FcγRIIIa polymorphisms are not useful as molecular markers for clinical outcome in mCRC patients. To date, the EORTC (European Organization for Research and Treatment of Cancer Classification), skin toxicity, and KRAS status are the only reliable biomarkers to identify patients that would benefit from anti‐EGFR therapy. (Cancer Sci 2010)
Colorectal cancer is one of the most frequent causes of cancer deaths worldwide. Survival has improved in the last decade due to the development of new combinations of chemotherapy and to the recent introduction of targeted therapies.
Two anti‐epidermal growth factor receptor (EGFR) antibodies (cetuximab and panitumumab) show activity in metastatic colorectal cancer (mCRC). Cetuximab, a chimeric immunoglobulin 1 (IgG1) monoclonal antibody, targeted against the extracellular domain of the EGFR, has demonstrated efficacy in chemorefractory mCRC patients.( 1 , 2 ) Recently, the phase III trial CRYSTAL conducted by Van Cutsem et al. showed that first‐line treatment with cetuximab plus Infusional fluorouracil/leucovorin plus irinotecan (FOLFIRI) reduced the risk of progression of metastatic colorectal cancer as compared with FOLFIRI alone. This study also demonstrated that the benefit of cetuximab was limited to patients with KRAS wild‐type tumors.( 3 ) Panitumumab, a fully human monoclonal IgG2 antibody that targets the EGFR, was approved as monotherapy for patients with KRAS wild‐type tumors after failure of fluorpyrimidine‐, oxaliplatin‐, and irinotecan‐based regimes.( 4 )
The investigation of molecular markers that could potentially predict clinical response or resistance to anti‐EGFR is of high interest to avoid unnecessary drug toxicity and reduce treatment costs. KRAS mutation has been associated with the inefficacy of cetuximab and panitumumab( 3 , 5 ) and to date remains the most relevant biological marker of anti‐EGFR resistance. However, as KRAS status cannot predict the clinical outcome in cases with a wild‐type genotype, the search of novel markers independent of KRAS status is warranted. Cetuximab, and possibly panitumumab may exert anti‐tumor effects by means of antibody‐dependent cell‐mediated cytotoxicity (ADCC). The antibody fragment C portion (Fcγ) interacts with Fc receptors (FcγRs) expressed by immune effector cells.( 6 ) Polymorphisms have been described in genes coding for FcγRIIa and in FcγRIIIa. A histidine/arginine polymorphism at position 131 for the FcγRIIa gene and valine/phenylalanine polymorphism at position 158 for the FcγRIIIa gene have been reported to be functionally relevant in the ADCC mechanism.
The aim of this study was to investigate the association of the above‐mentioned FcγR polymorphisms and KRAS mutation with the clinical outcome of refractory mCRC patients treated with cetuximab or panitumumab in monotherapy or in combination with chemotherapy.
Materials and Methods
Eligible patients. A total of 104 patients (66 males, 38 females; median age, 64 years) with histopathologically proven metastatic colorectal adenocarcinoma, who failed at least one prior chemotherapy regimen, were included in this study. The patients were treated from 2004 to 2009 with cetuximab or panitumumab as monotherapy or in combination with chemotherapy. Relevant clinical data (gender, age, Eastern Cooperative Oncology Group [ECOG] performance status score, etc.) were obtained from clinical records. Patients were classified according to the European Organization for Research and Treatment of Cancer (EORTC) clinical model validated by Köhne et al. ( 7 ) Skin toxicity was graded according to the National Cancer Institute Common Toxicity Criteria (version 2.0). The response to treatment was evaluated every 2 to 3 months by tomodensitometry according to the Response Evaluation Criteria in Solid Tumours (RECIST)( 8 ) and classified as: (i) complete response (CR); (ii) partial response (PR); (iii) stable disease (SD); or (iv) progressive disease (PD). For the statistical analysis, the best tumor response was selected. The median follow‐up time was 9.5 months (range, 0.5–44 months). All patients signed an informed consent for tissue and blood collection for the study of molecular correlates. This retrospective analysis was approved by the Institutional Ethics Committee.
KRAS mutational analysis. KRAS mutations in codon 12 and 13 were assessed on tumor DNA. Mutational analysis was performed by PCR amplification of exon 1 of the KRAS gene following previously reported conditions.( 9 ) The purified PCR products were automatically sequenced on an ABI Prism 3130 (Applied Biosystems, Foster City, CA, USA).
FcγRIIa‐H131R and FcγRIIIa‐V158F genotyping. The genomic DNA was extracted from peripheral leucocytes by the salting‐out procedure.( 10 ) We genotyped all patient samples for the FcγRIIa‐H131R and FcγRIIIa‐V158F polymorphisms using a 48.48 dynamic array on the BioMark system (Fluidigm). The sample and the TaqMan SNP Genotyping assay (Applied Biosystems) mixes were prepared following the manufacturer’s recommendations. Prior to loading the mixes into the inlets, the chip was primed in the NanoFlex IFC Controller. The sample and genotyping mixes were then loaded into the inlets of the dynamic array and again placed in the IFC Controller for loading and mixing for approximately 45 min. Polymerase chain reaction (PCR) was performed on the BioMark system with an initial 2 min at 50°C and 10 min at 95°C, followed by 40 cycles of 15 s at 95°C for denaturation and 1 min at 60°C for annealing and extension. Endpoint fluorescent image data were acquired on the BioMark Real‐Time PCR System and analyzed using Fluidigm SNP Genotyping Analysis software.
As a quality control, normal, heterozygous and homozygous sequenced samples were included on every array for each genotype.
Statistical analysis. The differences between categorical variables were measured by the χ2‐test. Logistic regression was used as a multivariate method to ascertain which variables independently predicted response after adjustment for other relevant clinical variables. The Kaplan–Meier estimates and log‐rank tests were used in the univariate analysis of progression‐free survival (PFS). Progression‐free survival (PFS) was calculated from the beginning of treatment until progression of the neoplasia or death. The Cox regression model was used for multivariate analyses of PFS. Results were considered statistically significant when P‐values were < 0.05.
Results
A total of 104 Caucasian patients were studied. Clinical data are shown in Table 1. Overall, 92 patients (88%) were treated with cetuximab plus chemotherapy and 12 patients (12%) were treated with panitumumab alone or in combination with irinotecan. One patient had CR, 19 had PR (18%), 44 had SD (42%), and 35 progressed (34%). Five patients were not evaluated. The median PFS was 4 months (range, 0.5–30 months) and median overall survival was 9.5 months (range, 0.5–44 months).
Table 1.
Baseline characteristics of metastatic colorectal cancer patients treated with anti‐EGFR based therapy (n = 104)
| No. | % | |
|---|---|---|
| Mean age, years | 64 | |
| Range | 34–85 | |
| Sex | ||
| Female | 38 | 36 |
| Male | 66 | 64 |
| ECOG performance status score | ||
| 0–1 | 79 | 76 |
| 2 | 25 | 24 |
| Anatomic site | ||
| Right colon | 21 | 20 |
| Left colon | 10 | 10 |
| Sigmoid | 34 | 33 |
| Rectosigmoid | 10 | 10 |
| Rectum | 28 | 27 |
| No. previous lines of chemotherapy | ||
| 1 | 46 | 44 |
| 2 | 46 | 44 |
| 3 | 8 | 8 |
| 4 | 4 | 4 |
| Clinical classification | ||
| Low risk | 30 | 29 |
| Intermediate risk | 49 | 47 |
| High risk | 25 | 24 |
| Treatment | ||
| Cetuximab + irinotecan/FOLFIRI | 72/14 | 69/13 |
| Cetuximab + FOLFOX/capecitabine | 5/1 | 5/1 |
| Panitumumab + Irinotecan | 8 | 8 |
| Panitumumab alone | 4 | 4 |
| Tumor response | ||
| Complete response | 1 | 1 |
| Partial response | 19 | 18 |
| Stable disease | 44 | 42 |
| Progressive disease | 35 | 34 |
ECOG, Eastern Cooperative Oncology Group; EGFR, epidermal growth factor receptor; FOLFIRI, fluororacil, leucovorin and irinotecan; FOLFOX, fluororacil, leucovorin and oxaliplatin.
Clinical parameters and outcomes. There were significant differences in the clinical response when patients were grouped in accordance with the clinical classification (EORTC model). While 21% of the low‐risk patients achieved a CR/PR, only 4% of high risk patients presented a PR. In a similar way, 14% of low risk patients had a progressive disease compared to 72% of high risk patients (P < 0.0001). Accordingly, a longer median PFS was observed in low risk patients compared with high risk patients (8 months [95% confidence interval, CI, 6.1–9.9] vs 2 months [95% CI, 1–2.9] P < 0.0001) (Table 2). Overall survival also differed in accordance with the clinical classification (13 months in low‐ and intermediate‐risk patients [95% CI, 7.3–18.6 months] vs 5 months in high‐risk patients [95% CI, 3.2–6.7 months]; P < 0.0001).
Table 2.
Clinical classification (EORTC model) and outcome of mCRC patients treated with anti‐EGFR‐based therapy
| Clinical classification | P‐value | ||||||
|---|---|---|---|---|---|---|---|
| Low risk | Intermediate risk | High risk | |||||
| N | 28 | 46 | 25 | ||||
| Response | No. | % | No. | % | No. | % | |
| CR/PR | 6 | 21 | 14 | 30 | 1 | 4 | <0.0001* |
| SD | 18 | 64 | 19 | 41 | 6 | 24 | |
| PD | 4 | 14 | 13 | 28 | 18 | 72 | |
| Median PFS (months) | 8 | 7 | 2 | <0.0001† | |||
| 95% CI | 6.1–9.8 | 4.1–9.8 | 1–2.9 | ||||
*Fisher’s exact test; †log‐rank test. CI, confidence interval; CR, complete response; EGFR, epidermal growth factor receptor; EORTC, European Organization for Research and Treatment of Cancer; mCRC, metastatic colorectal cancer; PFS, progression‐free survival; PR, partial response; SD, stable disease.
Grade 2 or 3 skin rash was observed in 68 patients (65%). Skin rash severity was significantly associated with clinical response; 19 patients (29%) with severe skin toxicity responded to treatment versus only two patients (6%) with grade 0 or 1 of skin toxicity (P < 0.009). Skin rash severity was associated with a better PFS (P < 0.0001; Fig. 1a) and OS (P < 0.006; Fig. 1b).
Figure 1.
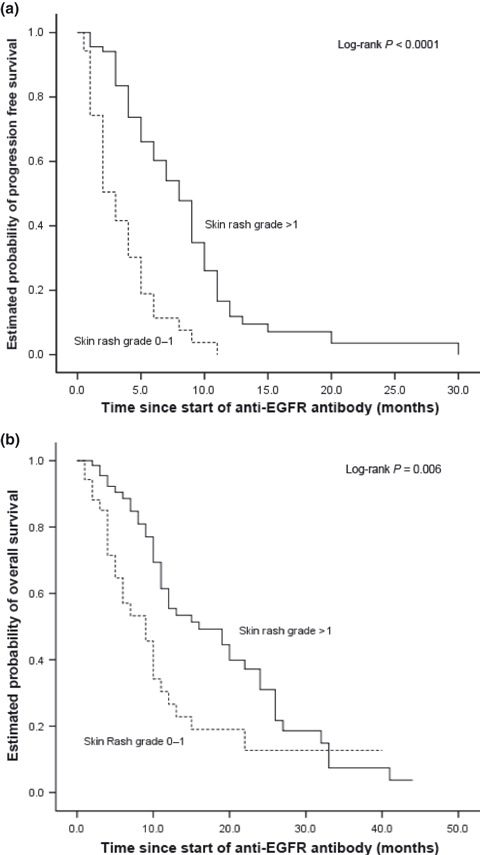
(a) Kaplan–Meier curve for progression‐free survival and skin toxicity in metastatic colorectal cancer (mCRC) patients treated with anti‐epidermal growth factor receptor (EGFR) therapy. (b) Kaplan–Meier curve for overall survival and skin toxicity in mCRC patients treated with anti‐EGFR therapy.
Genetic determinants and outcomes. Table 3 shows the frequencies of the two polymorphisms in the FcγRIIa and FcγRIIIa genes and KRAS mutation status. Frequencies of the polymorphisms studied were similar to those reported previously in a Caucasian population. There was no linkage disequilibrium between the FcγRIIa and FcγRIIIa polymorphisms in our group of patients (r 2 = 0.02). KRAS status was evaluated in 96 cases and a mutation was detected in the tumor of 22 patients (21%). Epidermal growth factor receptor (EGFR) expression status obtained by immunohistochemistry was negative in 44% of cases, <10% in 12%, 10–30% in 18%, and >30% in 5%. No relation was observed between EGFR expression and response. There was no concordance between the FcγRIIa and FcγRIIIa polymorphisms and EGFR status, excluding the involvement of this parameter in the ADCC activity.
Table 3.
Frequencies of genetic determinants
| No. | % | |
|---|---|---|
| KRAS status | ||
| Wild type | 74 | 71 |
| Mutated | 22 | 21 |
| Non‐assessable | 8 | 8 |
| FcγRIIa polymorphism | ||
| H/H | 27 | 26 |
| H/R | 54 | 52 |
| R/R | 23 | 22 |
| FcγRIIIa polymorphism | ||
| V/V | 16 | 15 |
| V/F | 41 | 39 |
| F/F | 47 | 45 |
F, phenylalanine allele; FcγR, fragment c γ receptor; H, histidine allele; R, arginine allele; V, valine allele.
KRAS mutation was associated with a lower response rate: only one out of 22 patients with this mutation responded. Nineteen out of 69 nonmutated patients were responders (4.5%vs 27.5%; P = 0.035). Patients without KRAS mutation showed a trend to longer median PFS compared to mutated patients (7 vs 3 months; P = 0.36) (Table 4).
Table 4.
KRAS status and outcome of mCRC patients treated with anti‐EGFR‐based therapy
| KRAS status | P‐value | ||||
|---|---|---|---|---|---|
| Wild type | Mutated | ||||
| n | 69 | 22 | |||
| Response | No. | % | No. | % | |
| CR/PR | 19 | 27.5 | 1 | 4.5 | 0.035* |
| SD/PD | 50 | 72.5 | 21 | 95.5 | |
| Median PFS (months) 95% CI | 7 5–8.9 | 3 1.2–4.7 | 0.36† | ||
*Fisher’s exact test; †log‐rank test. CI, confidence interval; CR, complete response; EGFR, epidermal growth factor receptor; mCRC, metastatic colorectal cancer; PFS, progression‐free survival; PR, partial response; SD, stable disease.
No statistically significant differences were observed in response to treatment or PFS based on the FcγRIIa‐H131R polymorphism. Neither did we observe a significant association when considering this polymorphism together with the KRAS status. However, patients with FcγRIIa‐131R/R and wild‐type KRAS showed a better response rate than those with the H/H or H/R genotype (53%vs 22% and 19% respectively; P = 0.1) (Table 5).
Table 5.
Outcome of patients treated with anti‐EGFR‐based therapy according to FcγRIIa polymorphism and KRAS mutations
| Whole group | FcγRIIa | P‐value | |||||
|---|---|---|---|---|---|---|---|
| H/H | H/R | R/R | |||||
| Response | No. | % | No. | % | No. | % | |
| CR/PR | 4 | 17 | 8 | 15 | 9 | 41 | 0.13* |
| SD | 9 | 37 | 26 | 49 | 8 | 36 | |
| PD | 11 | 46 | 19 | 36 | 5 | 23 | |
| Median PFS (months) | 4 | 6 | 6 | 0.61† | |||
| 95% CI | 2.9–5 | 3.4–8.5 | 3.6–8.3 | ||||
| wt KRAS | |||||||
| Response | No. | % | No. | % | No. | % | |
| CR/PR | 4 | 22 | 7 | 19 | 8 | 53 | 0.1* |
| SD | 6 | 33 | 18 | 50 | 5 | 33 | |
| PD | 8 | 44 | 11 | 31 | 2 | 13 | |
| Median PFS (months) | 5 | 7 | 7 | 0.7† | |||
| 95% CI | 3.5–6.5 | 4.2–9.7 | 5.5–8.4 | ||||
| mut KRAS | |||||||
| Response | No. | % | No. | % | No. | % | |
| CR/PR | – | – | 1 | 7 | – | – | 1.0* |
| SD | 2 | 50 | 7 | 47 | 2 | 67 | |
| PD | 2 | 50 | 6 | 47 | 1 | 33 | |
| Median PFS (months) | 3 | 3 | 6 | 0.7† | |||
| 95% CI | 0.6–5.9 | 0.7–5.2 | 0–12.4 | ||||
*Fisher’s exact test; †log‐rank test. CI, confidence interval; CR, complete response; EGFR, epidermal growth factor receptor; FcγR, fragment c γ receptor; H, histidine allele; mut, mutated; PFS, progression‐free survival; PR, partial response; R, arginine allele; SD, stable disease; wt, wild‐type.
Similarly, no statistically significant difference was observed for tumor response based on FcγRIIIa‐V158F polymorphism, regardless of KRAS status (Table 6).
Table 6.
Outcome of patients treated with anti‐EGFR‐based therapy according to FcγRIIIa polymorphism and KRAS mutations
| Whole group | FcγRIIIa | P‐value | |||||
|---|---|---|---|---|---|---|---|
| V/V | V/F | F/F | |||||
| Response | No. | % | No. | % | No. | % | |
| CR/PR | 4 | 27 | 7 | 18 | 10 | 22 | 0.5* |
| SD | 4 | 27 | 16 | 42 | 23 | 50 | |
| PD | 7 | 46 | 15 | 40 | 13 | 28 | |
| Median PFS (months) | 4 | 5 | 7 | 0.5† | |||
| 95% CI | 2.8–5.1 | 3.9–6 | 4.3–9.6 | ||||
| wt KRAS | |||||||
| Response | No. | % | No. | % | No. | % | |
| CR/PR | 4 | 33 | 6 | 25 | 9 | 27 | 0.6* |
| SD | 3 | 25 | 10 | 42 | 16 | 48 | |
| PD | 5 | 42 | 8 | 33 | 8 | 24 | |
| Median PFS (months) | 4 | 8 | 7 | 0.3† | |||
| 95% CI | 1.1–6.8 | 4.2–11.7 | 4.9–9.1 | ||||
| mut KRAS | |||||||
| Response | No. | % | No. | % | No. | % | |
| CR/PR | – | – | 1 | 9 | – | – | 0.3* |
| SD | – | – | 4 | 36 | 7 | 70 | |
| PD | 1 | 100 | 6 | 55 | 3 | 30 | |
| Median PFS (months) | 2 | 3 | 6 | 0.3† | |||
| 95% CI | 0.8–5.1 | 0–13.7 | |||||
*Fisher’s exact test; †log‐rank test. CI, confidence interval; CR, complete response; EGFR, epidermal growth factor receptor; F, phenylalanine allele; FcγR, fragment c γ receptor; mut, mutated; PFS, progression‐free survival; PR, partial response; SD, stable disease; V, valine allele; wt, wild‐type.
Combining the FcγRIIa‐H131R and FcγRIIIa polymorphisms we established a favorable genotype (patients homozygous 131 R/R and/or 158 F/F) and a non‐favorable genotype (patients homozygous 131 H/H and/or 158 V/V). No significant difference was observed for tumor response and PFS between these genotype subsets (Table 7).
Table 7.
Outcome of patients treated with anti‐EGFR‐based therapy according to the combination of FcγRIIa and FcγRIIIa polymorphisms
| FcγR combined | P‐value | ||||
|---|---|---|---|---|---|
| H/H and/or V/V | R and F | ||||
| Response | No. | % | No. | % | |
| CR/PR | 8 | 22 | 13 | 21 | 0.5* |
| SD | 13 | 36 | 30 | 48 | |
| PD | 15 | 42 | 20 | 32 | |
| Median PFS (months) | 5 | 7 | 0.27† | ||
| 95% CI | 3.9–6.1 | 4.6–9.4 | |||
| R/R and/or F/F | H and V | ||||
| Response | No. | % | No. | % | |
| CR/PR | 13 | 25 | 8 | 17 | 0.17* |
| SD | 25 | 48 | 18 | 38 | |
| PD | 14 | 27 | 21 | 45 | |
| Median PFS (months) | 7 | 5 | 0.9† | ||
| 95% CI | 5.4–8.6 | 3.8–6.2 | |||
*Fisher’s exact test; †log‐rank test. CI, confidence interval; CR, complete response; EGFR, epidermal growth factor receptor; F, phenylalanine allele; FcγR, fragment c γ receptor; PFS, progression‐free survival PR, partial response; SD, stable disease; V, valine allele.
A logistic regression analysis indicated that KRAS status (odds ratio [OR] = 0.11; 95% CI, 0.01–0.93; P = 0.04) and skin toxicity (OR = 2.52; 95% CI, 1.09–5.85; P = 0.03) were the only independent predictive factors for response.
A multivariate Cox regression model that included baseline characteristics showed that the clinical risk classification (HR: 0.24; 95% CI, 0.08–0.66; P = 0.006) and skin toxicity (HR: 0.5; 95% CI, 0.37–0.67; P < 0.0001) were independent risk factors for PFS. Skin rash showed a trend to a better OS (HR: 0.73; 95% CI, 0.53–1; P = 0.052). FcγRIIa‐H131R and FcγRIIIa‐V158F polymorphisms were not shown to be independent predictors of PFS and OS.
Discussion
Although KRAS status has been identified as the most relevant molecular marker of non‐response to anti‐EGFR monoclonal antibodies,( 11 , 12 , 13 ) not all wild‐type patients respond. Furthermore, some mutant patients experience long‐term disease control,( 12 , 14 , 15 ) suggesting that KRAS mutation is not the only genetic alteration conferring resistance to cetuximab.
In addition to their EGFR antagonist function, cetuximab and possibly panitumumab have a functional fragment C portion with potential therapeutic properties. This fragment C portion can bind to the IgG fragment C receptor (FcγR) which is located on cytotoxic cells (natural killer lymphocytes or macrophages) and allows antitumor activity via ADCC.( 16 )
In an in vitro study, Parren et al. found the first evidence supporting the role of the FcγR coding genes in the ADCC mechanism. On studying the FcγRIIa gene, they showed that the 131H allele had a higher binding efficiency for human IgG2 antibodies than the 131R allele.( 17 )
Pharmacogenetic studies have recently reported controversial results regarding the involvement of two genetic polymorphisms (H131R and V158F) located at the extracellular ligand‐binding domain of two receptors (FcγRIIa and FcγRIIIa, respectively) in immune cells. Here we discuss only the pharmacogenetic results obtained in colorectal cancer patients treated with anti EGFR antibodies.
Zhang et al. studied 39 mCRC treated with single‐agent cetuximab.( 6 ) The two mentioned FcγR gene polymorphisms were associated with clinical outcome. Patients with the FcγRIIa‐131H allele had a longer PFS than patients with the FcγRIIa‐131R allele. Combined analysis of these two polymorphisms showed that patients with the favorable genotypes (FcγRIIa, any histidine allele, and FcγRIIIa, any phenylalanine allele) showed a median PFS of 3.7 months (95% CI, 2.4–4.4 months), whereas patients with any two unfavorable genotypes (FcγRIIa arginine/arginine or valine/valine) had a PFS of 1.1 months (95% CI, 1.0–1.4 months; P = 0.04; long‐rank test). These authors increased the sample to a total of 130 patients, all of whom were part of a phase II open‐label multicenter clinical trial (IMC 0144) with cetuximab. This broad study of North American patients analyzed genetic markers in different genes, and the previous associations of the FcγRIIa‐FcγRIIIa polymorphisms with clinical outcomes could not be replicated.( 18 )
Graziano et al. investigated possible associations between genetic variants in genes that could influence cetuximab‐related pathways and clinical outcomes in 110 mCRC European patients. They were treated with cetuximab–irinotecan salvage therapy. No statistically significant associations between the FcγRIIa‐FcγRIIIa polymorphisms and patients outcome were reported .( 19 )
More recently, other authors evaluated the association of FcγRIIa and FcγRIIIa polymorphisms and KRAS mutation with the outcome of irinotecan‐refractory mCRC patients (n = 69) treated with cetuximab plus irinotecan. Those patients with FcγRIIa‐131H/H and/or FcγRIIIa‐158V/V had a longer PFS than 131R and 158F carriers (5.5 vs 3.0 months; P = 0.005). The difference remained significant for mutated‐KRAS patients. Multivariate analysis showed that KRAS mutation and FcγR combined status were independent risk factors for PFS.( 15 )
The present study confirmed the prognostic clinical model proposed by Köhne et al. based on four baseline clinical parameters: performance status, level of white blood cell count, alkaline phosphatase, and number of involved tumor sites.( 7 ) As our results showed a very poor outcome in the high‐risk group of patients, the use of a monoclonal antibody treatment should not be considered for this population. Our study also confirmed that the presence and severity of skin rash was associated with improved clinical efficacy, as previously reported by other authors.( 1 , 20 , 21 ) However, it should be pointed out that skin toxicity cannot be considered a clinically useful baseline feature to preselect those patients who would benefit from anti‐EGFR therapies.
As reported in previous publications, the presence of a KRAS mutation in tumor DNA was highly associated with a poor response.( 3 ) In our series only one out of 22 mutated patients responded, while 19 out of 69 wild‐type cases achieved a clinical response. In addition, patients with a wild‐type KRAS status had a longer PFS (7 vs 3 months; P = 0.36). The low frequency of KRAS mutations in our group of patients was due to the fact that patients were treated with anti‐EGFR therapies, without taking KRAS status into consideration until 2008. Since then, only wild‐type KRAS patients have been treated with anti EGFR monoclonal antibodies.
In our study, as in those previously reported with a high number of patients,( 18 , 19 ) FcγR polymorphisms did not show any significant association with response to anti‐EGFR therapy, and no significant effect was detected in the PFS in relation with these polymorphisms, whatever the KRAS status.
The present study has its limitations. First, most patients analyzed were treated with chemotherapy plus anti‐EGFR monoclonal antibodies, while the ideal scenario to analyze the ADCC mechanism would be to include patients treated with anti‐EGFR in monotherapy. Second, like other authors, we examined only two polymorphisms in only two genes involved in the ADCC mechanism. The results regarding the involvement of the FcγR polymorphisms in the efficacy of anti‐EGFR are controversial. Differences in patients’ characteristics, study design, therapeutic protocols, and even in the distribution of genotypes in the different patient groups might, in part, explain the discrepancies. The role of ADCC in anti‐EGFR efficacy is, therefore, yet to be thoroughly investigated.
To the best of our knowledge, this is the first study to show that the clinical risk EORTC classification is a prognostic marker – independently of the skin toxicity and of the KRAS status – in mCRC patients treated with chemotherapy and monoclonal antibodies. Our findings allow us to conclude that the FcγRIIa and FcγRIIIa polymorphisms are not useful as molecular markers for clinical outcome in mCRC patients. Markers of poor prognosis other than KRAS mutation, such as v‐raf murine sarcoma viral oncogene homolog B1 (BRAF) mutation, phosphatidylinositol 3‐kinase, catalytic, alpha polypeptide (PIK3CA) mutation, and phosphatase and tensin homolog (PTEN) loss, should be investigated as a next step.
Acknowledgments
D.P. is a fellowship recipient of the Instituto de Salud Carlos III (CM08/00065). This study was supported in part by Instituto de Salud Carlos III (FIS/080199). The authors thank Carolyn Newey for English‐language editing.
References
- 1. Cunningham D, Humblet Y, Siena S et al. Cetuximab monotherapy and cetuximab plus irinotecan in irinotecan‐refractory metastatic colorectal cancer. N Engl J Med 2004; 351: 337–45. [DOI] [PubMed] [Google Scholar]
- 2. Saltz LB, Meropol NJ, Loehrer PJ Sr, Needle MN, Kopit J, Mayer RJ. Phase II trial of cetuximab in patients with refractory colorectal cancer that expresses the epidermal growth factor receptor. J Clin Oncol 2004; 22: 1201–8. [DOI] [PubMed] [Google Scholar]
- 3. Van Cutsem E, Köhne CH, Hitre E et al. Cetuximab and chemotherapy as initial treatment for metastatic colorectal cancer. N Engl J Med 2009; 360: 1408–17. [DOI] [PubMed] [Google Scholar]
- 4. Van Cutsem E, Peeters M, Siena S et al. Open‐label phase III trial of panitumumab plus best supportive care compared with best supportive care alone in patients with chemotherapy‐refractory metastatic colorectal cancer. J Clin Oncol 2007; 25: 1658–64. [DOI] [PubMed] [Google Scholar]
- 5. Amado RG, Wolf M, Peeters M et al. Wild‐type KRAS is required for panitumumab efficacy in patients with metastatic colorectal cancer. J Clin Oncol 2008; 26: 1626–34. [DOI] [PubMed] [Google Scholar]
- 6. Zhang W, Gordon M, Schultheis AM et al. FCGR2A and FCGR3A polymorphisms associated with clinical outcome of epidermal growth factor receptor expressing metastatic colorectal cancer patients treated with single‐agent cetuximab. J Clin Oncol 2007; 25: 3712–8. [DOI] [PubMed] [Google Scholar]
- 7. Köhne CH, Cunningham D, Di CF et al. Clinical determinants of survival in patients with 5‐fluorouracil‐based treatment for metastatic colorectal cancer: results of a multivariate analysis of 3825 patients. Ann Oncol 2002; 13: 308–17. [DOI] [PubMed] [Google Scholar]
- 8. Therasse P, Arbuck SG, Eisenhauer EA et al. New guidelines to evaluate the response to treatment in solid tumors. European Organization for Research and Treatment of Cancer, National Cancer Institute of the United States, National Cancer Institute of Canada. J Natl Cancer Inst 2000; 92: 205–16. [DOI] [PubMed] [Google Scholar]
- 9. Lagarda H, Catasus L, Arguelles R, Matias‐Guiu X, Prat J. K‐ras mutations in endometrial carcinomas with microsatellite instability. J Pathol 2001; 193: 193–9. [DOI] [PubMed] [Google Scholar]
- 10. Miller SA, Dykes DD, Polesky HF. A simple salting out procedure for extracting DNA from human nucleated cells. Nucleic Acids Res 1988; 16: 1215. [DOI] [PMC free article] [PubMed] [Google Scholar]
- 11. Lièvre A, Bachet JB, Le Corre D et al. KRAS mutation status is predictive of response to cetuximab therapy in colorectal cancer. Cancer Res 2006; 66: 3992–5. [DOI] [PubMed] [Google Scholar]
- 12. Lièvre A, Bachet JB, Boige V et al. KRAS mutations as in independent prognostic factor in patients with advanced colorectal cancer treated with cetuximab. J Clin Oncol 2008; 26: 374–9. [DOI] [PubMed] [Google Scholar]
- 13. Allegra CJ, Jessup JM, Somerfield MR et al. American Society of Clinical Oncology provisional clinical opinion: testing for KRAS gene mutations in patients with metastatic colorectal carcinoma to predict response to anti‐epidermal growth factor receptor monoclonal antibody therapy. J Clin Oncol 2009; 27: 2091–5. [DOI] [PubMed] [Google Scholar]
- 14. Di Fiore F, Blanchard F, Charbonnier F et al. Clinical relevance of KRAS mutation detection in metastatic colorectal cancer treated by Cetuximab plus chemotherapy. Br J Cancer 2007; 96: 1166–9. [DOI] [PMC free article] [PubMed] [Google Scholar]
- 15. Bibeau F, Lopez‐Crapez E, Di Fiore F et al. Impact of FcγRIIa‐FcγRIIIa Polymorphisms and KRAS Mutations on the Clinical Outcome of patients with metastatic colorectal cancer treated with cetuximab plus irinotecan. J Clin Oncol 2009; 27: 1122–9. [DOI] [PubMed] [Google Scholar]
- 16. Lièvre A, Laurent‐Puig P. Toward an individualizing therapy for colorectal cancer: the example of the anti‐EGFR monoclonal antibodies. Per Med 2009; 6: 145–57. [DOI] [PubMed] [Google Scholar]
- 17. Parren PW, Warmerdam PA, Boeije LC et al. On the interaction of IgG subclasses with the low affinity Fc gamma RIIa (CD32) on human monocytes, neutrophils, and platelets. Analysis of a functional polymorphism to human IgG2. J Clin Invest 1992; 90: 1537–46. [DOI] [PMC free article] [PubMed] [Google Scholar]
- 18. Lurje G, Nagashima F, Zhang W et al. Polymorphisms in cyclooxygenase‐2 and epidermal growth factor receptor are associated with progression‐free survival independent of K‐ras in metastatic colorectal cancer patients treated with single‐agent cetuximab. Clin Cancer Res 2008; 14: 7884–95. [DOI] [PubMed] [Google Scholar]
- 19. Graziano F, Ruzzo A, Loupakis F et al. Pharmacogenetic profiling for cetuximab plus irinotecan therapy in patients with refractory advanced colorectal cancer. J Clin Oncol 2008; 26: 1427–34. [DOI] [PubMed] [Google Scholar]
- 20. Jonker DJ, O’Callaghan CJ, Karapetis CS et al. Cetuximab for the treatment of colorectal cancer. N Engl J Med 2007; 357: 2040–8. [DOI] [PubMed] [Google Scholar]
- 21. Lenz HJ, Van Cutsem E, Khambata‐Ford S et al. Multicenter phase II and translational study of cetuximab in metastatic colorectal carcinoma refractory to irinotecan, oxaliplatin, and fluoropyrimidines. J Clin Oncol 2006; 24: 4914–21. [DOI] [PubMed] [Google Scholar]