Abstract
NEU3 is a membrane sialidase specific for gangliosides. Its increased expression and implication in some cancers have been reported. Here, we analyzed NEU3 expression in malignant melanoma cell lines and its roles in the cancer phenotypes. Quantitative RT‐PCR revealed that high levels of the NEU3 gene were expressed at almost equivalent levels with those in colon cancers. To examine the effects of overexpression of NEU3, NEU3 cDNA‐transfectant cells were established using a melanoma cell line SK‐MEL‐28 and its mutant N1 lacking GD3. SK‐MEL‐28 sublines overexpressing both the NEU3 gene and NEU3 enzyme activity showed no changes in both cell growth and ganglioside expression, while N1 cells showed a mild increase in cell proliferation with increased phosphorylation of the EGF receptor and neo‐synthesis of Gb3 after NEU3 transfection. In contrast, NEU3 silencing resulted in a definite reduction in cell growth in a melanoma line MeWo, while ganglioside patterns underwent minimal changes. Phosphorylation levels of ERK1/2 with serum stimulation decreased in the NEU3‐silenced cells. All these results suggest that NEU3 is highly expressed to enhance malignant phenotypes including apoptosis inhibition in malignant melanomas. (Cancer Sci 2011; 102: 2139–2149)
In malignant transformed cells, various changes in glycosylation of membrane glycoproteins and glycolipids have been found. Some of them have been considered as tumor‐associated antigens, and have been used in diagnosis and/or cancer therapy.( 1 ) In particular, sialylated forms of complex carbohydrates have been considered to be involved in a variety of malignant properties of cancer cells such as cell proliferation, motility, invasion, adhesion and metastasis.( 2 ) Recently, the molecular mechanisms by which these sialylated complex carbohydrates play roles in cancer cells have been substantially investigated with genetic modification of glycosylaion machineries. Generally, sialylated forms of surface molecules are presented as an outcome of the balance between sialyltransferases and sialidase enzymes.( 3 )
Gangliosides, sialic acid‐containing glycosphingolipids, are expressed at high levels in nerve tissues of vertebrates.( 4 ) Some of them are also expressed in various human tumor cells such as malignant melanomas,( 5 ) neuroblastomas,( 6 ) T‐lymphoblastic leukemia cells (T‐ALL)( 7 ) and adult T‐cell leukemia cells.( 8 ) Because glycosyltransferase cDNA were isolated, direct approaches to address the regulatory mechanisms for the expression of gangliosides have been performed.( 9 ) In malignant melanomas, ganglioside GD3 is widely and specifically expressed,( 10 , 11 ) and the genetic and enzymatic basis for GD3 expression in melanomas have been studied by our group.( 12 ) As expected, increased expression of the GD3 synthase gene( 13 ) was primarily crucial for the expression of GD3 in melanomas.
As for degradation enzymes of gangliosides, sialidases have been suggested to play important roles in a variety of cellular functions. Alterations of the levels of ganglioside sialidase expression associated with malignant transformation have been described in 3T3‐transformed cells( 14 ) and in BHK‐transformed cells.( 15 ) However, little was known about the mechanisms by which sialidase was altered in these systems until ganglioside sialidase clones became available. Human sialidases have been identified and designated as NEU1, NEU2, NEU3 and NEU4 with distinct subcellular localization and enzymatic properties.( 16 ) Four types of sialidases are involved in carcinogenesis in different manners.( 16 ) Among them, NEU3 is a key enzyme for ganglioside degradation due to its strict substrate specificity to gangliosides,( 17 , 18 ) being localized on the surface membranes. NEU1 hydrolyzes mainly oligosaccharides and glycopeptides but not gangliosides.( 19 ) In contrast, NEU2( 20 ) and NEU4( 21 ) can act on gangliosides as well as oligosaccharides and glycoproteins depending on the optimal pH. In particular, human NEU3 have been studied for its alterations and implications in human cancers such as colon( 22 ) and renal cell cancers.( 23 ) (These data are summarized in Table S1.) However, to date, the expression and roles of NEU3 in malignant melanomas have never been studied.
In the present study, NEU3 gene expression in malignant melanoma cell lines was analyzed. Consequently, high levels of NEU3 expression were observed, prompting us to investigate roles of NEU3 in melanomas.
Materials and Methods
Cell lines. All melanoma cell lines were provided by Dr. L. J. Old at Memorial Sloan‐Kettering Cancer Center, New York. All colon cancer cell lines were obtained from RIKEN Cell Bank (Tsukuba, Japan). All human cancer cell lines were maintained in Dulbecco’s modified Eagle’s essential medium (D‐MEM) supplemented with 7.5% fetal calf serum (FCS) at 37°C in a humidified atmosphere containing 5% CO2.
Antibodies. Anti‐ganglioside antibodies were as follows: anti‐GD3, mAbR24 (mouse IgG3), as reported previously.( 24 ) Anti‐GM3, mAbGMR6 (mouse IgM), was purchased from Seikagaku‐kogyo, Tokyo, Japan. Anti‐CD17 (LacCer) mAb (mouse IgM) was from Ancell Corp. (Bayport, MN, USA). Antibodies to p44/42 MAP kinase and p‐p44/42 MAP kinase (rabbit IgG) were from Cell Signaling (Danvers, MA, USA). Anti‐epidermal growth factor (EGF) receptor (EGFR) antibody (rabbit IgG) and phosphorylation site‐specific antibodies (rabbit IgG) were from Cell Signaling. Anti‐NEU3 mAb (mouse IgG) was generated in our laboratory.
Real‐time reverse transcription (RT)‐PCR. The real‐time RT‐PCR was performed with DyNAmo HS SYBR Green qPCR Kit (FINNZYMES, Vantaa, Finland) according to the manufacturer’s protocol. To compare the relative expression levels of human NEU3 mRNA in various melanoma cell lines and colon cancer cell lines, total RNA was extracted from each cell line with a RNeasy Plus Mini Kit (Qiagen, Germantown, MD, USA), and cDNA was prepared from 4 μg of total RNA with oligo dT primer using RT. The sequence‐specific primers for NEU3 were: 5′‐GACTGGTCATCCCTGCGTAT‐3′ (forward) and 5′‐CAGTCACCTCTGCCACTT CA‐3′ (reverse); GD3 synthase, 5′‐GTGGTATGACGGGGAGTTTT‐3′ (forward) and 5′‐GGCATGGATTCCTCTACTTT‐3′ (reverse); and Gb3 synthase, 5′‐CCCACCTCTCTG CAATGG‐3′ (forward), and 5′‐GGTATCCCCAGATCAGACCA‐3′ (reverse).
Flow cytometry. The cell surface expression of gangliosides was analyzed using flow cytometry (Beckton Dickinson, Mountain View, CA, USA) as described previously.( 25 )
Preparation of siRNA. Several kinds of Stealth siRNA against some portion of human NEU3 cDNA were designed by Invitrogen and transfected into human melanoma cell line MeWo with Lipofectamine 2000 (Invitrogen, Carlsbad, CA, USA) according to the manufacturer’s protocol. Finally, the selected siRNA sequence for the silencing of NEU3 (siRNA: neu3‐s3) was as follows: sense, UAGAUCAUCAGAGAAUGAGGCCUGG; and antisense, CCAGGCCUCAUU CUCUGAUGAUCUA. As a non‐specific siRNA control (siRNA: GL2) (B‐Bridge International Inc., Sunnyvale, CA, USA), a sequence targeting firefly (Photinus pyralis) luciferase gene (X65324) 153–175 was used as described previously.( 25 )
Extraction of gangliosides and thin‐layer chromatography (TLC). Gangliosides were extracted essentially as described previously.( 26 ) Briefly, extracts from human melanoma cell lines were prepared with chloroform and methanol (2:1, 1:1 and 1:2), and desalted using a SepPak cartridge (Waters, Milford, MA, USA). Lipid fractions were separated into acidic and neutral fractions with DEAE‐Sephadex ion‐exchange column chromatography, and acidic fractions were analyzed as ganglioside fractions using HP‐TLC plates (Merck, Darmastadt, Germany) after desalting.( 26 ) The TLC was developed with a solvent system of chloroform:methanol:0.2% CaCl2/water (55:45:10), and bands were detected with resorcinol spray as described previously.( 27 )
Sialidase assay. Sialidase activity was assayed with gangliosides mixture or GM3 as substrates and Triton X‐100 as described previously.( 28 ) The sialic acid released during the reaction was determined by fluoromeric HPLC with malononitrile.( 29 )
Gene silencing of NEU3 by siRNA. Melanoma cells were plated at approximately 70% confluency in 6‐cm cell culture dishes and cultured overnight. They were transiently transfected in Opti‐MEM I medium (Invitrogen) with Lipofectamine 2000 (Invitrogen) with either control siRNA (GL2, 100 nM) or anti‐NEU3 siRNA (neu3‐s3, 100 nM) following the manufacturer’s instruction. Five hours later, the Opti‐MEM I medium was replaced with regular culture medium and cultured overnight. The next day, the second transfection with siRNA was performed following the same method as the first transfection. Downregulation of the NEU3 gene was assessed at 48 h after the first transfection with real‐time RT‐PCR. For the BrdU uptake assay, cells were collected after 2 days of transfection and replated for the assay.
BrdU uptake. Cells grown on a 60‐well plate were incubated in the presence of 5‐bromo‐2‐ deoxyuridine (BrdU) for 2 h according to the instructions of the Cell Proliferation Kit (GE Healthcare, Buckinghamshire, UK), then fixed with acid‐ethanol for 30 min. The cells were then immunostained with anti‐BrdU antibody and ALEXA546‐conjugated anti‐mouse antibody (Molecular Probes). The BrdU‐positive cells were observed using laser microscopy (OLYMPUS, Tokyo, Japan) and the percentage of BrdU‐positive cells was calculated.
Preparation of cell lysates. Cells were lysed with cell lysis buffer (20 mM Tris–HCl, 150 mM NaCl, 1 mM Na2EDTA, 1 mM EGTA, 1% Triton X‐100, 2.5 mM sodium pyrophosphate, 1 mM β‐glycerophosphate, 1 mM Na3VO4, 1 μg/mL leupeptin) (Cell Signaling) with 1 mM PMSF added. Insoluble materials were removed by centrifugation at 4°C at 10 000 g for 10 min.
Western immunoblotting. Cell lysates were separated using SDS‐PAGE with 8–15% gels. The separated proteins were transferred onto an Immunobilon‐P membrane (Millipore, Billerica, MA, USA). After blocking with BSA or non‐fat dry milk in PBS containing 0.05–0.1% Tween 20, the membranes were first probed with primary antibodies and incubated with goat anti‐rabbit IgG or goat anti‐mouse IgG conjugated with HRP (1:2000) as secondary antibodies. Bound conjugates on the membrane were visualized with an Enhanced Chemiluminescence detection system (PerkinElmer, Waltham, MA, USA) or ImmunoStar LD (Wako, Osaka, Japan).
Quantitative RT‐PCR (q‐PCR). Multiple q‐PCR was performed as previously described.( 30 ) Briefly, cDNA was synthesized from 4 μg of total RNA, and then subjected to a q‐PCR array with 186 glycogenes and three housekeeping genes. Copy numbers of transcripts in 7.5 ng of total RNA were calculated, and those under 100 were eliminated from the evaluation. SOTA analysis was performed using TMeV based on values with log(2).
Effects of exogenous glycolipids on cultured melanoma cells. N1 cells were plated in microtiter plates 60K (Greiner Bio‐One, Frickenhausen, Germany) at 100/well and cultured for 2 days. After washing with plain medium, glycolipid‐containing medium was added and incubated in CO2 incubator. Cell numbers in each well were counted after incubation in the regular medium for 4–8 h. LacCer was used for comparison.
Analysis of apoptosis signals. Cells were treated with H2O2 for 5 h in 1% FCS‐containing medium at 37°C and washed with 7.5% FCS‐containing medium. Then, 5 μM of CellEvent Caspase‐3/7 Green Detection Reagent (Life Technologies, Carlsbad, CA, USA) was added to the treated cells and incubated for 30 min at room temperature. The apoptotic cells were labeled with green fluorescence. These cells were imaged using the NIBA filter for FITC.
Statistical analysis. Statistical significance of the data was determined using the Student’s t‐test.
Results
High levels of NEU3 gene expression in human melanoma cell lines. Expression levels of NEU3 mRNA were very high in colon cancer cell lines.( 22 ) Levels of NEU3 mRNA in human melanoma cells were then examined. Seven human melanoma cell lines and six human colon cancer cell lines were used for analysis of the expression levels of the NEU3 gene using real‐time RT‐PCR. Expression levels varied among the cell lines. When compared with mRNA levels in colon cancer cell lines, those in melanomas were almost equivalent (Fig. 1A). These seven human melanoma cell lines were also used for analysis of the NEU3 mRNA levels using current RT‐PCR. Expression levels varied, but the average was close to that of colon cancer cell lines (Fig. S1).
Figure 1.
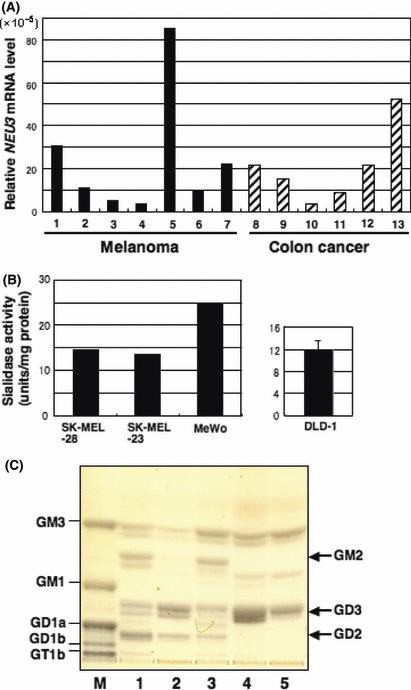
Levels of NEU3 mRNA and sialidase activities in human melanomas. (A) Levels of NEU3 mRNA. Seven human melanoma cell lines (1, SK‐MEL‐28; 2, SK‐MEL‐130; 3, SK‐MEL‐173; 4, SK‐MEL‐37; 5, MeWo; 6, SK‐MEL‐31; 7, SK‐MEL‐23) and six human colon cancer cell lines (8, DLD‐1, 9; Colo320, 10; CACO‐2; 11, SW1080; 12, HT‐29; 13, LoVo) were analysed by real‐time RT‐PCR. Note that five melanoma cells expressed high levels of NEU3 mRNA. (B) Sialidase activities in melanoma cells. Sialidase activities in melanoma cells were assayed with gangliosides as substrates and presented as units/mg protein (1 unit = nmol/h). The right panel is sialidase activity of a colon cancer cell line, DLD‐1, that was reported by Kakugawa et al. ( 22 ) (C) Ganglioside composition of human melanoma cells. Thin‐layer chromatography and resorcinol spray pattern of gangliosides in five melanoma cell lines. M, bovine brain ganglioside mixture; 1, SK‐MEL‐37; 2, SK‐MEL‐23; 3, SK‐MEL‐173; 4, SK‐MEL‐28; 5, MeWo.
High NEU3 sialidase activities in melanoma cells. Three melanoma cell lines showing relatively high levels of NEU3 mRNA were analyzed for their sialidase activities with gangliosides as substrates. All of these three cell lines showed high enzyme activities (14–25 units/mg proteins) comparable with mRNA levels (Fig. 1B). These values were equivalent levels to those shown in colon cancer cell lines.( 22 ) An example of DLD‐1 showing approximately 12 units/mg protein is shown for reference (Fig. 1B, right), which is cited from Kakugawa et al. ( 22 )
Gangliosides GD3 and GM3 as major gangliosides in melanoma cell lines. To compare ganglioside compositions of human melanoma cells, gangliosides were extracted from five melanoma cell lines, and analyzed using TLC and detected with a resorcinol spray (Fig. 1C). Melanoma cell lines showed various patterns of gangliosides with GM3 and GD3 as common major components among the five melanoma cell lines examined. Band intensities of GD3 in these five melanoma lines did not necessarily show an inverse proportion with RT‐PCR products of NEU3. Rather, they correlated with the mRNA levels of NEU3.
Overexpression of NEU3 in SK‐MEL‐28 resulted in no changes of phenotypes. A melanoma cell line, SK‐MEL‐28, was transfected with a cDNA expression vector of NEU3, and stable transfectant cells were established. As shown in Figure 2(A), control cells introduced with a vector alone (V1, 2, 11, 12, 20) showed low levels of NEU3 mRNA. In contrast, transfectant cells with a NEU3 expression vector (Neu14, 22, 27, 29) showed apparently higher levels than the controls (Fig. 2A). To examine the effects of overexpression of NEU3 cDNA on GD3 synthase, real‐time‐RT‐PCR was also performed for GD3 synthase, which showed no explainable changes (Fig. 2B). Using two each of the control lines and NEU3‐transfectant lines, the sialidase activity was examined. A NEU3‐transfectant cell line, Neu29, showing apparently increased mRNA of NEU3, had almost equivalent levels of sialidase activity with that in the control lines (Fig. 2C). In turn, Neu27 that showed very high expression levels of NEU3 gene exhibited significantly increased (3–4 times) enzyme activities. These results indicate that a strong increase in gene expression was needed to bring about significant increase in the enzyme activity.
Figure 2.
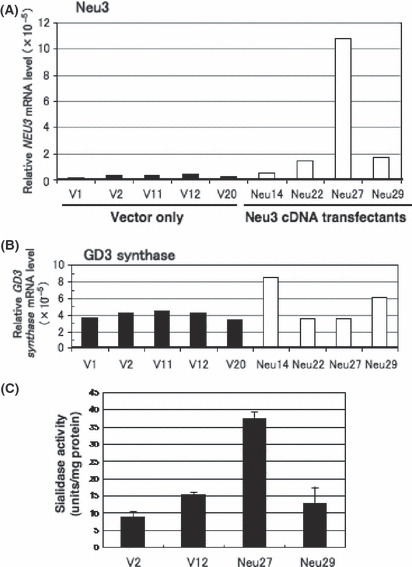
Overexpression of NEU3 cDNA in SK‐MEL‐28. (A) Relative mRNA levels of NEU3 as analyzed by quantitative RT‐PCR using RNA extracted from five controls and four transfected cell lines of a NEU3 expression vector. (B) Relative mRNA levels of GD3 synthase mRNA in individual control and transfectant lines as shown in (A). (C) Sialidase activity in NEU3 transfectants. Sialidase activity in cell extracts was assayed with gangliosides as substrates.
Increased expression of the NEU3 gene and/or enzyme activities did not affect ganglioside profiles. To examine the effects of overexpression of the NEU3 gene on ganglioside expression, flow cytometry and TLC of extracted gangliosides using two each of the control lines and transfectant lines were performed. As shown in Figure 3, there were no significant changes in the expression levels of GD3, which is the best substrate of NEU3 (Fig. 3A–C).( 17 ) No obvious changes were detected in the major gangliosides between the controls and the transfectants.
Figure 3.
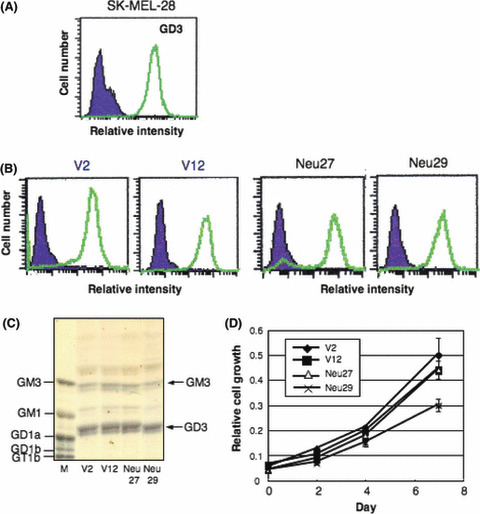
No changes in GD3 expression and cell growth in NEU3 transfectants. (A) Flow cytometry of GD3 expression in the parent line, SK‐MEL‐28. (B) GD3 expression in the transfected lines with vector alone and transfectant cell lines of NEU3 cDNA. Note expression of GD3 in Neu27 cells did not clearly change despite high NEU3 activity. (C) Thin‐layer chromatography patterns of gangliosides extracted from control lines and NEU3‐transfectant cell lines as detected by resorcinol spray. M, ganglioside marker (bovine brain gangliosides). (D) Cell proliferation of NEU3 transfectants. Cell growth of two each of controls and transfectant lines was compared using MTT assay.
Cell proliferation was not affected with overexpression of the NEU3 gene. Cell proliferation of two control lines and two transfectant lines of NEU3 as analyzed by MTT assay showed no significant differences in multiple repeated experiments (Fig. 3D).
Overexpression of NEU3 in a SK‐MEL‐28 mutant line, N1, caused increased cell growth. SK‐MEL‐28‐N1 (N1) contained no GD3, but contained GM3 and GM2,( 31 ) and cell growth of N1 cells were markedly slower than SK‐MEL‐28.( 32 ) Expecting that N1 cells might be affected by overexpression of NEU3, the NEU3 expression vector was transfected into N1, which had equivalent levels of NEU3 mRNA and NEU3 sialidase activities with SK‐MEL‐28 (Fig. 4A,B). N1‐NEU3 transfectants showed 50–100 times higher mRNA levels than vector control cells (N1/vec) (Fig. 4C). Sialidase activities in the transfectants N1/NEU3 were 4–8 times higher than those in the control cells (Fig. 4D). Ganglioside expression of NEU3‐transfectant cells examined using TLC revealed no changes (Fig. 4E, left). The neutral fraction from the transfectants also showed no clear differences from the control cells (Fig. 4E, right). However, MTT assay using N1/NEU3‐transfectant lines and a control line revealed that overexpression of NEU3 resulted in significantly increased cell proliferation (Fig. 4F).
Figure 4.
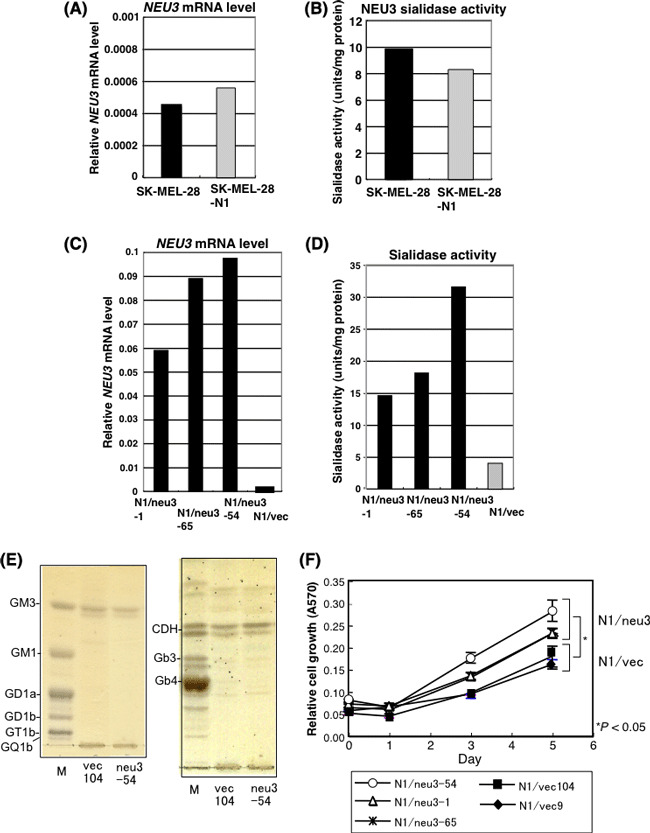
Introduction of NEU3 cDNA into N1 cells resulted in increased cell growth. (A) NEU3 mRNA levels in SK‐MEL‐28 and a mutant line, SK‐MEL‐28‐N1. (B) NEU3 sialidase activities in SK‐MEL‐28 and a mutant line, SK‐MEL‐28‐N1, measured using gangliosides as substrates. Both mRNA and enzyme activity of NEU3 were equivalent between the parent line and the mutant line. (C) NEU3 mRNA levels in three NEU3‐transfectant lines and a control. Relative mRNA levels as analyzed using q‐RT‐PCR are shown. (D) Sialidase activities in the same sets of cell lines. Sialidase activity was analyzed using GM3 as a substrate. NEU3 activities in the transfectants (N1/neu3‐1, ‐54, ‐65) and a control (N1/Vec) are shown. (E) Thin‐layer chromatography of extracted acidic fractions (left) and neutral fractions (right) from a vector control (vec104) and a NEU3 transfectant (neu3‐54). CDH, lactosylceramide. (F) Cell proliferation of the NEU3 transfectants was compared with that of the controls (N1/vec: 9, 104) using a MTT assay. Absorption of the transfectants were significantly higher than that of the controls at day 5 (*P < 0.05). Any transfectant showed significantly higher absorption than any control with P < 0.005. Similar results were repeatedly obtained in several experiments.
Gene silencing of NEU3 resulted in suppression of cell proliferation. Silencing effects of the human NEU3 gene in melanoma cells on cell phenotypes were analyzed. To knockdown the human NEU3 gene, a siRNA, neu3‐s3, was used. GL2 siRNA was used as a negative control. First, the knockdown effects of neu‐s3 were confirmed in HeLa cells, showing a 75% decrease (Fig. 5A). Cell growth of HeLa cells was significantly suppressed by an anti‐NEU3 siRNA in a previous report.( 28 ) Therefore, effects of transfection of neu3‐s3 into HeLa cells on cell proliferation was examined by BrdU uptake, showing significant reduction of cell growth (Fig. 5B).
Figure 5.
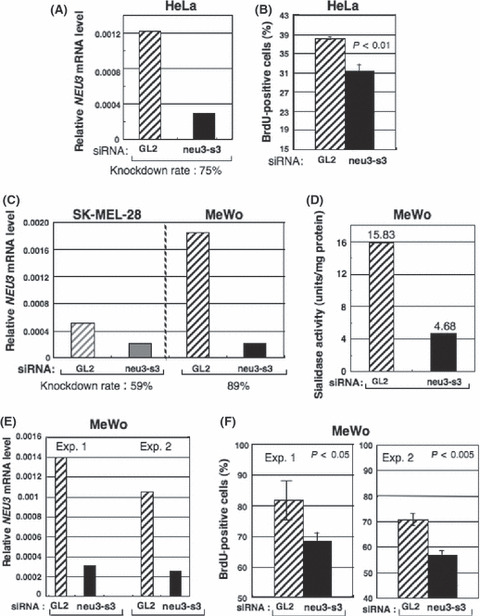
Silencing of the NEU3 gene in melanomas resulted in definite suppression of enzyme activities and cell growth. (A,B) A HeLa cell was used to confirm the silencing effects of neu3‐s3 siRNA, showing 75% reduction in relative mRNA levels (A), and significant reduction in BrdU uptake (B). (C) To knockdown human NEU3 gene, a siRNA, neu3‐s3 was used. The siRNA GL2 was used as a negative control. Experiments repeated at least three times showed similar results. (D) NEU3 sialidase activity (substrate: GM3) in the NEU3‐silenced cells was examined. (E,F) Suppression of cell proliferation with gene silencing of NEU3 in MeWo. Silencing effects of NEU3 mRNA in MeWo (E). Cell proliferation was assayed with BrdU uptake after transfection with neu3‐s3 siRNA, showing significant suppression in repeated experiments (F).
In two melanoma lines, SK‐MEL‐28 and MeWo, MeWo showed strong knockdown of NEU3 (approximately 90%) compared with SK‐MEL‐28 (60%) (Fig. 5C). Thus, MeWo was used in the following experiments. In this condition, sialidase activity in NEU3‐knockdown MeWo cells was measured with GM3 as a substrate, showing marked reduction of enzyme activity from 15.83 to 4.68 units/mg protein (to approximately 30%) (Fig. 5D).
Using MeWo cells, the silencing effects of the NEU3 gene were examined. Strong suppression of the expression levels of the NEU3 gene was confirmed (Fig. 5E). The cell proliferation examined by BrdU uptake showed significant reduction in repeated experiments (Fig. 5F).
Minimal changes in ganglioside expression were brought about in NEU3‐silenced MeWo cells. To examine the effects of NEU3 gene silencing on ganglioside expression in MeWo, flow cytometry was performed. GM3 expression levels slightly increased by NEU3 silencing (Fig. 6, middle). GD3 expression levels scarcely increased (Fig. 6, right). Correspondingly, LacCer expression showed no reduction by NEU3 gene silencing (Fig. 6, left).
Figure 6.
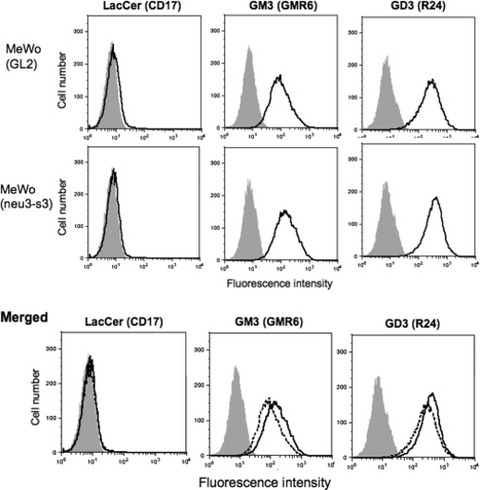
Minimal changes in the expression profiles of gangliosides in NEU3‐silenced MeWo cells. Flow cytometry was performed using monoclonal antibodies anti‐CD17 (LacCer, 1:100), anti‐GM3 (GMR6, 1:100) and anti‐GD3 (R24, 1:100), as described in the Materials and Methods. Results of siRNA (GL2)‐treated MeWo (top), neu3‐s3 siRNA‐treated MeWo (middle) and merged patterns of both (bottom) are shown. Dotted lines indicate siRNA (GL2)‐treated MeWo as the controls. GD3 expression showed marginal changes in neu3‐s3‐transfectant cells (right column), and GM3 expression in neu3‐s3‐transfectant cells minimally increased (middle column). Expression of LacCer, a precursor of GM3, showed no changes (left column).
Suppression of ERK phosphorylation with gene silencing of human NEU3 in MeWo. To examine the silencing effects of the NEU3 gene on ERK activation in MeWo, cells were transfected with neu3‐s3 siRNA or control siRNA (GL2). These cells were then stimulated with FCS after serum deprivation for 16 h, and the phosphorylation levels of ERK were observed (Fig. 7A). Relative intensities of the bands in Figure 7(A) ( 26 ) were plotted after correction. Gene silencing of NEU3 resulted in lower phosphorylation of ERK1/2 at 5 min after FCS treatment (Fig. 7B), and thereafter, suggesting that NEU3 is involved in increased cell proliferation and activation of ERK in MeWo.
Figure 7.
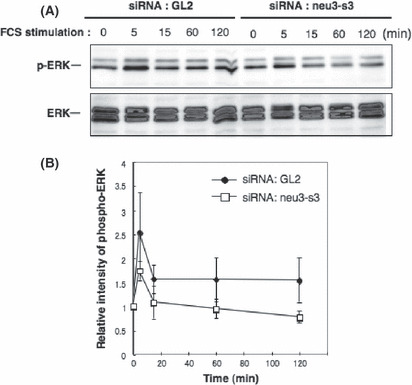
Suppression of ERK phosphorylation with NEU3 silencing in MeWo. (A) Effects of the knockdown of NEU3 on ERK activation in MeWo. Cells were transfected with neu3‐s3 siRNA or control siRNA (GL2). These cells were then stimulated with FCS after serum deprivation for 16 h and the phosphorylation levels of ERK were examined with immunoblotting. (B) Relative intensities of bands in (A) were plotted after correction with total ERK bands. Similar results were obtained in repeated experiments.
Increased phosphorylation of EGFR. To analyze the increased responses of NEU3‐expressing cells, tyrosine‐phosphorylation of EGFR in three transfectant N1 cells and a control line was examined using phosphorylation site‐specific antibodies. Bands of p‐Tyr 992 were more strongly detected in the transfectants than in the control (Fig. 8), while bands of two other sites (Tyr1045 and Tyr1068) were almost equivalent.
Figure 8.
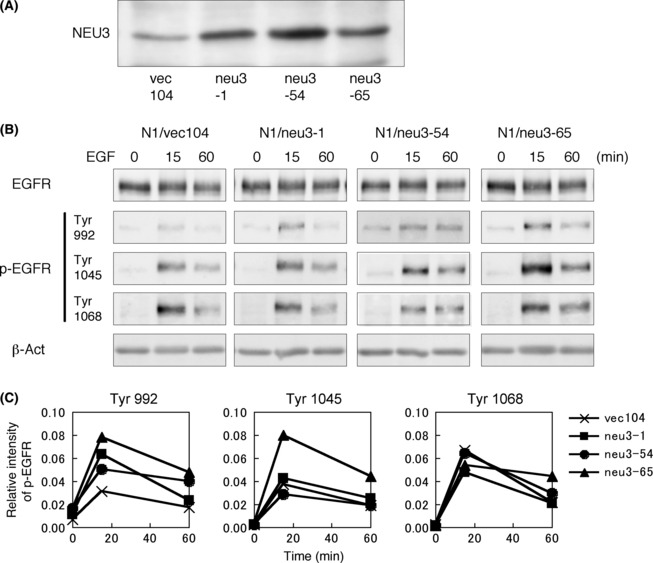
Epidermal growth factor (EGF)/epidermal growth factor receptor (EGFR)‐mediated signal in NEU3‐transfectant cells. (A) NEU3 protein levels in a control and three NEU3‐transfectant lines. (B) Phosphorylation levels of EGFR in a control and three NEU3‐transfectant lines. Cells were stimulated with EGF (10 ng/mL) (R&D Systems, Minneapolis, MN, USA) after serum deprivation for 16 h, and the phosphorylation levels of EGFR ware examined with immunoblotting. (C) Relative intensities of bands in (B) were plotted after correction with total EGFR bands. Similar results were obtained in repeated experiments.
Increased expression of Gb3 synthase mRNA and its product in NEU3‐transfectant cells. Changes in the expression of glycosyltransferase genes were analyzed with a q‐PCR array (Fig. 9A) (total data in Table S2). Several genes, except GM3 synthase and GD3 synthase, showed a small increase (Fig. 9B). Above all, Gb3 synthase (A4galt) was clearly upregulated in the transfectants. This was confirmed in RT‐PCR, real‐time RT‐PCR and TLC (Fig. 9C–E). We then examined effects of exogenous Gb3 on cell growth/survival using N1 cells. Addition of Gb3 resulted in a higher number of cells at 25–50 nmol/mL than untreated or LacCer‐treated cells (Fig. 9F).
Figure 9.
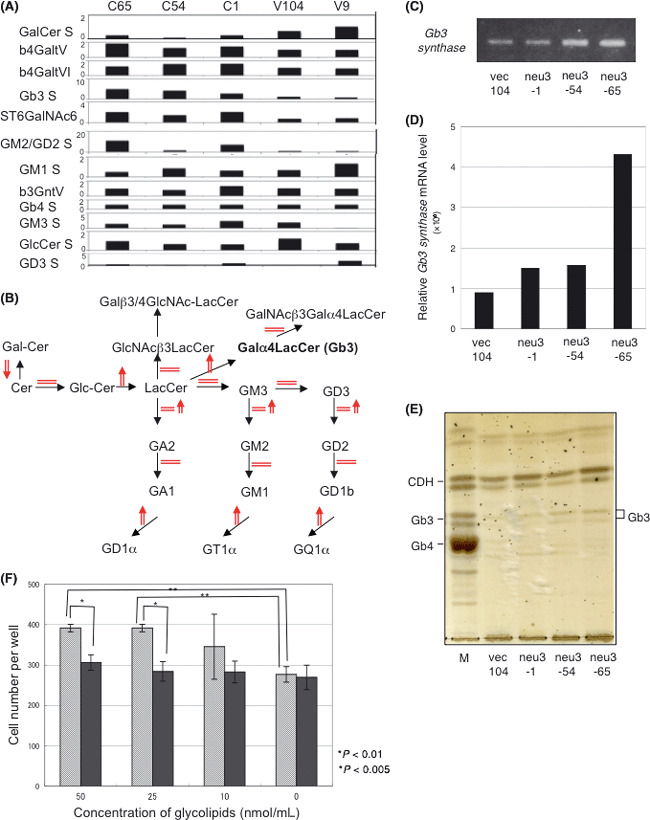
Glycolipid changes in NEU3 transfectants. (A,B) Summary of the quantitative PCR array with related genes to major glycolipids of cells examined is shown (A). Relative copy numbers are shown as the control (average) 1.0. Predicted changes in the expression levels of adjacent enzymes around LacCer and GM3. Upregulation is indicated by upper‐directed arrows. (C,D) Gb3 synthase mRNA levels in a control and NEU3‐transfectant lines. Relative mRNA levels as analyzed with RT‐PCR (C) and quantitative RT‐PCR (D) are shown. (E) Thin‐layer chromatography of extracted neutral fractions from a control and three NEU3‐transfectant lines. Orcinol was used for the detection of bands. Standards were from human erythrocytes. (F) Effects of exogenous Gb3 on cell growth/survival using N1 cells. After washing with plain medium, Gb3‐containing medium was added and incubated in CO2 incubator for 8 h. After further incubation in FCS‐containing medium for 12 h, the cell numbers per well were counted. LacCer was a control.
Neu3 expression confers resistance to apoptosis. To examine the role of NEU3 in apoptosis, we treated MeWo cells with H2O2 after NEU3 silencing. As expected, silenced cells showed higher rates of caspase‐3/7 activation, as indicated by the fluorescence (Fig. 10).
Figure 10.
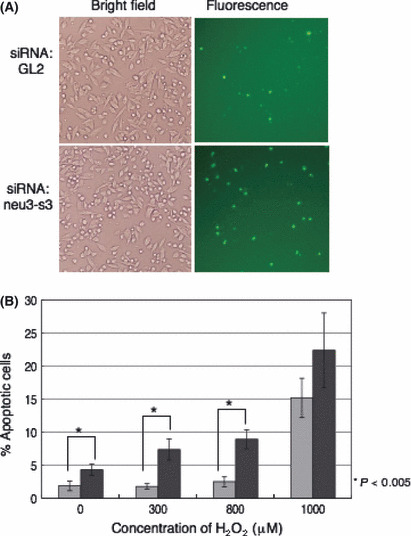
Silencing of NEU3 in melanomas resulted in increased apoptosis by H2O2. (A) To knockdown the human NEU3 gene, a MeWo cell was transfected with control siRNA (GL2) or anti‐siRNA NEU3 gene (neu3‐s3), as indicated in the Materials and Methods. The cells were treated with 800 μM of H2O2 to induce apoptosis after transfection of siRNA. The apoptotic cells were detected with CellEvent Caspase‐3/7 Green Detection Reagent and fluorescent bright green (right). (B) After transfection of siRNA, MeWo cells were plated in 96‐well plates and incubated with a different concentration of H2O2, then loaded with CellEvent Caspase‐3/7 Green Detection Reagent. The percentage of apoptotic cells was indicated by the number of cells labeled with this reagent in the total number of cells. Silencing of the NEU3 gene in MeWo resulted in an increase of apoptosis in repeated experiments. Bars indicate mean ± SD (n = 4). Gray bars, cells treated with control siRNA; black bars, cells treated with anti‐siRNA NEU3.
Discussion
Sialic acid‐containing glycosphingolipids, gangliosides, are abundantly expressed in the nervous tissues of mammals and birds.( 4 ) However, low levels of gangliosides are also expressed in almost all tissues and organs, and their compositions are strictly regulated in a spatio‐temporal manner.( 33 ) Some ganglioside species are also expressed in animal cancer cells, particularly in neuroectoderm‐derived tumors such as malignant melanomas and neuroblastomas.( 5 ) They have been considered to be cancer‐associated carbohydrate antigens, and also considered to be a promising target of immunotherapy or antibody therapy of these cancers.( 2 ) In particular, disialyl‐ganglioside GD3 has been considered as a melanoma‐specific antigen,( 5 ) and been used as a target of antibody therapy.( 34 )
Recent progress in the isolation and manipulation of glycosyltransferase cDNA enabled us to investigate the roles of these gangliosides in cancer phenotypes.( 35 ) Since we cloned cDNA of GD3 synthase,( 13 ) we have investigated roles of GD3 synthase in melanomas( 25 , 27 , 31 , 36 , 37 ) and in small‐cell lung carcinomas.( 38 , 39 ) Consequently, it has been demonstrated that the melanoma‐specific ganglioside GD3 plays crucial roles in increased proliferation, enhanced invasion and cell adhesion in melanoma cells.( 25 , 37 ) These findings indicate that molecular target therapy can be conducted toward ganglioside GD3/GD2 or signaling molecules involved in the enhanced malignant properties of melanoma cells under GD3 expression.( 40 )
NEU3 is a plasma membrane‐associated sialidase that was cloned as a ganglioside‐specific enzyme.( 17 ) It was cloned according to amino acid information obtained from a purified protein based on enzyme activity.( 17 ) Using the isolated cDNA of NEU3, a number of biological implications in human cancer cells have been demonstrated, that is, upregulation in colon cancers( 22 ) and renal cell cancer tissues( 23 ) in relatively aggressive tumor samples. Introduction of the NEU3 cDNA into relatively low‐grade cancer cell lines also resulted in increased malignant properties such as cell proliferation, invasion or cell motility.( 28 ) In these transfectant cells of NEU3, increased levels of phospho‐ERK1/2 and phospho‐Akt proteins were demonstrated.( 3 ) All of these results suggest that NEU3 expression enhances the signaling pathway involved in the malignant properties of the cancer cells examined.
There have been no reports on NEU3 expression in malignant melanomas that generally express high levels of gangliosides. Thus, this is the first study to investigate NEU3 expression and function in human melanoma cells. Although human melanoma cell lines generally exhibited high levels of gangliosides, many of them showed high expression levels of the NEU3 gene at almost equivalent levels with colon cancers.( 22 ) To examine the biological significance of NEU3 in melanoma cells, effects of overexpression of the NEU3 gene or gene silencing of NEU3 on cancer phenotypes were examined.
Consequently, NEU3 expression enhanced malignant properties of melanoma cells with minimal changes in the expression profiles of gangliosides. Similar results have been previously reported in colon( 22 ) and renal cell cancers.( 23 ) In melanomas, overexpression of NEU3 did not affect the phenotypes at all, despite highly elevated enzyme activity derived from transfected cDNA in one cell line (2, 3). When overexpression was induced in another melanoma cell line lacking GD3 expression, increased cell growth could be observed (Fig. 5). Thus, some melanoma lines showed resistance to neo‐expression of NEU3 both in cell features and in glycolipid patterns. This result might be due to high levels of NEU3 expression even before the transfection of NEU3 cDNA, or due to the very high amount of GD3 (the best substrate of NEU3) despite sufficiently high levels of induced NEU3 gene expression and enzyme activity. Thus, some melanoma cell lines seem to contain too much substrates to be affected by newly induced sialidase, although the precise mechanisms remain to be investigated.
To examine the possibility that those melanoma cells might maintain the expression profiles of glycolipids by adjusting expression levels of glycosyltransferase genes involved in the synthesis of relevant glycolipids, we performed comprehensive q‐RT‐PCR analyses of glycosyltransferase genes using a q‐PCR array. Although no significant changes in the expression levels of GM3 synthase or GD3 synthase were found, Gb3 synthase and some other enzyme genes working in the vicinity of the synthetic pathway showed an increase/decrease in their expression levels (Fig. 9). In particular, Gb3 could be newly found in the neutral fractions of the transfectants in TLC when higher amounts were applied. Neo‐expression of Gb3 has not been reported, suggesting differences in the nature of melanomas in terms of reaction patterns to altered glycolipid metabolism. Furthermore, the fact that the addition of Gb3 resulted in increased cell growth/survival suggests roles of neo‐expression of Gb3 in the NEU3 transfectants. This could be a mechanism for Neu3 action in cancer phenotypes.
Because HeLa cells were sensitive enough to silencing of the NEU3 gene to show definite changes in phenotypes,( 28 ) NEU3 silencing was tried using SK‐MEL‐28 and MeWo, which showed the highest sialidase activity toward gangliosides. As expected, both mRNA and NEU3 enzyme activity were clearly suppressed by anti‐NEU3 siRNA in MeWo, and cell growth was fairly reduced after transient gene silencing. Erk1/2 activation with serum stimulation was also reduced by gene silencing of NEU3. However, changes in glycolipids were found at very low and minimal levels. In particular, GD3 was defined as tumor‐promoting, cancer‐associated antigens enhancing both growth factor receptor‐mediated signals and adhesion‐mediated signals.( 25 , 37 ) The fact that MeWo showed reduced cell growth and growth signals without a definite reduction in GD3 expression might indicate that NEU3 modulates cell signaling at lipid rafts independently from its catalytic activity,( 3 ) or by affecting other glycolipids such as Gb3 as described above. Because we thought that NEU3 might modify crucial signals transduced through the cell membrane by modulating the membrane environment as a signaling molecule,( 3 ) we analyzed the implications of Neu3 in EGF/EGFR signaling and apoptosis as shown in 8, 10. These results suggest that binding of SH2 domains of PLCγ to Tyr 992‐EGFR and the slower internalization of EGFR( 41 ) might be involved in the enhanced cell growth. Also, the resistance of NEU3‐silenced cells to the induced apoptosis might indicate roles of Neu3 in the cancer phenotypes of melanoma cells, leading to better survival and resistance to therapy as reported in other cancer cells.( 22 , 23 , 28 )
To investigate roles of GD3, we genetically introduced GD3 synthase cDNA into N1 cells and analyzed the phenotypic changes and molecular mechanisms of GD3‐mediated signaling. Interestingly, the effects of gene silencing of these signaling molecules/receptors were more clearly observed in GD3‐expressing cells than in GD3‐negative cells.( 25 , 31 ) NEU3 silencing was also more effective in cancer cells than in normal‐like cells.( 3 ) Non‐cancerous human fibroblast WI‐38 and NHDF and keratinocyte NHEK cells, despite a significant reduction (64–92%) in NEU3 mRNA, in contrast showed no significant changes with established cancer cells.( 28 ) Taken together, it might be effective to silence both GD3 synthase and NEU3 simultaneously in melanoma cells.
Disclosure Statement
The authors have no conflict of interest.
Supporting information
Fig. S1. Expression of the Neu3 gene in melanoma cell lines as analyzed by RT‐PCR.
Table S1. Comparison of NEU3 expression and effects of the transfection of its cDNA.
Table S2. Results of the q‐PCR array.
Supporting info item
Supporting info item
Supporting info item
Acknowledgments
This study was supported by Grants‐in‐Aid for Basic Research Program CREST (Core Research for Evolutional Science and Technology) type from the Japan Science and Technology Agency, and partly by a Grant‐in‐Aid for Scientific Research on Priority Areas from the Ministry of Education, Culture, Sports, Science and Technology of Japan (MEXT). This study is also partly supported by a grant for COE Project for Private Universities from MEXT.
References
- 1. Hakomori S. Tumor malignancy defined by aberrant glycosylation and sphingo(glyco)lipid metabolism. Cancer Res 1996; 56: 5309–18. [PubMed] [Google Scholar]
- 2. Hakomori S, Igarashi Y. Gangliosides and glycosphingolipids as modulators of cell growth, adhesion, and transmembrane signaling. Adv Lipid Res 1993; 25: 147–62. [PubMed] [Google Scholar]
- 3. Miyagi T, Wada T, Yamaguchi K. Roles of plasma membrane‐associated sialidase NEU3 in human cancers. Biochim Biophys Acta 2008; 1780: 532–7. [DOI] [PubMed] [Google Scholar]
- 4. Wiegandt H. Gangliosides. In: Wiegandt H, ed. Glycolipids. New York: Elsevier, 1985; 199–260. [Google Scholar]
- 5. Furukawa K, Lloyd KO. Gangliosides in melanoma. In: Ferrone S, ed. Human Melanoma: From Basic Research to Clinical Application. Heidelberg: Springer, 1990; 15–30. [Google Scholar]
- 6. Cheung NK, Saarinen UM, Neely JE, Landmeier B, Donovan D, Coccia PF. Monoclonal antibodies to a glycolipid antigen on human neuroblastoma cells. Cancer Res 1985; 45: 2642–9. [PubMed] [Google Scholar]
- 7. Okada M, Furukawa K, Yamashiro S et al. High expression of ganglioside GD3 synthase gene in adult T cell leukemia cells unrelated to the gene expression of human T lymphotropic virus type I. Cancer Res 1996; 56: 2844–8. [PubMed] [Google Scholar]
- 8. Furukawa K, Akagi T, Nagata Y et al. GD2 ganglioside on human T‐lymphotropic virus type I‐infected T cells: possible activation of β‐1,4‐N‐acetylgalactosaminyltransferase gene by p40tax. Proc Natl Acad Sci USA 1993; 90: 1972–6. [DOI] [PMC free article] [PubMed] [Google Scholar]
- 9. Lloyd KO, Furukawa K. Biosynthesis and functions of gangliosides: recent advances. Glycoconj J 1998; 15: 627–36. [DOI] [PubMed] [Google Scholar]
- 10. Portoukalian J, Zwingelstein G, Doré JF. Lipid composition of human malignant melanoma tumors at various levels of malignant growth. Eur J Biochem 1979; 94: 19–23. [DOI] [PubMed] [Google Scholar]
- 11. Carubia JM, Yu RK, Macala LJ, Kirkwood JM, Varga JM. Gangliosides of normal and neoplastic human melanocytes. Biochem Biophys Res Commun 1984; 120: 500–4. [DOI] [PubMed] [Google Scholar]
- 12. Yamashiro S, Okada M, Haraguchi M et al. Expression of α2,8‐sialyl‐transferase (GD3 synthase) gene in human cancer cell lines: high level expression in melanomas and up‐regulation in activated T lymphocytes. Glycoconj J 1995; 12: 894–900. [DOI] [PubMed] [Google Scholar]
- 13. Haraguchi M, Yamashiro S, Yamamoto A et al. Isolation of GD3 synthase gene by expression cloning of GM3 α‐2,8‐sialyltransferase cDNA using anti‐GD2 monoclonal antibody. Proc Natl Acad Sci USA 1994; 91: 10455–9. [DOI] [PMC free article] [PubMed] [Google Scholar]
- 14. Yogeeswaran G, Hakomori S. Cell contact‐dependent ganglioside changes in mouse 3T3 fibroblasts and a suppressed sialidase activity on cell contact. Biochemistry 1975; 14: 2151–6. [DOI] [PubMed] [Google Scholar]
- 15. Schengrund CL, Lausch RN, Rosenberg A. Localization of sialidase in the plasma membrane of rat liver cells. J Biol Chem 1973; 248: 4424–8. [PubMed] [Google Scholar]
- 16. Miyagi T. Aberrant expression of sialidase and cancer progression. Proc Jpn Acad Ser B Phys Biol Sci 2008; 84: 407–18. [DOI] [PMC free article] [PubMed] [Google Scholar]
- 17. Miyagi T, Wada T, Iwamatsu A et al. Molecular cloning and characterization of plasma membrane‐associated sialidase specific for gangliosides. J Biol Chem 1999; 274: 5004–11. [DOI] [PubMed] [Google Scholar]
- 18. Monti E, Bassi MT, Papini N et al. Identification and expression of NEU 3, a novel human sialidase associated to the plasma membrane. Biochem J 2000; 349: 343–51. [DOI] [PMC free article] [PubMed] [Google Scholar]
- 19. Pshezhetsky AV, Richard C, Michaud L et al. Cloning, expression and chromosomal mapping of human lysosomal sialidase and characterization of mutations in sialidosis. Nat Genet 1997; 15: 316–20. [DOI] [PubMed] [Google Scholar]
- 20. Monti E, Preti A, Rossi E, Ballabio A, Borsani G. Cloning and characterization of NEU2, a human gene homologous to rodent soluble sialidases. Genomics 1999; 57: 137–43. [DOI] [PubMed] [Google Scholar]
- 21. Monti E, Bassi MT, Bresciani R et al. Molecular cloning and characterization of NEU4, the fourth member of the human sialidase gene family. Genomics 2004; 83: 445–53. [DOI] [PubMed] [Google Scholar]
- 22. Kakugawa Y, Wada T, Yamaguchi K et al. Up‐regulation of plasma membrane‐associated ganglioside sialidase (NEU3) in human colon cancer and its involvement in apoptosis suppression. Proc Natl Acad Sci USA 2002; 99: 10718–23. [DOI] [PMC free article] [PubMed] [Google Scholar]
- 23. Ueno S, Saito S, Wada T et al. Plasma membrane‐associated sialidase is up‐regulated in renal cell carcinoma and promotes interleukin‐6‐induced apoptosis suppression and cell motility. J Biol Chem 2006; 281: 7756–64. [DOI] [PubMed] [Google Scholar]
- 24. Okada M, Itoh Mi M, Haraguchi M et al. b‐series Ganglioside deficiency exhibits no definite changes in the neurogenesis and the sensitivity to Fas‐mediated apoptosis but impairs regeneration of the lesioned hypoglossal nerve. J Biol Chem 2002; 277: 1633–6. [DOI] [PubMed] [Google Scholar]
- 25. Hamamura K, Furukawa K, Hayashi T et al. Ganglioside GD3 promotes cell growth and invasion through p130Cas and paxillin in malignant melanoma cells. Proc Natl Acad Sci USA 2005; 102: 11041–6. [DOI] [PMC free article] [PubMed] [Google Scholar]
- 26. Furukawa K, Clausen H, Hakomori S et al. Analysis of the specificity of five murine anti‐blood group A monoclonal antibodies, including one that identifies type 3 and type 4 determinants. Biochemistry 1985; 24: 7820–6. [DOI] [PubMed] [Google Scholar]
- 27. Nakashima H, Hamamura K, Mitsudo K et al. Overexpression of caveolin‐1 in a human melanoma cell line resulted in the dispersion of ganglioside GD3 from lipid rafts and the alteration of leading edge formation, leading to the attenuation of malignant properties. Cancer Sci 2007; 98: 512–20. [DOI] [PMC free article] [PubMed] [Google Scholar]
- 28. Wada T, Hata K, Yamaguchi K et al. A crucial role of plasma membrane‐associated sialidase in the survival of human cancer cells. Oncogene 2007; 26: 2483–90. [DOI] [PubMed] [Google Scholar]
- 29. Li K. Determination of sialic acids in human serum by reversed‐phase liquid chromatography with fluorimatric detection. J Chromatogr 1992; 579: 209–13. [DOI] [PubMed] [Google Scholar]
- 30. Ito H, Kuno A, Sawaki H et al. Strategy for glycoproteomics: identification of glyco‐alteration using multiple glycan profiling tools. J Proteome Res 2009; 8: 1358–67. [DOI] [PubMed] [Google Scholar]
- 31. Hamamura K, Tsuji M, Nakashima H et al. Focal adhesion kinase as well as p130Cas and paxillin is crucially involved in the enhanced malignant properties under expression of ganglioside GD3 in melanoma cells. Biochim Biophys Acta 2008; 1780: 513–9. [DOI] [PubMed] [Google Scholar]
- 32. Nakano J, Raj BK, Asagami C, Lloyd KO. Human melanoma cell lines deficient in GD3 ganglioside expression exhibit altered growth and tumorigenic characteristics. J Invest Dermatol 1996; 107: 543–8. [DOI] [PubMed] [Google Scholar]
- 33. Yu RK, Macala LJ, Taki T, Weinfield HM, Yu FS. Developmental changes in ganglioside composition and synthesis in embryonic rat brain. J Neurochem 1988; 50: 1825–9. [DOI] [PubMed] [Google Scholar]
- 34. Houghton AN, Mintzer D, Cordon‐Cardo C et al. Mouse monoclonal IgG3 antibody detecting GD3 ganglioside: a phase I trial in patients with malignant melanoma. Proc Natl Acad Sci USA 1985; 82: 1242–6. [DOI] [PMC free article] [PubMed] [Google Scholar]
- 35. Furukawa K, Tsuchida A, Okajima T, Furukawa K. Glycoconjugate glycosyltransferases. Glycoconj J 2009; 26: 987–98. [DOI] [PubMed] [Google Scholar]
- 36. Ohkawa Y, Miyazaki S, Miyata M, Hamamura K, Furukawa K, Furukawa K. Essential roles of integrin‐mediated signaling for the enhancement of malignant properties of melanomas based on the expression of GD3. Biochem Biophys Res Commun 2008; 373: 14–9. [DOI] [PubMed] [Google Scholar]
- 37. Ohkawa Y, Miyazaki S, Hamamura H et al. Ganglioside GD3 enhances adhesion signals and augments malignant properties of melanoma cells by recruiting integrins to glycolipid‐enriched microdomains. J Biol Chem 2010; 285: 27213–23. [DOI] [PMC free article] [PubMed] [Google Scholar]
- 38. Yoshida S, Fukumoto S, Kawaguchi H, Sato S, Ueda D, Furukawa K. Ganglioside GD2 in small cell lung cancer cell lines: enhancement of cell proliferation and mediation of apoptosis. Cancer Res 2001; 61: 4244–52. [PubMed] [Google Scholar]
- 39. Aixinjueluo W, Furukawa K, Zhang Q et al. Mechanisms for the apoptosis of small cell lung cancer cells induced by anti‐GD2 monoclonal antibodies: roles of anoikis. J Biol Chem 2005; 280: 29828–36. [DOI] [PubMed] [Google Scholar]
- 40. Furukawa K, Hamamura K, Nakashima H, Furukawa K. Molecules in the signaling pathway activated by gangliosides can be targets of therapeutics for malignant melanomas. Proteomics 2008; 8: 3312–6. [DOI] [PubMed] [Google Scholar]
- 41. Emlet DR, Moscatello DK, Ludlow LB, Wong AJ. Subsets of epidermal growth factor receptors during activation and endocytosis. J Biol Chem 1997; 272: 4079–86. [DOI] [PubMed] [Google Scholar]
Associated Data
This section collects any data citations, data availability statements, or supplementary materials included in this article.
Supplementary Materials
Fig. S1. Expression of the Neu3 gene in melanoma cell lines as analyzed by RT‐PCR.
Table S1. Comparison of NEU3 expression and effects of the transfection of its cDNA.
Table S2. Results of the q‐PCR array.
Supporting info item
Supporting info item
Supporting info item


