

Abstract
The popularity of imaging mass spectrometry (IMS) of tissue samples, which enables the direct scanning of tissue sections within a short time‐period, has been considerably increasing in cancer proteomics. Most pathological specimens stored in medical institutes are formalin‐fixed; thus, they had been regarded to be unsuitable for proteomic analyses, including IMS, until recently. Here, we report an easy‐to‐use screening method that enables the analysis of multiple samples in one experiment without extractions and purifications of proteins. We scanned, with an IMS technique, a tissue microarray (TMA) of formalin‐fixed paraffin‐embedded (FFPE) specimens. We detected a large amount of signals from trypsin‐treated FFPE‐TMA samples of gastric carcinoma tissues of different histological types. Of the signals detected, 54 were classified as signals specific to cancer with statistically significant differences between adenocarcinomas and normal tissues. We detected a total of 14 of the 54 signals as histological type‐specific with the support of statistical analyses. Tandem MS revealed that a signal specific to poorly differentiated cancer tissue corresponded to histone H4. Finally, we verified the IMS‐based finding by immunohistochemical analysis of more than 300 specimens spotted on TMAs; the immunoreactivity of histone H4 was remarkably strong in poorly differentiated cancer tissues. Thus, the application of IMS to FFPE‐TMA can enable high‐throughput analysis in cancer proteomics to aid in the understanding of molecular mechanisms underlying carcinogenesis, invasiveness, metastasis, and prognosis. Further, results obtained from the IMS of FFPE‐TMA can be readily confirmed by commonly used immunohistochemical analyses. (Cancer Sci 2009)
Intensive genome‐based surveys are performed on candidate biomarker transcripts relevant to cancer tissues by utilizing the advances in high‐throughput microarrays.( 1 , 2 ) Further, various single‐nucleotide polymorphism (SNP) analyses have been performed to further understand cancer.( 3 , 4 ) Recently, cancer genome resequencing has been increasingly performed to acquire specific genomic data.( 5 , 6 ) To achieve the systematic understandings of cancer by systems biology, data from genome resequencing and the corresponding data from the transcriptomes should be combined with the individual metabolome and proteome data of the cancer patient.( 7 )
Several approaches for the investigation of global alterations in proteomics have emerged. Mass spectrometry (MS) is used in combination with 2D electrophoresis or liquid chromatography.( 8 , 9 ) Further, protein microarrays offer a means of effective identification of cancer‐specific protein alterations to researchers.( 10 )
Despite the existence of techniques for the global detection of cancer‐specific alterations at the protein level, proteomic approaches continue to possess two major disadvantages. Under most circumstances, proteomic approaches only allow a limited number of samples to be analyzed in an experiment. Additionally, proteomic techniques are not adopted for the investigation of large amounts of archival specimens that are stored in hospitals and medical institutes. TMAs have been developed for the analysis of a large number of specimens by antibody labeling.( 11 ) It allows high‐throughput profiling of the molecular and pathological alterations in tissue specimens.
In recent years, IMS has emerged and developed dramatically in the field of proteomics and metabolomics.( 12 , 13 ) IMS enables simultaneous analysis of thousands of proteins directly from a tissue sample without protein extraction and usage of target‐specific reagents such as antibodies.( 14 , 15 )
In this study, we combine the TMA and IMS technique, and introduce a simple and easy‐to‐use protocol to detect, by a single experimental trial, cancer‐specific or histological type‐specific proteins. Further, we optimized the IMS procedure for the FFPE samples that are commonly used in hospitals and stored for long time.
Materials and Methods
Specimens. We chose gastric cancer to perform the study for the evaluation of our experimental paradigm. Gastric cancer is the fourth most frequent cancer and the second leading cause of cancer‐related death in the world.( 16 ) In Japanese hospitals, large amounts of gastric cancer specimens are stored and are, thus, readily available to perform studies.
Human gastric cancer tissues and adjacent normal tissues were provided by the Diagnostic Pathology Division, Hospital of Hamamatsu University School of Medicine, Shizuoka, Japan. The study was performed in accordance with the guidelines for pathological specimen handling, which was approved by the ethical committee of the Hamamatsu University School of Medicine. Histological classification was based on Japanese Classification of Gastric Carcinoma, 2nd English edition.( 17 ) Further, each tissue did not contain non‐tumor tissue, confirmed by two pathologists.
For IMS, we used the old specimens which had been fixed in 10% neutral formalin promptly after surgery and had been stored for up to 2 years in paraffin. Tissue blocks of three cancer tissues and one adjacent normal tissue were cored using tissue microarrayer type KIN (Azumaya, Tokyo, Japan). A cylinder, 3 mm in diameter, was taken and placed into the recipient block. Three cancer tissues and one non‐tumor gastric mucosal tissue were aligned as shown in Fig. 1a.
Figure 1.
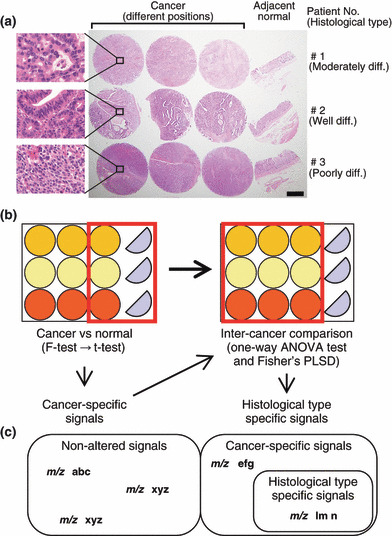
Experimental paradigm design. (a) Formalin‐fixed paraffin‐embedded (FFPE) samples were cored with a 3‐mm diameter needle and arranged in a line with three cancer tissues and one adjacent normal tissue. The histological type of the cancer of Patient 1 was moderately differentiated adenocarcinoma, that of Patient 2 was well‐differentiated adenocarcinoma, and that of Patient 3 was poorly differentiated adenocarcinoma. Hematoxylin–eosin stain, ×10. Scale bar, 1 mm. Enclosed area corresponded to magnified microscopic image. Hematoxylin–eosin stain, ×400 (b) The schema of FFPE samples and the workflow of statistical analysis are shown. (c) The schema that categorizes the acquired signals is presented.
Sample preparation. For analysis, the FFPE tissue microarray blocks were sliced into 10‐μm‐thick serial sections; further, for hematoxylin–eosin staining, these blocks were sliced into 1‐μm‐thick sections, using a microtome (Tissue‐Tek, Feather Trustome; Sakura Finetek, Tokyo, Japan). The analysis samples were deposited onto indium‐tin‐oxide (ITO)‐coated glass slides (Bruker Daltonics, Bremen, Germany), and the staining samples were loaded onto regular glass microscope slides by scooping the sections in a 50°C water bath, and then dried on an extender at 45°C. Paraffin was removed by 10‐min immersion in xylene at 60°C. Subsequently, the slides were washed by stepwise immersions of 5‐min duration each; this involved slide immersion in 100% ethanol twice, and once each in 90% ethanol, 80% ethanol, and 70% ethanol. After rehydration, these slides were incubated in a humid chamber at 55°C overnight.
Tryptic digestion. The sample slide was inserted into a slot on matrix‐assisted laser desorption/ionization (MALDI) target plates affixed with conductive tape, and inserted into a chemical inkjet printer (CHIP‐1000; Shimadzu, Kyoto, Japan). Trypsin solution was prepared by dissolving 20 μg of trypsin (Sigma, St. Louis, MO, USA) in 200 μL of 20‐mM ammonium hydrogen carbonate (NH4HCO3). Trypsin microspotting was performed with CHIP‐1000 in 5‐nL droplets by five cycles of 1000 pl on each spot at a spatial interval of 250 μm. After spotting, MALDI target plates were incubated overnight at 37°C under high‐humidity conditions.
Matrix deposition. The matrix solution was prepared by dissolving 50 mg of 2, 5‐dihydroxybenzooic acid (DHB; Bruker Daltonics) in 1 mL of 70% methanol/0.1% trifluoroacetic acid. DHB is a widely used matrix for lower molecules including peptides.( 18 ) A thin matrix layer was applied to the surface of the plates using a 0.2‐mm nozzle caliber airbrush (Procon Boy FWA Platinum; Mr. Hobby, Tokyo, Japan). The spraying distance was maintained at 15 cm from the tissue surface. The total amount of the matrix solution on each slide was 2–3 mL. The spraying technique enabled full matrix coverage over the entire tissue surface and facilitated co‐crystallization of matrix and bio‐molecules. A desalting process such as ethanol wash was not performed, since the process does not significantly improve DHB‐assisted imaging mass spectrometry (IMS) and NH4HCO3 is a highly volatile buffer.( 18 , 19 )
Direct analysis of tissue sections by MALDI mass spectrometry. Mass spectra were acquired using the QSTAR XL (Applied Biosystems, Foster City, CA, USA), a hybrid quadrupole/time‐of‐flight mass spectrometer equipped with an orthogonal MALDI source and a pulsed YAG laser that was operated at a repetition rate of 100 Hz, and a power modulator. Spectra were acquired in positive ion mode. Spectra were acquired in the range of m/z 500–2000. Representative mass spectra were acquired using random laser irradiation‐sections. The number of laser shots was 150. An alignment of the mass spectra was performed to compare the datasets using SpecAlign software (http://physchem.ox.ac.uk/~jwong/specalign/). The peak intensity value of the spectra was normalized by dividing them with the total ion current (TIC) as previously described.( 20 , 21 )
Imaging of tissue section by mass spectrometry. IMS was performed using orthogonal MALDI (oMALDI) server software by defining a region of interest around the tissue slice. The mechanical resolution, which is the value that refers to the length of the stepwise movement of the laser beam on the sample stage, was 300 μm × 300 μm, and the accumulation time per spot was about 2 s. The acquired mass spectra were visualized using BioMap software (http://www.maldi‐msi.org). Molecular images were captured using this software by applying baseline correction to the spectra and integrating these spectra over the peak of interest. Alignment of these mass spectra was performed using SpecAlign software.
Tissue protein identification. The quadrupole ion trap time‐of‐flight mass spectrometer, namely, AXIMA‐QIT (Shimadzu), was used to perform MS/MS analysis. In the MS/MS operation, the data acquisition conditions (i.e. the laser power, collision energy, and the number of laser irradiations) were adjusted to obtain good‐quality mass spectra with high intensity and signal‐to‐noise ratios (S/N) in the fragmented peaks. MS/MS spectra were processed using the Mascot search engine (http://www.matrixscience.com) using the National Center for Biotechnology Information (NCBI)/basic local alignment search tool (BLAST) protein database (http://blast.ncbi.nlm.nih.gov/Blast.cgi) with a taxonomy filter for humans, and the peptide and MS/MS tolerance at 0.3 Da. The search criteria was allowed to consider up to one missed cleavage and variable modifications including protein N‐terminus acetylation, histidine/tryptophan oxidation, and methionine oxidation.
Statistical analysis. All statistical analyses were performed with StatView software version 5.0 (SAS Institute, Cary, NC, USA). First, statistical analyses were performed on adjoining cancer and normal tissue. The Student’s t‐test (α = 0.05) was performed between peak intensity means of cancer and normal tissue samples on the basis of equal variance. Welch’s test for unequal variance (α = 0.05) was performed between peak intensity means of cancer and normal tissues. The corresponding P‐value, i.e. P (T t), was reported as a measure of significant statistical variability between conditions.
We extracted signals that showed significantly higher intensity in cancer than in normal tissue in the form of cancer‐specific peaks. To determine specific peaks related to the degree of differentiation, analysis of variance (ANOVA) and Fisher’s protected least significant difference (PLSD) were performed as post‐hoc tests on three histological types of three different cancer tissue samples. Fig. 1b shows the statistical workflow.
Immunohistochemical staining for histone H4. For immunohistochemistry (IHC), we used the formalin‐fixed tissue microarray specimens containing a wide range of preservation time, up to 30 years after being embedded in paraffin. Each TMA was composed of 50 primary gastric tumors such as adenocarcinoma of various grades of differentiation. Three micrometer sections were cut from the TMA blocks. Immunostaining was performed by the Dako Autostainer System (Dako Japan, Tokyo, Japan) according to the manufacturer‐recommended procedure. In brief, paraffin was removed by immersing the TMA slides in xylene for 5 min twice. Subsequently, the tissue sections were rehydrated by immersing the slides in 100% ethanol for 10 min twice, followed by two‐time 10‐min immersion in 95% ethanol. After rehydration, these slides were incubated at 96°C for 40 min in 10 mM sodium citrate buffer pH 6.0 and then cooled on the bench top for 20 min. Then, these sections were incubated in 3% hydrogen peroxide for 5 min and washed in Tris‐buffered saline. A monoclonal antibody against histone H4 (L64C1; Cell Signaling Technology, Danvers, MA, USA) was used as the primary antibody at a dilution of 1:300. N‐Histofine® Simple Stain MAX‐PO (Multi) (Nichirei Biosciences, Tokyo, Japan) was used as the secondary antibody. After removing the secondary antibody, the sections were exposed to diaminobenzidine for 5 min, and then washed with distilled water. Counterstaining was performed with hematoxylin for 10 s.
IHC evaluation. The IHC evaluation was carried out in two independent ways by two of the authors (Y.M. and H.S.). An evaluation was performed by visual inspection, where IHC staining was classified into four ranks (0, negative; 1, slightly positive; 2, positive; 3, strongly positive) for common types of gastric carcinoma. Papillary adenocarcinoma was interpreted as well‐differentiated adenocarcinoma and signet‐ring cell carcinoma as poorly differentiated adenocarcinoma. Assignment of mucinous carcinoma category was made according to the other predominant elements. Special types of gastric carcinoma and other tumors were excluded. In total, 169 specimens were evaluated; they included 42 well‐differentiated, 38 moderately differentiated, and 89 poorly differentiated adenocarcinomas. As described,( 22 ) Steel–Dwass’ test was performed by using free software available on a web site, MEPHAS (http://www.gen‐info.osaka‐u.ac.jp/testdocs/tomocom/). Another evaluation was carried out by quantifying the signal intensity of IHC staining with Scion image software version 4.0.3.2 (Scion, Frederick, MD, USA). We analyzed additional 170 specimens containing 43 well‐differentiated, 40 moderately differentiated, and 87 poorly differentiated adenocarcinomas. The data were represented as the mean value of intensity ± SD. anova and Fisher’s PSLD were performed as post‐hoc test among three histological types (well, moderately, and poorly differentiated).
Results
Experimental paradigm design. To statistically detect cancer‐specific signals, we placed three cancer tissues and one normal tissue from three patients in a TMA. The histological type of cancer differed among the three patients (Fig. 1a). The sample from Patient 1 was moderately differentiated adenocarcinoma, that from Patient 2 was well‐differentiated adenocarcinoma, and that from Patient 3 was poorly differentiated adenocarcinoma. We acquired tissue samples from three different regions of each patient for further statistical analysis to detect signals specific to cancer‐differentiation status (Fig. 1a). During the first screening, we compared signals of three individual cancers with those of normal tissues (Fig. 1b). Thereafter, we screened the detected cancer‐specific peaks by multiple comparisons of three different cancer regions belonging to three histological types (Fig. 1b). We categorize the obtained results on the basis of the statistical workflow in Fig. 1c.
Acquisition of mass spectra from FFPE‐TMA samples. A previous report showed relatively weak signal intensities and low S/N ratio was obtained with FFPE tissue samples compared to freshly frozen ones.( 23 ) We first examined if peptide signals could be sufficiently detected with FFPE‐TMA. We employed chemical inkjet technology to equalize the quantity and the interval of trypsin solution application.( 14 ) We detected vast quantities of signals that were sufficient to generate imaging data from FFPE‐TMA samples. Figure 2 shows representative spectra obtained from three individual cancer tissues and normal tissues. The peaks obtained were mainly concentrated below m/z 2000 and could hardly be detected over m/z 2000. Thus, using SpecAlign, we performed signal‐intensity normalization.
Figure 2.
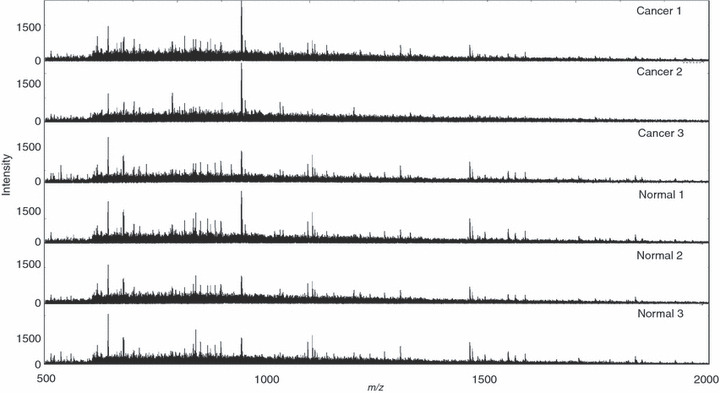
Acquired mass spectra from formalin‐fixed paraffin‐embedded (FFPE) tissue microarray samples (TMA) by random laser irradiation. Acquired mass spectra from each TMA spot of adjoining cancer and normal tissue are shown as representative spectra. m/z refers to mass per charge ratio.
Detection of cancer specifically increased signals in IMS of digested FFPE tissue microarray. Subsequently, we performed IMS of FFPE‐TMA on the samples and obtained mass spectra. We setup a spatial interval of 300 μm to prevent repeated laser irradiation, as the irradiated laser diameter was 200 μm. We completed the scanning of the TMA samples with 12 spots in approximately 1 h. We detected a total of 72 signals with FFPE‐TMA samples. Fig. S1 shows the obtained array images. To perform statistical data analysis, we quantified the signal intensities of m/z peaks. The first statistical screening (Fig. 1b) revealed 54 signals, the intensity of which was detected to be significantly increased in cancer tissues (Fig. 3). We examined the reliability of this screening by performing two independent trials with sibling arrays. Forty of the 54 signals were detected in the two independent trials (Fig. 3). Figure 4(a) shows the representative array result of the signal significantly increased in cancer. In contrast, Fig. 4b shows that another signal has no significant difference between cancer and normal tissues, i.e. it shows an even distribution pattern.
Figure 3.
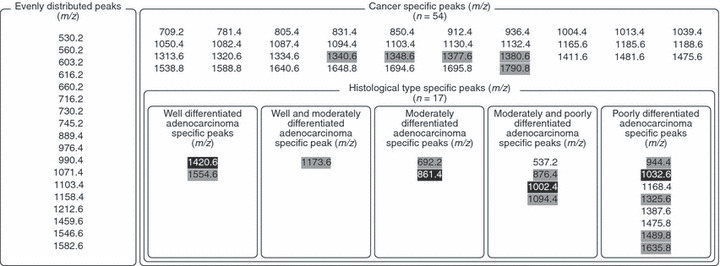
The peak list acquired from mass spectra. The shaded values represent signals that showed significantly increased intensity in cancer tissues in one independent trial (P < 0.05). The white‐on‐black values represent signals that showed significant difference among three cancers in one independent trial (P < 0.05).
Figure 4.
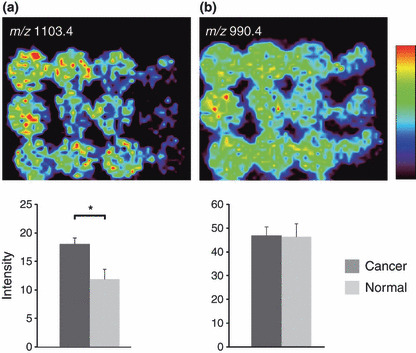
Cancer‐specific signal increase and even distribution of signals in imaging mass spectrometry (IMS) of digested formalin‐fixed paraffin‐embedded (FFPE) tissue microarrays (TMA). (a) Significantly strong peak intensity was detected at m/z 1103.4. (b) No significant difference was observed between cancer and normal tissues at an m/z of 990.4. Values are represented as mean ± SD (n = 3). *P < 0.05.
Detection of histological type‐specific increased signals in IMS of digested FFPE tissue microarray. We further analyzed the quantified signal intensities to examine whether such histological type‐specific signals could be detected with our experimental paradigm. To this end, we compared signals detected in cancer tissues among the well‐differentiated, moderately differentiated, and poorly differentiated tissues (Fig. 1b). To detect specific signals, we conducted statistical analyses with one‐way anova followed by Fisher’s PLSD. Certain signals demonstrating a cancer‐specific pattern appeared to demonstrate uneven signal intensities in different degrees of cancer differentiation (Fig. 3, Fig. 5a–c). Of the detected signals, peaks having m/z 537.2, 1168.4, 1387.6, 1475.8 were reproducibly detected in another experimental trial. Other signals were detected only once in two experimental trials. Owing to the two‐step screening, it is probable that the detection of histological type‐specific signals shows worse reproducibility than the simple detection of cancer‐specific signals.
Figure 5.
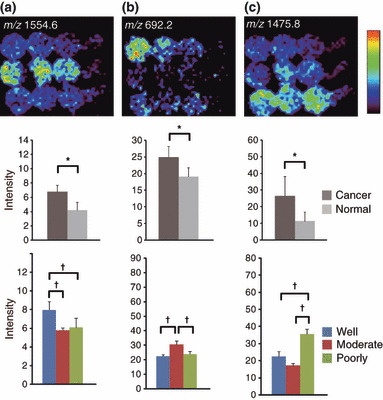
Histological type‐specific signal increase in imaging mass spectrometry (IMS) of digested formalin‐fixed paraffin‐embedded (FFPE) tissue microarrays (TMA). (a) Ion imaging revealed a peak with significantly strong signal intensity in well‐differentiated adenocarcinoma at an m/z of 1554.6. (b) Ion imaging revealed a peak with significantly strong signal intensity in moderately differentiated adenocarcinoma at an m/z of 692.2. (c) Ion imaging revealed a peak with significantly strong signal intensity in poorly differentiated adenocarcinoma at m/z 1475.8. Values are represented as mean ± SD (n = 3). *P < 0.05, †P < 0.05.
Identification of protein‐specific increase in poorly differentiated cancer tissues by MS/MS analysis. We attempted to identify the signals that were specifically detected in poorly differentiated cancer tissue. We performed MS/MS analyses on the FFPE‐TMA, and analyzed the resultant data with the Mascot search engine. We identified one signal with an m/z 1325.6 as histone H4 that is specific to poorly differentiated cancers (Fig. 6a), and identified a protein that demonstrated non‐specific expression and had an m/z 976.4 corresponding to that of actin (Fig. 6b). Other peaks could not be detected due to their weak intensity.
Figure 6.
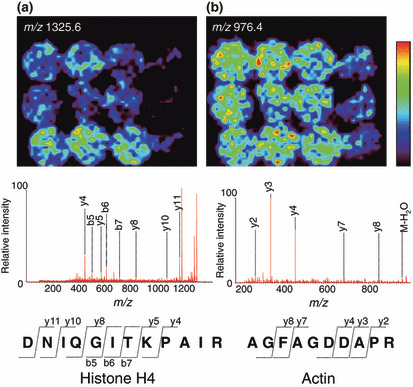
MS/MS analysis of digested peptide and protein identification. (a) The biomolecule of an m/z 1325.6 was identified as histone H4. DNIQGITKPAIR: abbreviation of the amino‐acid sequence aspartic acid–asparagine–isoleucine–glutamine–glycine–isoleucine–threonine–lysine–proline–alanine–isoleucine–arginine. y4, y5, y8, y10, y11 represent each fragment ion, which includes the C‐terminal domain. b5, b6, b7 represent each fragment ion, which includes the N‐terminal domain. (b) The biomolecule with an m/z 976.4 was identified as actin. AGFAGDDAPR: abbreviation for the amino‐acid sequence alanine–glycine–phenylalanine–alanine–glycine–aspartic acid–aspartic acid–alanine–proline–arginine. y2, y3, y4, y7, y8 refer to each fragment ion, which includes the C‐terminal domain.
IHC staining for histone H4 using another TMA specimen of larger numbers of the cases. Finally, we examined whether histone H4 was specifically strongly detected in poorly differentiated cancers. In total, we stained 400 gastric tumors including adenocarcinoma, squamous carcinoma, neuroendocrine carcinoma, metastatic carcinoma, malignant lymphoma, and adenoma. We excluded 61 specimens such as a special type of gastric carcinoma, malignant lymphoma, and benign lesion. We examined 339 gastric carcinomas composed of 85 well‐differentiated carcinomas, 78 moderately differentiated carcinomas, and 176 poorly differentiated carcinomas. Figure 7(a) shows representative photomicrographs of each histological type. We evaluated the result of IHC in two approaches. First, we determined the staining appearance according to four ranks (0, negative; 1, slightly positive; 2, positive; 3, strongly positive). Slightly positive and positive staining reached a high rate in well‐ and moderately differentiated carcinoma. In contrast, poorly differentiated adenocarcinomas were categorized into much more positive staining such as rank 2 or rank 3 (Fig. 7b). Second, we also performed more quantitative analysis. We quantified the signal intensity using Scion image software. In agreement with our visual inspection, poorly differentiated carcinoma showed significantly higher value compared to well‐differentiated or moderately differentiated carcinomas. There was no significant difference between well‐ and moderately differentiated carcinoma (Fig. 7c).
Figure 7.
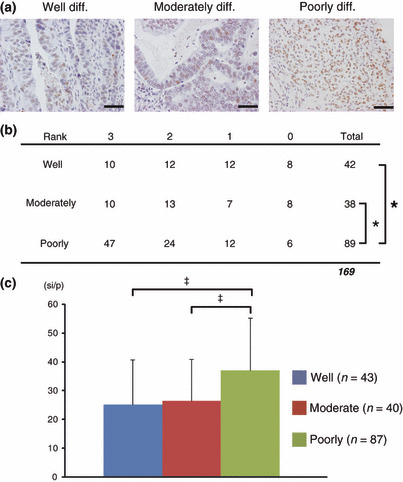
Immunohistochemical (IHC) staining for histone H4. (a) Representative photomicrograph of IHC for histone H4 protein, ×400. Scale bar, 50 μm. (b) Evaluation of IHC according to four ranks (0, negative; 1, slightly positive; 2, positive; 3, strongly positive). The 169 gastric carcinomas comprised 42 well‐differentiated carcinomas, 38 moderately differentiated carcinomas, 89 poorly differentiated carcinomas. *P < 0.05 by Steel–Dwass’ test. (c) Quantitative analysis of IHC signal intensity. The 170 gastric carcinomas comprised 43 well‐differentiated carcinomas, 40 moderately differentiated carcinomas, and 87 poorly differentiated carcinomas. Values are represented as mean ± SD. si/p, signal intensity per pixel. ‡P < 0.01.
Discussion
In this report, we presented a simple and easy‐to‐use method for the detection and identification of cancer‐specific proteins, i.e. strong candidates for biomarkers or drug targets, with high reliability in an experimental trial (Fig. 1). We succeeded in detecting cancer‐specific signals with 75% (40 per 54) reliability in two independent experiments (Fig. 3, Fig. 4). Furthermore, we detected signals that were specific for each status of cancer differentiation (Fig. 5). Finally, we successfully identified one of the signals that was specifically increased in the poorly differentiated cancer tissue as histone H4 (Fig. 6).
We analyzed 12 different tissue samples within 1 h. The TMA‐IMS technique has prominent advantages when compared to existing proteomic techniques. This technique enables the analysis of multiple proteins in multiple tissue samples in just one experiment. The existing proteomic techniques lack either multiprocessing property with respect to the analysis of samples or detection of proteins. Proteomic techniques employing 2D electrophoresis‐MS or protein microarrays can analyze only single or double samples in one experiment; however, they can detect and identify multiple proteins in one experiment. In contrast, the limitation of TMA is that it enables that analysis of only one or two proteins in one experiment; however, it enables simultaneous analysis of multiple tissue samples. Thus, the TMA‐IMS technique has two advantages compared to existing techniques. Moreover, the TMA‐IMS technique does not require the complicated sample‐preparation steps which are required in 2‐DE‐MS‐based proteomics.
The high‐intensity signals detected from cancer tissues account for approximately two‐thirds (54 of 72) of all signals detected. We failed to detect signals specific to normal tissues. This could be explained by the heterogeneity underlying normal tissues. The adjacent normal tissues consisted of varied types of tissues, such as mucosa, fatty tissue, and muscle. Acquired signal intensities in normal tissues were the average of whole spectrum derived from each of the tissues. Hence, tissue type‐specific peaks were totally obscured, resulting in the failure to detect adjacent normal tissue‐specific peaks.
We detected 17 histological type‐specific peaks in two independent experiments. (Fig. 3) The reproducibility of signal detection from normal tissues was lower (4 per 17; 24%) than that of signal‐detection from cancer tissues (75%). This could be explained by our experimental paradigm under which we performed two‐step screening. The high severity of the first screening step excluded 9 of 13 peaks in either trial due to high variance among cancer tissues. In this technique, the two‐step screening is essential as we cannot rule out the possibility of detecting false positive signals that are specific merely for certain patients. This problem could be addressed by spotting more samples under a variety of cancer tissue conditions in a TMA and performing multiple direct comparisons.
We identified from IMS screening histone H4 as a protein that is specifically increased in poorly differentiated adenocarcinoma (Fig. 6a). To validate the IMS result, we performed IHC for histone H4 protein using large amount of archival TMA specimens composed of various cellular density. In both visual inspection and quantitative analysis of IHC, histone H4 was strongly detected in poorly differentiated carcinoma (Fig. 7b,c). Similar strong detection of histone H4 in a cancer tissue has been reported by a recent study on a mouse model of brain tumor analyzed by IMS.( 24 ) Dynamic chromatin remodeling such as DNA methylation, histone variants, covalent histone modifications, and ATP‐dependent chromatin remodeling play important roles in carcinogenesis.( 25 , 26 ) Indeed, poorly differentiated gastric adenocarcinoma is reported to lose Brm, a subunit of ATP‐dependent chromatin‐remodeling complex.( 27 ) It can be assumed that these epigenetic changes lead to the chromatin‐unfolding state and allow ready access to core histone protein. It might be also plausible that the higher cellular density of the poorly differentiated cancer tissues compared to other tissues explains the reason underlying the successful detection of a vast majority of histological type‐specific signals from IMS. Conversely, signals specific to well‐ or moderately differentiated adenocarcinoma reflect the more‐significant changes among the three histological types.
IMS technique was originally applied for the analysis of frozen tissue sections. FFPE samples are unsuitable for performing IMS due to the presence of cross‐linkage between proteins and the inefficiency of enzyme digestion. Thus, few studies have reported the performance of IMS on FFPE samples.( 28 , 29 , 30 ) Further, our study was hampered due to the disadvantage of FFPE. Due to the low S/N ratio, the identification of cancer‐ or histological type‐specific proteins was rendered difficult.
TMA was originally used for IHC or in situ hybridization.( 11 , 31 ) While this study was being conducted, another group reported the IMS of lung tumor biopsy in FFPE‐TMA samples.( 32 ) Thus, the FFPE‐TMA‐IMS has now emerged as the newest imaging technique. Other researchers have used this technique as an imaging tool to detect signals showing characteristic distribution in a particular tissue spot.( 32 ) In contrast, we used the technique as a scanner for multiprocessing proteomics to readily detect cancer‐specific signals. Two studies along these lines have reported highly different approaches. In this work, we loaded 12 tissue spots with 3‐mm diameter in a TMA. Due to improvements in IMS resolution, the tissue spot size can now be reduced to submillimeter scales, enabling the loading of hundreds of tissue samples in one TMA. Thus, this technique can be applied for the analysis of a greater number of samples for high‐throughput analysis of cancer characteristics.
Once a patient develops cancer, he or she should be subjected to medical treatments, including surgical operation and/or chemotherapy. To enable early detection of cancers, specific and sensitive biomarkers are desired. Using 2‐DE based on MALDI mass spectrometry, potential proteins related to carcinogenesis have been discovered.( 33 , 34 ) Further, in cases of far advanced or recurrent gastric carcinoma, chemotherapy prolongs the survival of the patient at a certain rate.( 35 ) Proteomic analysis yielded an antidrug resistance agent,( 36 ) while multidrug resistances were observed in certain cases. For retrospective evaluation and prospective searches of chemotherapy‐related markers, high‐throughput pathological evaluation methods are essential. IMS using TMA in FFPE, as we show here, will be one of the most promising gadgets in the surgical pathology laboratory.
In conclusion, we performed IMS of FFPE‐TMA samples of gastric carcinoma, and successfully identified histone H4 as a signal specific to poorly differentiated cancer tissues. Moreover, the IMS‐based finding was confirmed by IHC analyses of a large amount of TMAs. IMS of FFPE samples is a currently emerging technique and our experience represents an important step in the early phase of development. IMS of FFPE‐TMA can offer fast and easy screening of cancer or tissue type‐specific signals from a large amount of samples. The results of IMS‐based screening can be readily verified by IHC analysis with other sets of FFPE‐TMA samples. Combined with IHC confirmation, IMS of FFPE‐TMA samples may be a further powerful tool in cancer proteomics.
Supporting information
Fig. S1. The array images obtained with imaging mass spectrometry (IMS) are shown. There are 18 evenly distributed images and 37 cancer specific ones, two well‐differentiated adenocarcinoma‐specific images, one well‐ and moderately differentiated adenocarcinoma‐specific image, two moderately differentiated adenocarcinoma‐specific images, four moderately and poorly differentiated adenocarcinoma‐specific images, and eight poorly differentiated adenocarcinoma‐specific images. Values are represented as mean ± SD (n = 3). *P < 0.05. †P < 0.05.
Please note: Wiley‐Blackwell are not responsible for the content or functionality of any supporting materials supplied by the authors. Any queries (other than missing material) should be directed to the corresponding author for the article.
Supporting info item
Acknowledgments
This work was supported by a SENTAN step‐up grant from JST to M.S. and by Grants‐in‐Aid from the Ministry of Health, Labour and Welfare for the Comprehensive 10‐Year Strategy for Cancer Control (19‐19) and the Third Term Comprehensive Control Research for Cancer; the Japan Society for the Promotion of Science for Scientific Research (no. 19790286), and the Smoking Research Foundation.
References
- 1. DeRisi J, Penland L, Brown PO et al. Use of a cDNA microarray to analyse gene expression patterns in human cancer. Nat Genet 1996. Dec; 14 (4): 457–60. [DOI] [PubMed] [Google Scholar]
- 2. Ramsay G. DNA chips: state‐of‐the art. Nat Biotechnol 1998. Jan; 16 (1): 40–4. [DOI] [PubMed] [Google Scholar]
- 3. Zhao X, Li C, Paez JG et al. An integrated view of copy number and allelic alterations in the cancer genome using single nucleotide polymorphism arrays. Cancer Res 2004. May 1; 64 (9): 3060–71. [DOI] [PubMed] [Google Scholar]
- 4. Engle LJ, Simpson CL, Landers JE. Using high‐throughput SNP technologies to study cancer. Oncogene 2006. Mar 13; 25 (11): 1594–601. [DOI] [PubMed] [Google Scholar]
- 5. McLendon R, Friedman A, Bigner D et al. Comprehensive genomic characterization defines human glioblastoma genes and core pathways. Nature 2008. Oct 23; 455 (7216): 1061–8. [DOI] [PMC free article] [PubMed] [Google Scholar]
- 6. Ley TJ, Mardis ER, Ding L et al. DNA sequencing of a cytogenetically normal acute myeloid leukaemia genome. Nature 2008. Nov 6; 456 (7218): 66–72. [DOI] [PMC free article] [PubMed] [Google Scholar]
- 7. Hood L, Heath JR, Phelps ME, Lin B. Systems biology and new technologies enable predictive and preventative medicine. Science 2004. Oct 22; 306 (5696): 640–3. [DOI] [PubMed] [Google Scholar]
- 8. Aebersold R, Mann M. Mass spectrometry‐based proteomics. Nature 2003. Mar 13; 422 (6928): 198–207. [DOI] [PubMed] [Google Scholar]
- 9. Diamandis EP. Mass spectrometry as a diagnostic and a cancer biomarker discovery tool: opportunities and potential limitations. Mol Cell Proteomics 2004. Apr; 3 (4): 367–78. [DOI] [PubMed] [Google Scholar]
- 10. Sreekumar A, Nyati MK, Varambally S et al. Profiling of cancer cells using protein microarrays: discovery of novel radiation‐regulated proteins. Cancer Res 2001. Oct 15; 61 (20): 7585–93. [PubMed] [Google Scholar]
- 11. Kononen J, Bubendorf L, Kallioniemi A et al. Tissue microarrays for high‐throughput molecular profiling of tumor specimens. Nat Med 1998. Jul; 4 (7): 844–7. [DOI] [PubMed] [Google Scholar]
- 12. Stoeckli M, Chaurand P, Hallahan DE, Caprioli RM. Imaging mass spectrometry: a new technology for the analysis of protein expression in mammalian tissues. Nat Med 2001. Apr; 7 (4): 493–6. [DOI] [PubMed] [Google Scholar]
- 13. Shimma S, Sugiura Y, Hayasaka T, Zaima N, Matsumoto M, Setou M. Mass imaging and identification of biomolecules with MALDI‐QIT‐TOF‐based system. Anal Chem 2008. Feb 1; 80 (3): 878–85. [DOI] [PubMed] [Google Scholar]
- 14. Shimma S, Furuta M, Ichimura K, Yoshida Y, Setou M. Direct MS/MS analysis in mammalian tissue sections using MALDI‐QIT‐TOFMS and chemical inkjet technology. Surf Interface Anal 2006; 38 (2): 1712–14. [Google Scholar]
- 15. Groseclose MR, Andersson M, Hardesty WM, Caprioli RM. Identification of proteins directly from tissue: in situ tryptic digestions coupled with imaging mass spectrometry. J Mass Spectrom 2007. Feb; 42 (2): 254–62. [DOI] [PubMed] [Google Scholar]
- 16. Crew KD, Neugut AI. Epidemiology of gastric cancer. World J Gastroenterol 2006. Jan 21; 12 (3): 354–62. [DOI] [PMC free article] [PubMed] [Google Scholar]
- 17. Japanese Gastric Cancer A . Japanese classification of gastric carcinoma – 2nd English edn. Gastric Cancer 1998. Dec; 1 (1): 10–24. [DOI] [PubMed] [Google Scholar]
- 18. Schwartz SA, Reyzer ML, Caprioli RM. Direct tissue analysis using matrix‐assisted laser desorption/ionization mass spectrometry: practical aspects of sample preparation. J Mass Spectrom 2003. Jul; 38 (7): 699–708. [DOI] [PubMed] [Google Scholar]
- 19. Espada A, Rivera‐Sagredo A. Ammonium hydrogencarbonate, an excellent buffer for the analysis of basic drugs by liquid chromatography‐mass spectrometry at high pH. J Chromatogr A 2003. Feb 14; 987 (1–2): 211–20. [DOI] [PubMed] [Google Scholar]
- 20. Wong JW, Cagney G, Cartwright HM. SpecAlign – processing and alignment of mass spectra datasets. Bioinformatics 2005. May 1; 21 (9): 2088–90. [DOI] [PubMed] [Google Scholar]
- 21. Whistler T, Rollin D, Vernon SD. A method for improving SELDI‐TOF mass spectrometry data quality. Proteome Sci 2007; 5: 14. [DOI] [PMC free article] [PubMed] [Google Scholar]
- 22. Yanaga Y, Awai K, Nakaura T et al. Optimal contrast dose for depiction of hypervascular hepatocellular carcinoma at dynamic CT using 64‐MDCT. AJR Am J Roentgenol 2008. Apr; 190 (4): 1003–9. [DOI] [PubMed] [Google Scholar]
- 23. Lemaire R, Desmons A, Tabet JC, Day R, Salzet M, Fournier I. Direct analysis and MALDI imaging of formalin‐fixed, paraffin‐embedded tissue sections. J Proteome Res 2007. Apr; 6 (4): 1295–305. [DOI] [PubMed] [Google Scholar]
- 24. Seeley EH, Caprioli RM. Molecular imaging of proteins in tissues by mass spectrometry. Proc Natl Acad Sci USA 2008. Nov 25; 105 (47): 18126–31. [DOI] [PMC free article] [PubMed] [Google Scholar]
- 25. Wang GG, Allis CD, Chi P. Chromatin remodeling and cancer, part I: covalent histone modifications. Trends Mol Med 2007. Sep; 13 (9): 363–72. [DOI] [PubMed] [Google Scholar]
- 26. Wang GG, Allis CD, Chi P. Chromatin remodeling and cancer, part II: ATP‐dependent chromatin remodeling. Trends Mol Med 2007. Sep; 13 (9): 373–80. [DOI] [PMC free article] [PubMed] [Google Scholar]
- 27. Yamamichi N, Inada K, Ichinose M et al. Frequent loss of Brm expression in gastric cancer correlates with histologic features and differentiation state. Cancer Res 2007. Nov 15; 67 (22): 10727–35. [DOI] [PubMed] [Google Scholar]
- 28. Aoki Y, Toyama A, Shimada T et al. A novel method for analyzing formalin‐fixed paraffin embedded (FFPE) tissue sections by mass spectrometry imaging. Proc Jpn Acad Ser B 2007; 83 (2): 205–14. [DOI] [PMC free article] [PubMed] [Google Scholar]
- 29. Stauber J, Lemaire R, Franck J et al. MALDI imaging of formalin‐fixed paraffin‐embedded tissues: application to model animals of Parkinson disease for biomarker hunting. J Proteome Res 2008. Mar; 7 (3): 969–78. [DOI] [PubMed] [Google Scholar]
- 30. Ronci M, Bonanno E, Colantoni A et al. Protein unlocking procedures of formalin‐fixed paraffin‐embedded tissues: application to MALDI‐TOF imaging MS investigations. Proteomics 2008. Sep; 8 (18): 3702–14. [DOI] [PubMed] [Google Scholar]
- 31. Sugimura H. Detection of chromosome changes in pathology archives: an application of microwave‐assisted fluorescence in situ hybridization to human carcinogenesis studies. Carcinogenesis 2008. Apr; 29 (4): 681–7. [DOI] [PubMed] [Google Scholar]
- 32. Groseclose MR, Massion PP, Chaurand P, Caprioli RM. High‐throughput proteomic analysis of formalin‐fixed paraffin‐embedded tissue microarrays using MALDI imaging mass spectrometry. Proteomics 2008. Sep; 8 (18): 3715–24. [DOI] [PMC free article] [PubMed] [Google Scholar]
- 33. Yoshihara T, Kadota Y, Yoshimura Y et al. Proteomic alteration in gastic adenocarcinomas from Japanese patients. Mol Cancer 2006; 5: 75. [DOI] [PMC free article] [PubMed] [Google Scholar]
- 34. Cheng Y, Zhang J, Li Y, Wang Y, Gong J Proteome analysis of human gastric cardia adenocarcinoma by laser capture microdissection. BMC Cancer 2007; 7: 191. [DOI] [PMC free article] [PubMed] [Google Scholar]
- 35. Ohtsu A. Chemotherapy for metastatic gastric cancer: past, present, and future. J Gastroenterol 2008; 43 (4): 256–64. [DOI] [PubMed] [Google Scholar]
- 36. Wang X, Lu Y, Yang J et al. Identification of triosephosphate isomerase as an anti‐drug resistance agent in human gastric cancer cells using functional proteomic analysis. J Cancer Res Clin Oncol 2008. Sep; 134 (9): 995–1003. [DOI] [PubMed] [Google Scholar]
Associated Data
This section collects any data citations, data availability statements, or supplementary materials included in this article.
Supplementary Materials
Fig. S1. The array images obtained with imaging mass spectrometry (IMS) are shown. There are 18 evenly distributed images and 37 cancer specific ones, two well‐differentiated adenocarcinoma‐specific images, one well‐ and moderately differentiated adenocarcinoma‐specific image, two moderately differentiated adenocarcinoma‐specific images, four moderately and poorly differentiated adenocarcinoma‐specific images, and eight poorly differentiated adenocarcinoma‐specific images. Values are represented as mean ± SD (n = 3). *P < 0.05. †P < 0.05.
Please note: Wiley‐Blackwell are not responsible for the content or functionality of any supporting materials supplied by the authors. Any queries (other than missing material) should be directed to the corresponding author for the article.
Supporting info item