

Abstract
The number of published studies on peritoneal dissemination of scirrhous gastric carcinoma is very small as a result of the unavailability of highly reproducible animal models. Orthotopic implantation of HSC‐44PE and HSC‐58 (scirrhous gastric carcinoma‐derived cell lines) cells into nude mice led to dissemination of the tumor cells to the greater omentum, mesenterium, peritoneum and so on, and caused ascites in a small number of animals. Cycles of isolation of the ascitic tumor cells and orthotopic inoculation of these cells were repeated in turn to animals. This was to isolate highly metastatic cell lines with a strong capability of inducing the formation of ascites (44As3 from HSC‐44PE; 58As1 and 58As9 from HSC‐58). All three cell lines induced tumor formation at the site of orthotopic injection, and caused fatal cancerous peritonitis and bloody ascites in 90–100% of the animals approximately 3–5 weeks after the inoculation. When the parent cells were implanted, the animals became moribund in approximately 12–18 weeks, however, none of the animals developed ascites. Complementary DNA microarray and immunohistochemical analyses revealed differences in the expression levels of genes coding for the matrix proteinase, cell adhesion, motility, angiogenesis and proliferation between the highly metastatic‐ and parent‐cell lines. The usefulness of this model for the evaluation of drugs was assessed by analyzing the stability of the metastatic potential of the cells and the reproducibility. Animals intravenously treated with CPT‐11 and GEM showed suppressed tumor growth and significantly prolonged survival. The metastatic cell lines and the in vivo model established in the present study are expected to serve as a model of cancerous peritonitis developing from primary lesions, and as a useful means of clarifying the pathophysiology of peritoneal dissemination of scirrhous gastric carcinoma and the development of drugs for its treatment. (Cancer Sci 2005; 96: 323–332)
Abbreviations:
- cDNA
complementary DNA
- CPT‐11
camptothecin
- GEM
gemcitabine
- s.c.
subcutaneously
- i.p.
intraperitoneally
- i.v.
intravenously
Although therapeutic results for gastric cancer have improved recently, the prognosis of patients with scirrhous gastric carcinoma still remains very poor. Scirrhous gastric carcinoma (diffusely infiltrative carcinoma or Borrmann's type‐IV carcinoma, or the linitis plastica‐type carcinoma) is characterized macroscopically by rigid thickening of the involved region of the gastric wall, causing it to assume a plate‐like appearance, rather than by a well‐defined mass.( 1 ) Histopathologically, scirrhous cancer cells do not form glands, but cause diffuse infiltration of a broad region of the gastric wall, resulting in fibrous‐like thickening of the gastric wall.( 2 , 3 ) Because of such pathological features, early clinical diagnosis of scirrhous gastric carcinoma is difficult. By the time the diagnosis is made, peritoneal dissemination or distant metastasis to lymph nodes has already occurred in many cases. Peritoneal dissemination occurs frequently even after radical surgery, and is the cause of death in many patients.( 4 , 5 ) Thus, peritoneal dissemination, a frequent form of recurrence and metastasis of scirrhous gastric carcinoma, serves as a major factor determining the prognosis of patients with scirrhous gastric carcinoma. To date, however, the mechanism of peritoneal dissemination in this type of cancer has not yet been fully elucidated.
Several theories have been proposed to explain the mechanism of peritoneal dissemination in human gastric cancer; it has been suggested that the cancer cells are detached from the primary lesions and freed into the peritoneal cavity, to colonize the peritoneum and induce cancerous peritonitis. However, most of the proposed theories remain speculations, and are seldom based on adequate evidence.( 6 , 7 , 8 ) It cannot be overemphasized therefore that animal models of this condition are urgently needed to pursue studies on its pathophysiology. Some investigators have reported on a model of this condition established by direct inoculation of cultured gastric cancer cells into the peritoneal cavity.( 9 , 10 ) It is difficult, however, to view this model as faithfully reflecting the characteristics of cancerous peritonitis observed in clinical cases. In the past, it was considered difficult to reliably establish a model of peritoneal dissemination developing from the primary lesions. Under these circumstances, we established seven cultured cell lines derived from human scirrhous gastric carcinoma and analyzed their characteristics.( 11 , 12 , 13 , 14 ) Of these cell lines, the HSC‐44PE and HSC‐58 cells were found to show spontaneous metastasis to lymph nodes and lungs following s.c. implantation in nude mice.( 14 ) Then, to isolate cell lines with a high metastatic potential, we performed repetitive s.c. inoculation of these cell lines and isolated sublines that tended to metastasize to lymph nodes. When these sublines were implanted orthotopically, a small number of animals showed massive bloody ascites. This phenomenon resembled the cancerous peritonitis seen in clinical cases and suggested a high possibility of establishing a reproducible mouse model of peritoneal dissemination.
In the present paper, we shall report on an analysis of the characteristics of tumor cell lines that often cause ascites (cell lines with a high potential for peritoneal dissemination) isolated by repeated orthotopic implantation of HSC‐44PE and HSC‐58 cells. The paper will also describe the results of cDNA microarray and immunohistochemical analyses of these cell lines as the first step towards clarifying the molecular mechanism of development of peritoneal metastasis in gastric cancer. In addition, the usefulness of these cell lines as a model for drug evaluation will also be discussed.
Materials and Methods
Cell lines and culture. HSC‐39, HSC‐44PE and HSC‐58 and cell lines established from human scirrhous gastric carcinomas have been reported previously.( 11 , 14 ) The cell lines were maintained in RPMI1640 medium (Immuno‐Biological Laboratories (IBL), Takasaki, Japan) supplemented with 10% FCS (Sigma Chemical, St. Louis, MO, USA), 100 IU/mL penicillin G sodium and 100 µg/mL streptomycin sulfate (IBL) in a 5% CO2 and 95% air atmosphere at 37°C. The cells were passaged and expanded by trypsinization (0.05% trypsin and 0.02% EDTA; IBL), followed by replating every 5–7 days. All the cell lines were routinely tested for Mycoplasma by the Central Institute for Experimental Animals (Kawasaki, Japan), and no contamination was detected. For injection into mice, cells in log‐phase growth were harvested by trypsinization and washed with serum‐free RPMI1640 medium.
Animal experimentation. The animal experimental protocols were approved by the Committee for Ethics of Animal Experimentation, and the experiments were conducted in accordance with the Guidelines for Animal Experiments in the National Cancer Center. The mice were purchased from CLEA Japan (Tokyo, Japan) and maintained under specific pathogen‐free conditions. They were provided with sterile food and water and housed in cages. The ambient light was controlled to provide regular 12‐h light and 12‐h darkness cycles.
Establishment of cell lines with a strong potential for inducing the formation of peritoneal metastasis. HSC‐44PE and HSC‐58 cell lines were inoculated by the orthotopic implantation technique into BALB/c nude mice. At appropriate intervals, or when moribund, the mice were sacrificed and the ascitic tumor cells were harvested aseptically. The cell suspensions were then cultured in vitro. The same procedure was repeated using both cell lines, and cell lines with a high potential for inducing the formation of peritoneal metastasis were established after 12 cycles of stepwise selection. Each resultant cell line after in vitro passages 5–10 was used for experiments.
Orthotopic implantation. Six‐week‐old female BALB/c nude mice were anesthetized by i.p. injection of 2.2.2‐tribromoethanol (Aldrich Chemical, Milwaukee, WI, USA) at the dose of 0.28 mg/g bodyweight. Then, after making a small median abdominal incision in the mice under anesthesia, 2 × 10⁶ cells in 0.05‐mL volume of RPMI medium were inoculated into the middle wall of the greater curvature of the glandular portion of the stomach using a 30‐gauge needle (Nipro, Tokyo, Japan). The stomach was then returned into the peritoneal cavity, and the abdominal wall and skin were closed with an AUTOCLIP applier (Becton‐Dickinson, Sparks, MD, USA). The mice were killed 200 days after the tumor cell inoculation or when moribund, and peritoneal dissemination was evaluated by counting the number of tumor nodules in the mesenterium. The body organs were examined for metastasis, and various tissues were processed for histological examination.
Evaluation of the growth rate and metastatic potential of the cell lines. The tumorigenicity and spontaneous‐metastatic potential of the cell lines were tested by s.c. injection of 0.5–1 × 10⁷ cells suspended in 0.2 mL of RPMI1640 medium into 6‐week‐old female BALB/c nude mice. All the mice were numbered, housed separately, and examined twice weekly for tumor development. The tumor mass was measured in two dimensions with calipers, and the tumor volume was calculated according to the equation (l × w2)/2 (l = length, w = width). At appropriate intervals or when moribund, the mice were killed, and various organs and tissues were examined for metastasis and processed for histological examination as described.( 11 )
Therapeutic studies with CPT‐11 and GEM. Orthotopic implantation of 2 × 10⁶ 44As3 or 58As1 cells was conducted in 6‐week‐old female BALB/c mice (Day 0). The experimental mice were divided into a control group that received vehicle alone (saline), and experimental groups that received i.v. inoculation of different doses of the drugs (50–200 mg/kg/mouse). On Days 3, 7 and 11, tumor‐bearing mice received an i.v. injection of 7‐Ethyl‐10‐[4‐(1‐piperidino)‐1‐piperidino] carboxycamptothecin (CPT‐11). CPT‐11 was purchased from Yakult Honsha (Tokyo, Japan) and dissolved in saline before being injected i.v. Gemcitabine (gemcitabine hydrochloride), chemically characterized as (+)‐2′‐deoxy‐2′, 2′‐difluorocytidine monohydrochloride, was purchased from Eli Lilly Japan (Kobe, Japan). The mice were administered i.v. inoculations of GEM on days 3, 7, 10, 14, 17, and 21. Seven mice from each group were killed when moribund, or on Day 70.
Statistical analysis. All the data were expressed as the mean ± SE, and analyzed using the unpaired t‐test and a P‐value of less than 0.001 was considered to denote statistical significance.
RT‐PCR analysis. Total RNA was extracted using the ISOGEN/ISOGEN‐LS Poly (A) + Isolation Pack (Nippon Gene, Tokyo, Japan), in accordance with the supplier's protocol. After reverse transcription using 1 µg total RNA with an oligo (dT) primer, the whole mixture was used for PCR detecting human and murine β actin. The primers used were as follows; human β actin forward primer, GGAAATCGTGCGTGACATT; reverse primer, CATCTGCTGGAAGGTGGACAG; murine β actin forward primer, GAAATCGTGCGTGACATCAAA; reverse primer, TACTGGTGCTAGGAGCCA. PCR was performed using an RNA PCR kit (Applied Biosystems, Foster City, CA, USA), under the following conditions; initial denaturation at 95°C for 2 min, 35 cycles of amplification (denaturation at 95°C for 60 s and annealing at 60°C for 60 s), and extension at 72°C for 7 min. The PCR products were electrophoresed on 2% agarose gel, and stained with ethidium bromide.
Gene expression profiling by cDNA microarray analysis. 5 µg total RNA was amplified using an in vitro transcription reaction.( 15 ) The amplified RNA (6 µg) was reverse‐transcribed using random hexamers and aminoallyl‐dUTP. The synthesized cDNA was labeled by allowing it to react with a dye (NHS‐ester Cy3 or Cy5, Amersham Biosciences, Buckinghamshire, UK).( 16 ) The labeled cDNA was applied to the DNA microarray (Human IA; Agilent Technologies, Palo Alto, CA, USA) and hybridized at 65°C for 17 h. After washing, the microarray was scanned on a scanner (Agilent, G2565BA) and the image was analyzed using a Feature Extraction software (Agilent). The signal intensity of each spot was calibrated by subtraction from the intensity of the negative control. Global normalization methods were used for identification of the differentially expressed genes in each microarray experiment.
Immunohistochemical Analysis. Mouse antibodies against human Cathepsin L (C2970) and MMP‐1 (M6427: Sigma‐Aldrich, St. Louis, MO, USA), human VEGF (JH121: Laboratory Vision, Fremont, CA, USA), human EGER (31G7: Zymed Laboratory, San Francisco, CA, USA) and human Smad4 (B‐8; Santa Cruz Biotechnology, Santa Cruz, CA, USA) were used for this study. The other antibodies used have been described in a previous study.( 14 ) Immunohistochemical staining was carried out as described previously.( 8 ) The staining was repeated to check for possible technical errors, but the results were consistent. Scores for the expression of various genes were assigned semiquantitatively according to the percentage of the cells stained and the staining intensity.
Results
Establishment of the highly metastatic cell lines. Following s.c. inoculation, 20–40% of the HSC‐44PE and HSC‐58 cells (cultured scirrhous gastric carcinoma cells) metastasized spontaneously to the regional lymph nodes and lungs. When the subclones isolated by repeated s.c. injection of these cells were implanted orthotopically, they spread to the greater omentum, mesenterium and so on, and caused the formation of bloody ascites in a small number of animals.( 14 ) Following this result, we incubated the cancer cells isolated from the ascitic fluid of mice, which developed cancerous peritonitis 3–6 months following the orthotopic implantation of HSC‐44PE and HSC‐58 cells, and attempted orthotopic injection of the incubated cells. This sequence of manipulations was repeated for 12 cycles in an attempt to reliably isolate cell lines that would have higher potentials of undergoing metastasis (in the form of dissemination) over short periods of time. We first obtained a cell line (44As3) from HSC‐44PE cells that possessed a high metastatic potential, with a strong capability of inducing ascites. The 44As3 cells resembled the parent HSC‐44PE cells in their morphological characteristics. While most cells of this subline exhibited high adhesivity, a small number of spherical cells remained floating and showed proliferative activity. Occasional signet ring cells were also observed (Fig. 1). Although the proliferative potential of the 44As3 cells did not differ greatly from that of the parent cell line in vitro (Fig. 1A), the former induced more rapid s.c. tumor formation than the latter (Fig. 1B).
Figure 1.
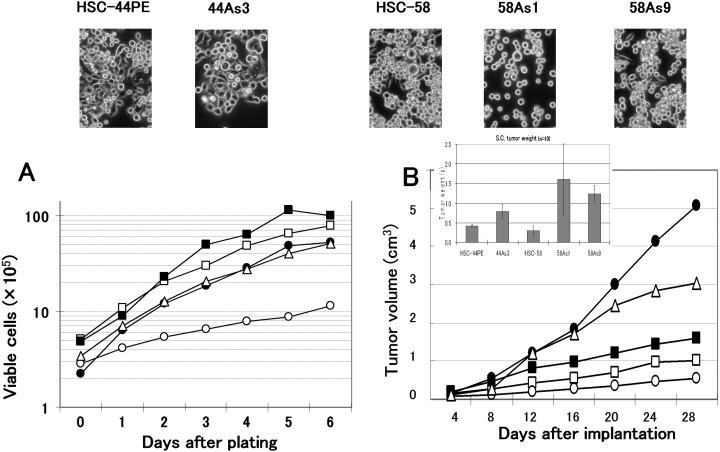
Phase‐contrast micrographs and the growth properties of the sublines showing a high metastatic potential and their parent cell lines. Original magnification, × 200. (A), Growth curves of the cells in vitro. Cells were seeded at a density of 1 × 10⁵ cells/well in 6‐well plates (Falcon, Lincoln Park, NJ, USA), and the cell numbers were determined daily. The results of a representative experiment are given and the points indicate the average of the results in 3 wells in which the cell numbers varied by 10%. (B), Growth curves of the cells in vivo. Tumor volume was measured at predetermined time intervals described in ‘Materials and Methods.’ HSC‐44PE (□), 44As3 (▪), HSC‐58 (○), 58As1 (•), and 58As9 (▵) cell lines were used. Similar results were obtained in a second experiment conducted independently.
Two highly metastatic cell lines (58As1 and 58As9) were also established from the HSC‐58 cells. The 58As1 cells assumed the form of aggregates of spherical cells with low adhesive capacity, which remained floating and showed proliferative activity. In contrast, 58As9 cells often exhibited high adhesivity, resembling the parent cell line, HSC‐58, in this characteristic (Fig. 1). Both 58As1 and 58As9 cells exhibited higher proliferative potential in vitro than the parent HSC‐58 cells (Fig. 1A), and the tumor‐forming capability following s.c. injection of these subclones differed markedly from that of the parent cell line; the 58As1 cells, in particular, showed a markedly higher tumor‐forming capability (Fig. 1B).
Comparison of the highly metastatic cell lines and the parent cell lines in vivo. Table 1 shows the metastatic behavior and the survival days of animals following orthotopic injection of the tumor cells. Orthotopic implantation of 44As3 cells resulted in the formation of bloody ascites approximately 20 days later, and some mice became moribund (Fig. 2D). Dissemination was most often seen to the greater omentum, mesenterium, parietal peritoneum, diaphragm, and so on. Metastasis to the regional lymph nodes and liver was also frequently seen (Table 1). Micrometastasis was observed in the pancreas (also in the lungs, although rarely). The percentage of parent HSC‐44PE cells that survived at the site of implantation was 68%. Inoculation of HSC‐44PE cells resulted in the animals becoming moribund approximately 85 days after the implantation, but none of the animals developed ascites (Table 1, Fig. 2D).
Table 1.
Metastasis and peritoneal dissemination after orthotopic inoculation of human gastric cancer cell lines and sublines †
| Cell line | Survival days | Tumor formation | Ascites | Lymph node | Lung ‡ | Liver | Pancreas ‡ | Kidney ‡ | Disseminated Metastasis | |||
|---|---|---|---|---|---|---|---|---|---|---|---|---|
| Omentum | Mesenterium | Parietal peritoneum | Diaphragm | |||||||||
| HSC‐44PE | 131 ± 44 | 13/19 | 0/13 | 5/13 | 0/13 | 0/13 | 0/13 | 0/3 | 4/13 | 3/13 | 2/13 | 0/13 |
| (85–200) | (68%) | (0%) | ||||||||||
| 44As3 | 33 ± 11 | 21/21 | 19/21 | 21/21 | 2/21 | 19/21 | 10/21 | 0/21 | 21/21 | 21/21 | 20/21 | 14/21 |
| (20–62) | (100%) | (90%) | ||||||||||
| HSC‐58 | 85 ± 16 | 16/20 | 1/16 | 5/16 | 1/16 | 3/16 | 1/16 | 0/16 | 6/16 | 3/16 | 3/16 | 0/16 |
| (68–123) | (80%) | (6%) | ||||||||||
| 58As1 | 32 ± 5 | 21/21 | 20/21 | 21/21 | 6/21 | 19/21 | 7/21 | 4/21 | 21/21 | 21/21 | 21/21 | 13/21 |
| (23–42) | (100%) | (95%) | ||||||||||
| 58As9 | 45 ± 13 | 14/14 | 14/14 | 14/14 | 2/14 | 7/14 | 1/14 | 0/14 | 14/14 | 10/14 | 11/14 | 8/14 |
| (22–68) | (100%) | (100%) | ||||||||||
Mice were killed at 200 days after the orthotopic implantation. Data are shown as the number of mice bearing metastasis at the site/total number of mice bearing tumor.
‡ Micrometastasis.
Figure 2.
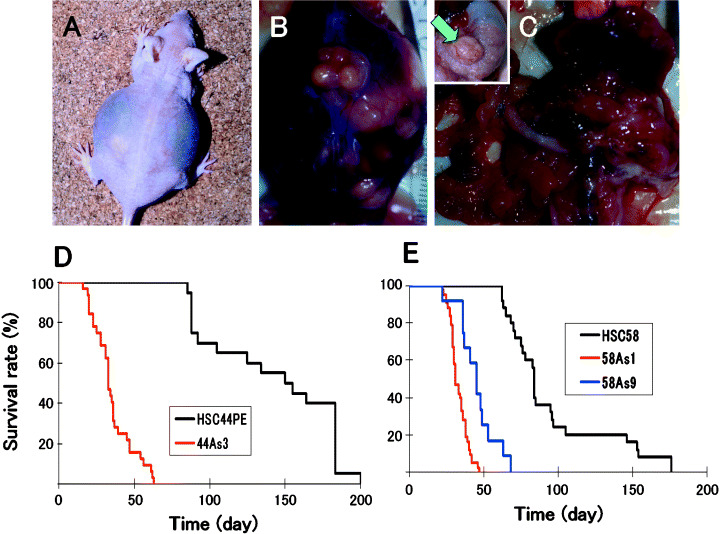
Macroscopic appearance of the peritoneal disseminations, and survival of nude mice after orthotopic implantation of the cell lines. (A,B), Carcinomatous peritonitis was observed 4 weeks after orthotopic implantation of 58As1 cells. Abdominal distension because of bloody ascites was evident. (C), Peritoneal dissemination was recognized from the innumerable whitish nodules visualized in the abdominal cavity, mesenterium, omentum, parietal peritoneum and diaphragm. Orthotopic implantation of 58As1 cells in the stomach of nude mice was followed by tumor formation 3 weeks later (green arrow, inset). (D), Survival of 44As3‐, and HSC‐44PE‐tumor‐bearing mice (n = 15; P < 0.001). (E), Survival of 58As1‐, 58As9‐, and HSC‐58‐tumor‐bearing mice (n = 20; P < 0.001). The experiments were repeated thrice and yielded similar results each time.
When 58As1 or 58As9 cells were implanted orthotopically, bloody ascites began to form approximately 3 weeks after the inoculation, accompanied by tumor dissemination to the greater omentum, mesenterium, parietal peritoneum, diaphragm and so on, and the animals died soon thereafter (Table 1, Fig. 2A–C). Lymph node metastasis was observed in all the animals; metastasis to the liver was also noted. Micrometastases were seen in the pancreas and the lungs. Implantation of 58As1 cells was followed by the development of micrometastases in the kidney also. Although only rarely, pleural effusion and ovarian micrometastases were also noted (data not shown). Orthotopic injection of the parent cell line (HSC‐58), however, resulted in the mice becoming moribund approximately 68 days after the implantation (Table 1, Fig. 2E). When the dead animals were autopsied, mild peritoneal dissemination was noted, but ascites were observed in only a very small number of animals (Table 1).
Comparison of gene expression between the highly metastatic‐ and the parent cell lines. The parent cell lines with a low potential for peritoneal dissemination were compared with the highly metastatic cell lines, using a cDNA microarray (approximately 30 000 genes; Agilent). The differences in the gene expression levels between the two types of cell lines were assessed by measuring the ratios of their expression. The ratio was rated as significant when it was over 2:1. The first 15 genes ranked in terms of this ratio are shown in 2, 3. When the highly metastatic cell line 44As3 was compared with its parent cell line HSC‐44PE, the expression of 89 genes, such as that of MMP1 and cathepsin L, was more intense and that of 19 genes; for example, thrombospondin 1 was less intense in the 44As3 cells in comparison to the parent cell line (Table 2). Table 2 shows the results of a similar comparison of 58As1 and 58As9 cells (highly metastatic cell lines showing a marked increase of proliferative potential) with the parent cell line, HSC‐58. Compared to that in the parent cell line, 58As1 cells showed more intense expression of 40 and less intense expression of 20 of the genes examined, while 58As9 cells showed more intense expression of 36 and less intense expression of 32 of the genes examined. In addition to the MMP1 and cathepsin L genes, genes encoding molecules associated with cell adhesion, motility, proliferation, apoptosis, metabolic enzymes and so on, also showed altered expression.
Table 2.
Genes that show differential expression levels in 44As3 cells as compared with those in HSC‐44PE cells
| Ratio | Symbol | Gene name | Function and description |
|---|---|---|---|
| Upregulated gene | |||
| 29.63 | MMP1 | Matrix metalloproteinase 1 | Proteolysis and peptidolysis, collagenase |
| 11.25 | LOC57402 | Cell signaling | |
| 9.68 | I_1109564 | H19 | Unknown function |
| 4.92 | LGALS1 | Lectin, galactoside‐binding, galectin 1 | Apoptosis, cell adhesion |
| 4.84 | I_930461 | Tropomyosin 2 (beta) | Contractile proteins |
| 4.47 | AGR2 | Anterior gradient 2 homolog (Xenepus laevis) | Oncogenesis |
| 4.40 | BOK | BCL2‐related ovarian killer | Induction of apoptosis |
| 4.03 | NAP1L4 | Nucleosome assembly protein 1‐like 4 | Nucleosome assembly |
| 3.99 | TNC | Tenascin C (hexabrachion) | Binding, cell adhesion |
| 3.98 | HSPB1 | Heat shock 27 kDa protein 1 | Regulation of translational initiation |
| 3.95 | HGD | Homogentisate 1,2‐dioxygenase | Tyrosine catabolism, phenylalanine catabolism |
| 3.83 | PIGPC1 | Plasma membrane protein actvated by p53, cell death | |
| 3.52 | PIASY | Apoptosis | |
| 3.48 | SYP | Synaptophysin | Regulating neurotransmitter release |
| 3.38 | RPS12 | Ribosomal protein S12 | |
| 3.36 | CTSL | Cathepsin L | Associated with highly invasive tumors |
| 3.35 | HSPC018 | Unknown function | |
| 3.23 | INSIG1 | Insulin induced gene 1 | Metabolism, cell proliferation |
| 3.20 | I_962761 | Insulin induced gene 1 | Metabolism, cell proliferation |
| 3.17 | I_963048 | Immunity | |
| Downregulated gene | |||
| 0.14 | THBS1 | Thrombospondin 1 | Endopeptidase inhibitor, signal transducer, cell adhesion |
| 0.34 | PRG1 | Proteoglycan 1, secretory granule | Proteoglycan |
| 0.41 | CUL4B | Cullin 4B | Cell cycle |
| 0.41 | MCM3 | MCM3 | Adenosinetriphosphatase, DNA binding |
| 0.42 | NFE2L3 | Nuclear factor (erythroid‐derived 2)‐like 3 | Transcription coactivator, transcription factor |
| 0.43 | THBS4 | Thrombospondin 4 | Heparin binding, calcium ion binding, cell adhesion |
| 0.45 | CD59 | CD59 antigen p18–20 | Lymphocyte antigen, defense response, signal transduction |
| 0.46 | VBP1 | von Hippel‐Lindau binding protein 1 | Protein binding |
| 0.46 | LOC51659 | Unkown function | |
| 0.47 | PODXL | Lymphocyte adhesin and homing | |
| 0.47 | H2BFB | H2B histon family member B | |
| 0.47 | ZNF195 | Zinc finger protein 195 | |
| 0.47 | MCT‐1 | Cyclin, cell cycle | |
| 0.48 | CD44 | CD44 antigen | Transmembrane glycoprotein, extracellular matrix attachment |
| 0.48 | NDUFA1 | NADH dehydrogenase (ubiquinone) | Energy pathways |
Table 3.
Genes that show differential expression levels in 58As1 and 58As9 compared with that in HSC‐58 cells
| Ratio | Symbol | Gene name | Function and description |
|---|---|---|---|
| Upregulated genes 58As1 | |||
| 19.41 | ADH1C | Alcohol dehydrogenase 1C, gamma polypeptide | Zinc ion binding, electron transporter, metabolism |
| 18.59 | ADH1B | Alcohol dehydrogenase IB, beta polypeptide | Zinc ion binding, electron transporter, metabolism |
| 17.70 | FABP1 | Fatty acid binding protein 1, liver | Lipid transporter, fatty acid metabolism, cell signaling |
| 15.21 | ADH1A | Alcohol dehydrogenase 1A, alpha polypeptide | Zinc ion binding, electron transporter, metabolism |
| 14.15 | PLAT | Plasminogen activator, tissue | Proteolysis and peptidolysis, blood coagulation |
| 11.01 | MTP | Microsomal triglyceride transfer protein subunit precursor | Lipid metabolism, Small molecule‐binding protein |
| 10.47 | AKR1C2 | Aldo‐keto reductase family 1, member C2 | Bile acid electron transporter, metabolism |
| 4.71 | CYP1B1 | Cytochrome P450, family 1, subfamily B, polypeptide 1 | Cytochrome P450, electron transporter, morphogenesis |
| 4.67 | AKR1C3 | Aldo‐keto reductase family 1, member C3 | Electron transporter, metabolism, cell proliferation |
| 4.04 | PON2 | Paraoxonase 2 | Arylesterase |
| 4.01 | RDHL | NADP‐dependent retinol dehydrogenase/reductase | |
| 3.73 | SERPINE2 | Serine proteinase inhibitor, clade E, member 2 | Serpin, development |
| 3.60 | PPP1R14A | Protein phosphatase 1, regulatory subunit 14A | |
| 3.54 | TGFBI | Transforming growth factor, beta‐induced, 68 kDa | Integrin binding, tumor suppressor, cell adhesion |
| 3.45 | PROCR | Protein C receptor, endothelial (EPCR) | Receptor, inflammatory response |
| Upregulated genes 58As9 | |||
| 7.03 | AKR1C2 | Aldo‐keto reductase family 1, member C2 | Bile acid transporter, binding, electron transporter |
| 6.08 | I_1109564 | H19, imprinted maternally expressed untranslated mRNA | Unknown function |
| 5.95 | MKNK2 | MAP kinase‐interacting serine/threonine kinase 2 | Phosphorylation, signal transduction |
| 4.10 | APOC1 | Apolipoprotein C‐I | Lipid metabolism |
| 4.07 | FLJ21841 | Unknown function | |
| 4.02 | SERPINE2 | Serine proteinase inhibitor, clade E, member 2 | Serpin, development |
| 3.77 | CTSL | Cathepsin L | Cathepsin L, associated with highly invasive tumors |
| 3.28 | AKR1C3 | Aldo‐keto reductase family 1, member C3 | Electron transporter, metabolism, cell proliferation |
| 3.11 | SIAT8B | Sialyltransferase 8B (alpha‐2, 8‐sialyltransferase) | Metabolism, embryogenesis and morphogenesis |
| 3.01 | FKBP1B | FK506 binding protein 1B | Popeptidylprolyl isomerase |
| 2.82 | KIAA1247 | Member of the sulftase family | |
| 2.80 | I_1000731 | GRB2‐associated binding protein 2 | Protein‐protein and protein–lipid interactions |
| 2.77 | STMN3 | Stathmin‐like 3 | Neurogenesis, SCG10 like‐protein, tumor progression |
| 2.75 | ANK3 | Ankyrin 3, node of Ranvier (ankyrin G) | Cytoskeletal anchoring, vesicle transport |
| 2.74 | CEBPE | CCAAT/enhancer binding protein (C/EBP), epsilon | Transcription activating factor, defense response |
| Downregulation 58As1 | |||
| 0.11 | LAMR1 | Laminin receptor 1 | Signal transduction, cell adhesion, invasive growth |
| 0.13 | S100A4 | S100 calcium binding protein A4 | Calcium ion binding, invasive growth |
| 0.15 | RARRES1 | Retinoic acid receptor responder | Negative regulation of cell proliferation |
| 0.15 | HLA‐DQB1 | HLA complex, class II, DQ beta 1 precursor | Immune response |
| 0.15 | KLK6 | Kallikrein 6 (neurosin, zyme) | Serine‐type peptidase, pathogenesis |
| 0.16 | TM4SF4 | Transmembrane 4 superfamily member 4 | Negative regulation of cell proliferation, glycosylation |
| 0.16 | HLA‐DRA | Major histocompatibility complex, class II, DR alpha | Immune response |
| 0.17 | CTNNB1 | Catenin (cadherin‐associated pritein), beta 1, 88 kDa | Tumor suppressor, cell adhesion, transcription |
| 0.19 | HLA‐DRB3 | Major histocompatibility complex, class II, DR beta 3 | Immune response |
| 0.20 | SAT | Spermidine/spermine N1‐acetyltransferase | Diamine N‐acetyltransferase, modulates tumorigenicity |
| 0.20 | HLA‐DRB5 | Major histocompatibility complex, class II, DR beta 5 | Immune response |
| 0.20 | I_966873 | Strong similarity to human HLA‐DRB1 | |
| 0.21 | FOS | v‐fos FBJ murine osteosarcoma viral oncogene homolog | Transcription, methylation, cell growth, oncogenesis |
| 0.21 | I_965396 | Unknown, high similarity to charcterized human AG2 | |
| 0.22 | CEACAM6 | Carcinoembryonic antigen‐related cell adhesion molecule 6 | Signal transduction, cell‐cell signaling |
| Downregulation 58As9 | |||
| 0.06 | CEACAM8 | Carcinoembryonic antigen‐related cell adhesion molecule 8 | Tumor antigen, immune response, cell adhesion |
| 0.07 | TM4SF3 | Transmembrane 4 superfamily member 3 | Signal transducer, tumor antigen, pathogenesis |
| 0.07 | LAMR1 | Laminin receptor 1 (ribosomal protein SA, 67 kDa) | Signal transduction, cell adhesion, invasive growth |
| 0.09 | CEACAM6 | Carcinoembryonic antigen‐related cell adhesion molecule 6 | Signal transduction, cell‐cell signaling, cell adhesion |
| 0.12 | CTNNB1 | Catenin (cadherin‐associated pritein), beta 1, 88 kDa | Tumor suppressor, cell adhesion, oncogenesis |
| 0.12 | KRT19 | Keratin 19 | Structural constituent of cytoskeleton, differentiation |
| 0.13 | KRTHA3A | Keratin, hair, acidic, 3 A | Cell shape and cell size control |
| 0.13 | CEACAM3 | Carcinoembryonic antigen‐related cell adhesion molecule 3 | Tumor antigen, immune response, cell adhesion |
| 0.14 | I_966690 | Strong similarity to human HLA‐DRB4 | |
| 0.17 | S100A4 | S100 calcium binding protein A4 | Calcium ion binding, invasive growth |
| 0.20 | FOS | v‐fos FBJ murine osteosarcoma viral oncogene homolog | Transcription, methylation, cell growth, oncogenesis |
| 0.22 | DAF | Decay accelerating factor for complement (CD55) | Decay accelerating factor |
| 0.23 | MYC | v‐myc myelocytomatosis viral oncogene homolog (avian) | Transcription factor, cell cycle, pathogenesis |
| 0.24 | CRIP1 | Cysteine‐rich protein 1 (intestinal) | Zinc ion binding, cell proliferation |
| 0.24 | KRTHB6 | Keratin, hair, basic, 6 | Monilethrix |
Then, the expression levels of MMP1 and cathepsin L were confirmed at the protein level and compared with the expression levels of known metastasis‐associated genes (Table 4). Weak MMP1 protein expression was seen in 44As3 cells as well as 58As9 cells. The cathepsin L gene was expressed in HSC‐44PE cells, but even stronger expression was observed in the 44As3 cells (Fig. 3A,B). Intense expression of this gene was also seen in the metastatic cell line, 58As1 (Fig. 3C). Moderate expression of the cathepsin L gene was observed in 58As9 cells, whereas expression of this gene was totally absent in the parent cell line (Fig. 3D). Molecules whose expression levels differed markedly between the parent cell line and the 58As1 or 58As9 cells were dysadherin, CD44, integrin β4, EGFR (Fig. 3E,F), HGF, and VEGF (Fig. 3G,H). While dysadherin was not expressed in the HSC‐58 cells, it was expressed intensely in all the highly metastatic subclones (Fig. 3I,J). Intense expression of nm23 was also observed in highly metastatic cell lines, while Smad4 expression was not seen in these cell lines.
Table 4.
Expression of metastasis‐related genes in the highly metastatic and the parent gastric cancer cell lines
| Cell line | MMP‐ 1 | Cathepsin L | Cell adhesion | Oncogenes | Angiogenesis | nm23 | Smad4 | |||||||||||
|---|---|---|---|---|---|---|---|---|---|---|---|---|---|---|---|---|---|---|
| CD44 | E‐ cadherin | Dysadherin | β‐ catenin | Integrin α6β4 | EGFR | c‐erb‐ B‐2 | cript | c‐ met | HGF | bFGF | VEGF | IL‐ 6 | IL‐ 8 | |||||
| 44As3 | + | + + | + + a | + + | + + | + + | –– | + + | – | + | + | – | – | + | – | – | + + | – |
| HSC‐44PE | – | + | + + a | + + | + + | + + | – + + | + + | – | + | + | + | – | + | – | – | – | – |
| 58As1 | – | + + | + + | – | + + | + + | – + + | + | – | + | + + a | + + | + | + + | – | – | + + | – |
| 58As9 | + | + | + + | – | + + | + | – + | + + | – | + | + + a | + | + | + + | – | – | + | – |
| HSC‐58 | – | – | + | – | – | + + | –– | – | – | + | + + a | – | + | – | – | – | – | – |
Immunohistochemical staining was carried out as described in a previous study.( 8 )++, Moderate or strong staining intensity, or staining of > 75% of the cells; +, weak staining intensity, or staining of < 25% of the cells; –, negative staining, or staining of < 1% of the cells. a, gene amplification.
Figure 3.
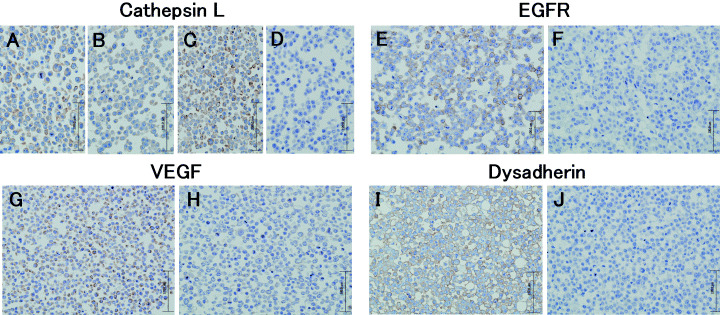
Immunohistochemical analyses of Cathepsin L, EGFR, VEGF and Dysadherin in the highly metastatic and the parent cell lines. The metastatic 44As3 (A) and 58As1 (C) expressed strongly detectable cathepsin L in the cytoplasm. Immunoreactivity for cathepsin L observed weakly at the cytoplasm in HSC‐44PE (B), but immunoreactivity completely absent from HSC‐58 (D). (E), Expression of EGER is observed in the membranes of the 58As1 subclone. (F), Immunoreactivity for EGER was completely absent from HSC‐58 cells. (G), Expression of VEGF is observed in the cytoplasm of the 58As9 cells, but immunoreactivity absent from HSC‐58 (H). (I), Expression of dysadherin is observed at the cell‐cell boundaries in 58As9 subclone. (J), Immunoreactivity for dysadherin was completely absent from HSC‐58 cells.
Usefulness of the model as a tumor metastasis model for the evaluation of drugs. All of the highly metastatic cell lines served as highly reproducible models of peritoneal dissemination, and a quantitative relationship was observed between the number of inoculated cells and the animal survival rate (incidence of tumor) (data not shown). Next we evaluated antitumor effects of antitumor agents in this model. We selected CPT‐11( 17 ) and GEM( 18 ) as representative cytotoxic agents. Figure 4A shows the survival curve of the 58As1 implanted mice treated with CPT‐11. Most of the animals belonging to the untreated control group died of extensive peritoneal dissemination approximately 30 days after the implantation. In the CPT‐11‐treated group (200 mg/kg/head), however, 60 days passed before the first animal death was noted. Thus, treatment with CPT‐11 significantly (P < 0.001, unpaired t‐test) prolonged the survival of the animals injected with the tumor cells, and dose‐dependency was evident when the data from multiple groups were compared. Similar results were also obtained for 44As3 cells (Fig. 4B). Figure 4(C) shows the results of the experiment in which GEM was administered intravenously following orthotopic inoculation of 58As1 cells. The survival period was significantly prolonged in the GEM‐treated group (100 mg/kg/head). Similar results were also obtained for mice implanted with the 44As3 cells (data not shown).
Figure 4.
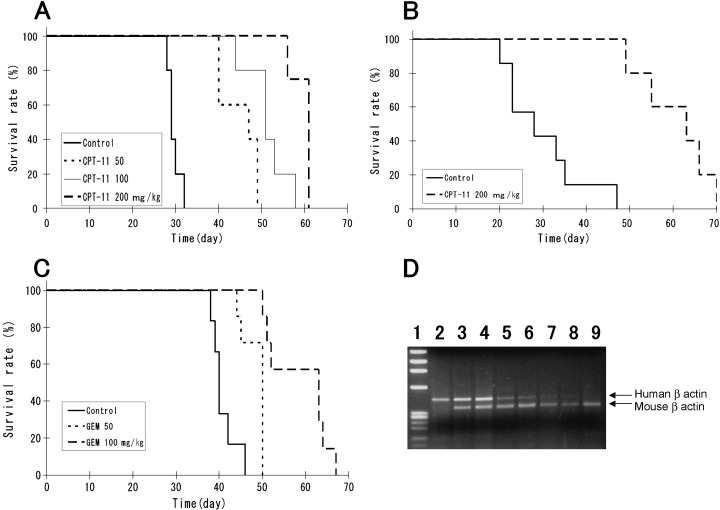
Effects of CPT‐11 and GEM in the peritoneal dissemination mouse model established using orthotopically implanted 44As3 or 58As1 cells. Mice receiving CPT‐11 or GEM, or vehicle alone as control, were monitored daily for the development of peritoneal dissemination. (A), Survival of 58As1‐tumor‐bearing mice after CPT‐11 treatment (n = 5; P < 0.001). This experiment was repeated thrice and similar results were observed each time. (B), Survival of 44As3‐tumor‐bearing mice after CPT‐11 treatment (n = 6; P < 0.001). (C), Survival of 58As1‐tumor‐bearing mice after GEM treatment (n = 7; P < 0.001). Similar results were obtained in two independent experiments. (D), CPT‐11 and GEM inhibit dissemination of cancer cells into the peritoneal cavity in vivo. RT‐PCR was performed on the disseminated cells isolated from the intraperitoneal lavage fluid (2 mL of PBS) using human‐specific and mouse‐specific primers against β‐actin. The total amount of RNA (200 ng) was equalized in all the samples. Lane 1, maker; lane 2, human gastric cell line HSC‐39; lanes 3 and 4, untreated control group; lanes 5 and 6, 200 mg/kg CPT‐11‐treated group; lanes 7 and 8, 100 mg/kg GEM‐treated group; lane 9, murine leukemia cell line P388.
To identify the stage of tumor metastasis suppressed by these agents, RT‐PCR analysis was performed with sets of primers specific for human and mouse β actin, respectively. Cells collected from the intraperitoneal lavage fluid 21 days after orthotopic implantation of 58As1 cells served as the samples. Autopsy examination revealed that there was no macroscopic tumor formation in the gastric wall of the drug‐treated animals, while peritoneal dissemination was noted in the untreated control group. Figure 4(D) shows two typical animals used for each experimental group. In the untreated control group, RT‐PCR product represents human‐derived β actin gene was clearly identified (lanes 3 and 4). In the CPT‐11‐ and GEM‐treated groups, however, the gene sequence of human origin was less clear (lanes 5, 6 and 7, 8, respectively). These results suggested that treatment with the agents reduced the number of cancer cells in the peritoneal cavity. It was also found that the drugs directly inhibited the growth of s.c. tumors following implantation of 58As1 and 44As3 cells (data not shown). From these results, it is considered highly likely that while the agents suppress metastasis of these tumor cells by suppressing tumor formation at the implanted site, the small number of tumor cells remaining within the peritoneal cavity gradually proliferate, making it difficult to obtain better therapeutic results than some prolongation of the survival period.
Discussion
In the present study, we isolated 44As3 cells from HSC‐44PE, and 58As1 and 58As9 cells from HSC‐58, and succeeded, in a reliable manner, in establishing a model in which peritoneal dissemination occurred from a primary lesion of gastric carcinoma. The 44As3, 58As1 and 58As9 sublines were generated by the conventional method, that is by selection of highly metastatic clones (found in small numbers among cancer cells showing poor metastatic potential) in vivo. ( 19 ) On the basis of a study using clinical samples for microarray analysis of primary and metastatic lesions, investigators recently suggested that primary cancers with a high metastatic potential may differ in nature from those having a poor metastatic potential.( 20 ) However, the results of our study support the conventional view that clones with a high metastatic potential contained in small amounts among the cancer tissues are responsible for the formation of metastatic lesions.
We consider that the establishment of this model is significant in the following respects: (i) it allows reproduction of all the steps in the development of cancerous peritonitis, from the stage of infiltrative growth of the tumor within the gastric mucosa to peritoneal dissemination and formation of ascites; (ii) it is an animal model of metastatic gastric cancer that closely resembles that in clinical cases; (iii) quantitative analysis is possible with this model, because it is established from cultured cells. The model is expected to be useful for the study of the continuity or association between infiltrative growth/peritoneal dissemination and gene expression, mechanism of formation of bloody ascites, and analysis of the microenvironmental factors influencing the development of the metastases. Comparison of the expression levels of the relevant genes among different cell lines with markedly varying metastatic potential may be expected to allow isolation of new molecules involved in the peritoneal dissemination of tumors. Furthermore, these sublines are also expected to contribute to advancement of the functional analysis of the involvement of the newly identified molecules in peritoneal dissemination.
Following recent advances in the comprehensive analysis of gene expression, it has been gradually revealed that gene expression patterns undergo complex alterations during the course of metastasis of gastric carcinoma.( 21 , 22 , 23 , 24 , 25 , 26 , 27 ) cDNA array analysis carried out using cell lines with varying metastatic potentials in the present study revealed altered expressions of numerous genes in these cells, including those involved in adhesion, proliferation and metabolism. Among others, markedly increased expression of the MMP1 gene( 27 , 28 ) was observed in 44As3 cells; however, the expression of MMP1 at the protein level was low in these cells, suggesting that MMP1 may not be closely involved in metastasis. Cathepsin L, involved in the degradation of the extracellular matrix,( 29 ) was intensely expressed in not only 44As3, but also 58As1 cells. This finding was confirmed by immunostaining. Intense cathepsin L expression was also seen in 58As9 cells. These results suggest that this molecule may be closely associated with the metastatic potential of these tumor cells. Meanwhile, it is known that invasion and metastasis of gastric cancer occur as a result of accumulation of changes in several genes.( 21 ) These include genes encoding cell adhesion‐related molecules (E‐cadherin,( 30 , 31 )β‐catenin,( 30 ) integrin α6β4,( 8 ) dysadherin,( 32 ) CD44,( 33 , 34 ) etc.), molecules associated with proliferation, loss of intercellular adhesion and matrix degradation (EGF, c‐erbB‐2,( 35 ) cript,( 36 ) etc.), motility‐associated molecules (HGF, c‐met,( 37 ) etc.), molecules associated with vascularization (VEGF,( 38 ) IL‐6,( 39 ) IL‐8,( 40 ) bFGF,( 41 ) etc.), a tumor metastasis suppressor gene (nm23)( 42 ) a gene associated with the malignant course of tumors (Smad),( 43 ) and so on. When the expression of these genes was analyzed, markedly increased expression of MMP1, cathepsin L and nm23 was observed in the highly metastatic 44As3 cell line as compared with that in the poorly metastatic parent cell line. Molecules expressed specifically in the highly metastatic cell lines 58As1 and 58As9 included cathepsin L, dysadherin, CD44, integrin β4, EGFR, HGF and VEGF. Although these molecules seemed to be closely related to peritoneal dissemination of gastric carcinoma, it would be desirable to determine the exact causal relationship between these molecules and tumor metastasis using in vivo models. Nonetheless, our results suggest that: (i) there may be multiple pathways involving different molecules for the apparently single process of tumor metastasis, and (ii) the genes contributing to the metastatic potential of tumor cells may differ between the parent cells and the clones selectively isolated from it.
As stated, the presence of peritoneal metastasis represents an advanced stage of cancer associated with a poor prognosis, and no effective therapy for this condition is available as yet. It is therefore important to devise a new therapeutic strategy based on the aforementioned novel viewpoints. One such strategy that has been discussed is the development of anticancer agents based on molecular targeting. To seek such agents, a model allowing appropriate evaluation of drugs is essential, and models to be used for drug evaluation in vivo need to satisfy the following six requirements: (i) the tumor should undergo proliferation, spread, dissemination and metastasis akin to those seen in clinical cases; (ii) the tumor cell survival rate in the gastric wall following orthotopic implantation should be 100%; (iii) the frequency of metastasis should be 90–100%; (iv) the model should be highly reproducible; (v) the interindividual variance should be small, to allow easy comparison among different test groups; (vi) application to experiments using many animals should be relatively easy. When the animal model of peritoneal dissemination established in this study was evaluated according to these criteria, all the three highly metastatic cell lines established satisfied all of these six requirements. We evaluated the antitumor activities of two antitumor agents (CPT‐11( 17 ) and GEM( 18 )) using the animal models implanted with 58As1 and 44As3 cells. Treatment with these agents suppressed the proliferation and spread of the tumor and significantly prolonged the survival of the animals. For each of the cases studied, a dose‐response relationship was observed, and the experiments were highly reproducible. Another advantage of this animal model is that the length of time from implantation to tumor formation is short (causing death within 40 days); this feature may be expected to contribute to shortening of the evaluation period. The advantages of this model may prove to be useful for the development of drugs based on molecular targeting.
In the past, no approach was known for isolation of host factors involved in the cascade of tumor proliferation in the primary lesion to formation of ascites, or for the functional analysis of this cascade (e.g. analysis of interactions). The model established in the present study is expected to contribute greatly to the advancement of studies in these fields and in other applied research.
Acknowledgments
We are grateful to Dr A. Ochiai (Pathology Division, National Cancer Center Research Institute East) for fruitful discussions. This study was supported in part by a Grant‐in‐Aid for Cancer Research from the Ministry of Health, Labor and Welfare of Japan.
References
- 1. Japanese Gastric Cancer Association. Japanese Classification of Gastric Carcinoma – 2nd English Edition. Gastric Cancer 1998; 1: 10–24. [DOI] [PubMed] [Google Scholar]
- 2. Tahara E. Endocrine tumors of the gastrointestinal tract: classification, function and biological behavior. In: Watanabe S, Wolff M, Sommers SC, eds. Digestive Disease Pathology. Philadelphia: Field andWood, 1988;. 121–47. [Google Scholar]
- 3. Fenoglio‐preier C, Carneiro F, Correa P et al. Gastric carcinoma. In: Hamilton SR, Aaltonen LA, eds. World Health Organization Classification of Tumours. Pathology and Genetics of Tumours of the Digestive System. Lyon: IARC Press, 2000; 37–52. [Google Scholar]
- 4. Maruyama K. Results of surgery correlated with staging. In: Preece PE, Cuschieri A, Wellwood JM, eds. Cancer of the Stomach. Orlando: Grune and Stratton, 1986; 145–63. [Google Scholar]
- 5. Moriguchi S, Maehara Y, Korenaga D, Sugimachi K, Nose Y. Risk factors which predict pattern of recurrence after curative surgery for patients with advanced gastric cancer. Surg Oncol 1992; 1: 341–6. [DOI] [PubMed] [Google Scholar]
- 6. Yashiro M, Chung YS, Nishimura S, Inoue T, Sowa M. Peritoneal metastatic model for human scirrhous gastric carcinoma in nude mice. Clin Exp Metastasis 1996; 14: 43–54. [DOI] [PubMed] [Google Scholar]
- 7. Fujita S, Suzuki H, Kinoshita M, Hirohashi S. Inhibition of cell attachment, invasion and metastasis of human carcinoma cells by anti‐integrin β1 subunit antibody. Jpn J Cancer Res 1992; 83: 1317–26. [DOI] [PMC free article] [PubMed] [Google Scholar]
- 8. Ishii Y, Ochiai A, Yamada T et al. Integrin α6β4 as a suppressor and a predictive marker for peritoneal dissemination in human gastric cancer. Gastroenterology 2000; 118: 497–506. [DOI] [PubMed] [Google Scholar]
- 9. Kotanagi H, Saito Y, Shinozawa N, Koyama K. Establishment of a human cancer cell line with high potential for peritoneal dissemination. J Gastroenterol 1995; 30: 437–8. [DOI] [PubMed] [Google Scholar]
- 10. Kaneko K, Yano M, Tsujinaka T et al. Establishment of a visible peritoneal micrometastatic model from a gastric adenocarcinoma cell line by green fluorescent protein. Int J Oncol 2000; 16: 893–8. [DOI] [PubMed] [Google Scholar]
- 11. Yanagihara K, Seyama T, Tsumuraya M, Kamada N, Yokoro K. Establishment and characterization of human signet ring cell gastric carcinoma cell lines with amplification of the c‐myc oncogene. Cancer Res 1991; 51: 381–6. [PubMed] [Google Scholar]
- 12. Yanagihara K, Kamada N, Tsumuraya M, Amano F. Establishment and characterization of a human gastric scirrhous carcinoma cell line in serum‐free chemically defined medium. Int J Cancer 1993; 54: 200–7. [DOI] [PubMed] [Google Scholar]
- 13. Yanagihara K, Ito A, Toge T, Numoto M. Antiproliferative effects of isoflavones on human cancer cell lines established from the gastrointestinal tract. Cancer Res 1993; 53: 5815–21. [PubMed] [Google Scholar]
- 14. Yanagihara K, Tanaka H, Takigahira M et al. Establishment of two cell lines from human gastric scirrhous carcinoma that possess the potential to metastasize spontaneously in nude mice. Cancer Sci 2004; 95: 575–82. [DOI] [PMC free article] [PubMed] [Google Scholar]
- 15. Luo L, Salunga RC, Guo H et al. Gene expression profiles of laser‐captured adjacent neuronal subtypes. Nat Med 1999; 5: 117–22. [DOI] [PubMed] [Google Scholar]
- 16. Hughes TR, Mao M, Jones AR et al. Expression profiling using microarrays fabricated by an ink‐jet oligonucleotide synthesizer. Nat Biotechnol 2001; 19: 342–7. [DOI] [PubMed] [Google Scholar]
- 17. Kanzawa F, Saijo N. In vitro interaction between gemcitabine and other anticancer drugs using a novel three‐dimensional model. Semin Oncol 1997; 24: S7–8–S7–16. [PubMed] [Google Scholar]
- 18. Saijo N. Preclinical and clinical trials of topoisomerase inhibitors. Ann N Y Acad Sci 2000; 922: 92–9. [DOI] [PubMed] [Google Scholar]
- 19. Fidler IJ. Rationale and methods for the use of nude mice to study the biology and therapy of human cancer metastasis. Cancer Metast Rev 1986; 5: 29–49. [DOI] [PubMed] [Google Scholar]
- 20. Ramaswamy S, Ross KN, Lander ES, Golub TR. A molecular signature of metastasis in primary solid tumors. Nat Genet 2003; 33: 49–54. [DOI] [PubMed] [Google Scholar]
- 21. Yokozaki H, Yasui W, Tahara E. Genetic and epigenetic changes in stomach cancer. Int Rev Cytol 2001; 204: 49–95. [DOI] [PubMed] [Google Scholar]
- 22. Yasui W, Oue N, Ito R, Kuraoka K, Nakayama H. Search for new biomarkers of gastric cancer through serial analysis of gene expression and its clinical implications. Cancer Sci 2004; 95: 385–92. [DOI] [PMC free article] [PubMed] [Google Scholar]
- 23. Hippo Y, Yashiro M, Ishii M et al. Differential gene expression profiles of scirrhous gastric cancer cells with high metastatic potential to peritoneum or lymph nodes. Cancer Res 2001; 61: 889–95. [PubMed] [Google Scholar]
- 24. Hippo Y, Taniguchi H, Tsutsumi S et al. Global gene expression analysis of gastric cancer by oligonucleotide microarrays. Cancer Res 2002; 62: 233–40. [PubMed] [Google Scholar]
- 25. Hasegawa S, Furukawa Y, Li M et al. Genome‐wide analysis of gene expression in intestinal‐type gastric cancers using a complementary DNA microarray representing 23 040 genes. Cancer Res 2002; 62: 7012–7. [PubMed] [Google Scholar]
- 26. Weiss MM, Kuipers EJ, Postma C et al. Genomic profiling of gastric cancer predicts lymph node status and survival. Oncogene 2003; 22: 1872–9. [DOI] [PubMed] [Google Scholar]
- 27. Inoue T, Yashiro M, Nishimura S et al. Matrix metalloproteinase‐1 expression is a prognostic factor for patients with advanced gastric cancer. Int J Mol Med 1999; 4: 73–7. [DOI] [PubMed] [Google Scholar]
- 28. Sakurai Y, Otani Y, Kameyama K et al. Therole of stromal cells in the expression of interstitial collagenase (matrix metalloproteinase‐1) in the invasion of gastric cancer. J Surg Oncol 1997; 66: 168–72. [DOI] [PubMed] [Google Scholar]
- 29. Dohchin A, Suzuki JI, Seki H, Masutani M, Shiroto H, Kawakami Y. Immunostained cathepsins B and L correlate with depth of invasion and different metastatic pathways in early stage gastric carcinoma. Cancer 2000; 89: 482–7. [PubMed] [Google Scholar]
- 30. Hirohashi S. Inactivation of the E‐cadherin‐mediated cell adhesion system in human cancers. Am J Pathol 1998; 153: 333–9. [DOI] [PMC free article] [PubMed] [Google Scholar]
- 31. Behrens J, Mareel MM, Van Roy FM, Birchmeier W. Dissecting tumor cell invasion: epithelial cells acquire invasive; properties after the loss of uvomorulin‐mediated cell‐cell adhesion. J Cell Biol 1989; 108: 2435–47. [DOI] [PMC free article] [PubMed] [Google Scholar]
- 32. Ino Y, Gotoh M, Sakamoto M, Tsukagoshi K, Hirohashi S. Dysadherin, a cancer‐associated cell membrane glycoprotein, down‐regulated E‐cadherin and promotes metastasis. Proc Natl Acad Sci USA 2002; 99: 365–70. [DOI] [PMC free article] [PubMed] [Google Scholar]
- 33. Yokozaki H, Ito R, Nakayama H, Kuniyasu H, Taniyama K, Tahara E. Expression of CD44 abnormal transcripts in human gastric carcinomas. Cancer Lett 1994; 83: 229–34. [DOI] [PubMed] [Google Scholar]
- 34. Nishimura S, Chung YS, Yashiro M, Inoue T, Sowa M. CD44H plays an important role in peritoneal dissemination of scirrhous gastric cancer cells. Jpn J Cancer Res 1996; 87: 1235–44. [DOI] [PMC free article] [PubMed] [Google Scholar]
- 35. Tsugawa K, Yonemura Y, Hirono Y et al. Amplification of the c‐met, c‐erbB‐2 and epidermal growth factor receptor gene in human gastric cancers: correlation to clinical features. Oncology 1998; 55: 475–81. [DOI] [PubMed] [Google Scholar]
- 36. Kunuyasu H, Yoshida K, Yokozaki H et al. Expression of cript, a novel gene of the epidermal growth factor family, in human gastrointestinal carcinomas. Jpn J Cancer Res 1991; 82: 969–73. [DOI] [PMC free article] [PubMed] [Google Scholar]
- 37. Kunuyasu H, Yasui W, Yokozaki H, Kitadai Y, Tahara E. Aberrant expression of c‐met mRNA in human gastric carcinomas. Int J Cancer 1993; 55: 72–5. [DOI] [PubMed] [Google Scholar]
- 38. Takahashi Y, Cleary KR, Mai M, Kitadai Y, Bucana CD, Ellis LM. Significance of vessel count and vascular endothelial growth factor and its receptor (KDR) in intestinal‐type gastric cancer. Clin Cancer Res 1986; 2: 1679–84. [PubMed] [Google Scholar]
- 39. Huang SP, Wu MS, Wang HP, Yang PS, Kuo ML, Lin JT. Correlation between serum levels of interleukin‐6 and vascular endothelial growth factor in gastric carcinoma. J Gastroenterol Hepatol 2002; 17: 1165–9. [DOI] [PubMed] [Google Scholar]
- 40. Kitadai Y, Haruma K, Sumii K et al. Regulation of angiogenesis in human gastric carcinomas by interleukin‐8. Am J Pathol 1998; 152: 93–100. [PMC free article] [PubMed] [Google Scholar]
- 41. Ueki T, Koji T, Tamiya S, Nakane PK, Tsuneyoshi M. Expression of basic fibroblast growth factor and fibroblast growth factor in advanced gastric carcinoma. J Pathol 1995; 177: 353–61. [DOI] [PubMed] [Google Scholar]
- 42. Nakayama H, Yasui W, Yokozaki H, Tahara E. Reduced expression of nm23 is associated with metastasis of human gastric carcinomas. Jpn J Cancer Res 1993; 84: 184–90. [DOI] [PMC free article] [PubMed] [Google Scholar]
- 43. Ijichi H, Ikenoue T, Kato N et al. Systemic analysis of the TGF‐beta‐smad signaling pathway in gastrointestinal cancer cells. Biochem Biophys Res Commun 2001; 289: 350–7. [DOI] [PubMed] [Google Scholar]