Abstract
A number of tumor suppressor and tumor‐related genes are silenced by promoter hypermethylation in gastric cancer. Hypermethylation is not restricted to cancer cells, but is also present in non‐neoplastic cells during aging. Such age‐related methylation in non‐neoplastic gastric epithelia is postulated to constitute a field defect that increases the risk for development of gastric cancer. To quantitatively evaluate age‐related methylation in non‐neoplastic gastric epithelia, we used a fiber‐type DNA microarray on which methylated and unmethylated sequence probes were mounted. After bisulfite modification, a part of the promoter CpG island of four tumor suppressor genes, lysyl oxidase (LOX), p16, RUNX3 and tazarotene‐induced gene 1 (TIG1), were amplified by PCR using Cy5 end labeled primers. Methylation rates (MRs) were calculated as the ratio of the fluorescence intensity of a methylated sequence probe to the total fluorescence intensity of methylated and unmethylated probes. Non‐neoplastic gastric mucosa was obtained from 24 non‐cancer‐bearing stomachs at autopsy. MRs ranged from 0.0% to 77.2% (mean, 15.8%) for LOX, 0.0% to 45.8% (mean, 10.0%) for p16, 0.0% to 83.8% (mean, 9.0%) for RUNX3, and 0.0% to 46.1% (mean, 6.6%) for TIG1, and significantly correlated with aging (P < 0.01). The regression curves were: y = 0.013x2 − 0.6184x + 4.0512, R 2 = 0.5728 (P < 0.001) for LOX; y = 0.0107x2 − 0.6055x + 5.2943, R 2 = 0.7891 (P < 0.00001) for p16; y = 0.0182x2 − 1.2234x + 11.566, R 2 = 0.5595 (P < 0.001) for RUNX3; and y = 0.0068x2 − 0.3586x + 2.4306, R 2 = 0.4670 (P < 0.01) for TIG1. Thus, our present results are consistent with the notion that age‐related methylation is associated with cancer susceptibility in the elderly. Quantitative analysis of DNA methylation using DNA microarrays is a promising method for risk assessment in the development of gastric cancer. (Cancer Sci 2006; 97: 1155–1158)
Abbreviations:
- CCD
charge coupled device
- LOX
lysyl oxidase
- MR
methylation rate
- PCR
polymerase chain reaction
- SDS
sodium dodecyl sulfate
- SSC
saline‐sodium citrate solution
- TIG1
tazarotene‐induced gene 1.
Epigenetic inactivation of tumor suppressor and tumor‐related genes plays a major role in human carcinogenesis.( 1 ) Hypermethylation of these genes is not restricted to neoplastic cells but is also present in non‐neoplastic cells during aging.( 2 , 3 , 4 ) We previously reported that tumor suppressor and tumor‐related genes, i.e. APC, DAP‐kinase, E‐cadherin, GSTP1, hMLH1, p16, RASSF1A and RUNX3, are generally unmethylated in various non‐neoplastic tissues obtained from young individuals, but become increasingly methylated in a tissue‐specific manner in the elderly (Waki et al. 2003).( 4 ) This increased level of methylation is considered to be associated with a higher level of cancer susceptibility in the elderly.( 2 , 3 , 4 ) While methylation is accelerated by chronic inflammation and possibly by diet and genetic predisposition, the mechanism of age‐related methylation is unknown.( 1 )
A number of tumor suppressor and tumor‐related genes are silenced by promoter hypermethylation in gastric cancer, and less frequently in non‐neoplastic gastric epithelia.( 5 , 6 ) During gastric carcinogenesis, hypermethylation is initially found in the outermost 5′‐ and 3′ regions of CpG islands in non‐neoplastic gastric epithelia. Methylation gradually approaches the transcription start site and shuts down gene expression, ultimately constituting a field defect that places tissues at increased risk for the development of gastric cancer.( 7 , 8 ) Therefore, quantitative determination of hypermethylation in a particular genomic region in non‐neoplastic gastric epithelia may be useful in the risk assessment of gastric cancer. This study was undertaken to quantitatively evaluate the age‐related methylation of several tumor suppressor genes in non‐neoplastic gastric epithelia from autopsies using a DNA microarray. Lysyl oxidase (LOX),( 9 ) p16, ( 10 ) RUNX3 ( 11 ) and tazarotene‐induced gene 1 (TIG1)( 12 ) were selected from among a number of tumor suppressor and tumor‐related genes silenced by promoter hypermethylation in gastric cancer because these genes could be clearly amplified by a single multiplex PCR.
Materials and Methods
Samples and controls. Twenty‐four samples of non‐neoplastic gastric epithelia were obtained from the lower stomach of 24 autopsies. Past and present gastric cancer patients were excluded. Samples were obtained from 15 males and nine females, ranging in age from 0 to 87 years (mean age, 52.5 years; one stillborn infant was counted as 0 years). They were stored at −80°C until DNA was extracted using a SepaGene Kit (Sankyo Junyaku, Tokyo, Japan). Control DNAs with varying methylation rates (0%, 25%, 50%, 75% and 100%) were prepared by mixing CpGenome Universal Methylated DNA (completely methylated) and CpGenome Universal Unmethylated DNA (completely unmethylated) (CHEMICON International, Temecula, CA).
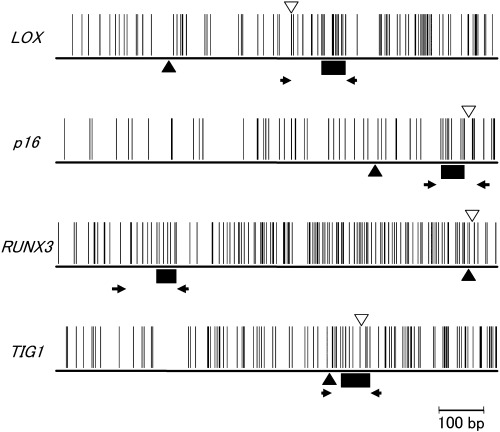
Bisulfite modification, multiplex PCR and strandase treatment. One microgram of control or sample DNA was denatured by treatment with NaOH and modified with sodium bisulfite using the CpGenome DNA modification Kit (CHEMICON International). Modified DNA was eluted with 20 µL of TE Buffer, pH 7.0 (Ambion, Austin, TX), and filtrated with Ultrafree‐MC centrifugal filter UFC30GV0S (Millipore, Carrightwohill, Co. Cork, Ireland). PCR was performed in a GeneAmp 9700 thermal cycler (PE Applied Biosystems, Foster City, CA) using the QIAGEN Multiplex PCR Kit (Qiagen, Tokyo, Japan) in a 50 µL reaction according to the manufacturer's protocol. An initial denaturation at 94°C for 10 min was followed by 50 cycles of amplification. Each of the first 10 cycles consisted of denaturation at 94°C for 30 s, annealing at 55°C for 60 s, and extension at 72°C for 30 s. Each of the remaining 40 cycles consisted of denaturation at 94°C for 30 s, annealing at 60°C for 60 s and extension at 72°C for 30 s. A final extension for 5 min at 72°C was then performed. The following primer sets were used: 5′‐cy5‐GGT TAA TTT GGT AAA AGG AGT GAT G‐3′ and 5′‐p‐TTA TTC TCC CAT TAA ATC TAC TAA C‐3′ (176 bp) for LOX; 5′‐cy5‐AGA AAG AGG AGG GGT TGG TTG GTT ATT AGA‐3′ and 5′‐p‐CAA CCA ATC AAC CIA AAA CTC CAT ACT ACT‐3′ (152 bp) for p16; 5′‐cy5‐GGG TAA ATG TTA GAA ATT TGT TTA GAA‐3′ and 5′‐p‐TTA CAA AAA TCA CAA ACC CIA AAC AAC AAA AAC T‐3′ (176 bp) for RUNX3; 5′‐cy5‐TGG GTT IGG ATT AGG GAG TAG GTA G‐3′ and 5′‐p‐AAA AAC CCA CCA CIA CCT TAT TTC C‐3′ (139 bp) for TIG1 (Fig. 1). The forward primer was end‐labeled with Cy5 and the reverse primer with phosphate. Each primer pair was designed to simultaneously amplify both methylated and unmethylated DNA by precluding internal CpG sequences within the primers themselves. The PCR products were purified using the MinElute PCR Purification Kit (Qiagen). After purification, PCR products were treated with Strandase using the Novagen Strandase Kit (Darmstadt, Germany). A mixture of 9 µL of product, 2 µL of 10× buffer, 4 µL of Strandase and 5 µL of distilled water was incubated at 37°C for 20 min, followed by 75°C for 10 min. The Strandase‐treated products were then purified with a MinElute PCR Purification Kit (Qiagen). Concentrations were determined by UV absorbance, after which the samples were diluted to 5 ng/µL with distilled water.
Figure 1.

Locations of the primers ( ) and probes (▪) for microarray analysis, and transcriptional start sites (▴) and start codons (▿). A vertical bar indicates a CpG site.
DNA microarray hybridization. Purified PCR product (16 µL) was suspended in a hybridization solution (5 µL of 20× SSC, 1 µL of 20% SDS and 78 µL of distilled water), denatured at 94°C for 2 min and hybridized to the probes on a GenoPalTM microarray (Mitsubishi Rayon Co., Ltd, Tokyo, Japan) at 65°C for 16 h in a hybridization chamber (Mitsubishi Rayon Co., Ltd). The microarray was rinsed and washed with a solution of 0.5× SSC at 70°C for 60 min, and put in 0.5× SSC at room temperature. The microarray was scanned and the image was captured with a cooled CCD Microarray Image Analyzer (Mitsubishi Rayon Co., Ltd). The following probes were mounted on the microarray: 5′‐GCC AAA CGC CCG AAA CCG CCG ACG ACT CGC GCG AAA ACT ACT ATT AAC CGA CGA CG‐3′ for methylated and 5′‐ACC AAA CAC CCA AAA CCA CCA ACA ACT CAC ACA AAA ACT ACT ATT AAC CAA CAA CA‐3′ for unmethylated LOX (AF270645, nt 18 102–18 157); 5′‐GCC GCC CGC TAC CTA CTC TAC CCC TCT CCG CAA CCG CCG AAC GCA CTC GAT CCG‐3′ for methylated and 5′‐ACC ACC CAC TAC CTA CTC TAC CCC TCT CCA CAA CCA CCA AAC ACA CTC AAT CCA‐3′ for unmethylated p16 (X94154, nt 1148–1201); 5′‐GCC CCA ACG TCA AAA AAC TAC GAC CCG AAA AAA AAC GAC AAA AAC GCC TTC CGT AAA ACC CGA ACG‐3′ for methylated and 5′‐ACC CCA ACA TCA AAA AAC TAC AAC CCA AAA AAA AAC AAC AAA AAC ACC TTC CAT AAA ACC CAA ACA‐3′ for unmethylated RUNX3 (AL023096, nt 65 588–65 653); and 5′‐GCT CCG AAC CCG TAT CTA TCG AAT ACC GAA CCA ACT TTC CTA CGT CCA TAC AAC CCC GCC GAC AAC G‐3′ for methylated and 5′‐ACT CCA AAC CCA TAT CTA TCA AAT ACC AAA CCA ACT TTC CTA CAT CCA TAC AAC CCC ACC AAC AAC A‐3′ for unmethylated TIG1 (AC080013, nt 66 290–66 356) (Fig. 1). The probes locate within CpG islands where methylation had been shown to be correlative with gene silencing.( 8 , 9 , 10 , 11 )
Results
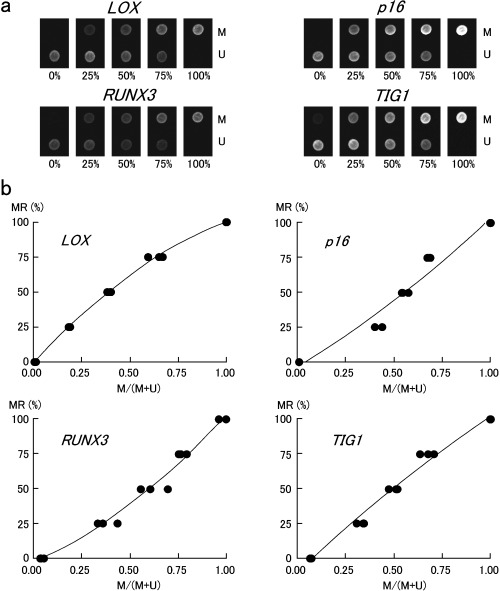
Standardization curves. Control DNA samples with different amounts of methylation (0%, 25%, 50%, 75%, and 100%) were hybridized to GenoPalTM arrays. Standardization curves were obtained from the ratio of fluorescence intensity of methylated sequence probe to the total fluorescence intensity of methylated and unmethylated sequence probes, M/(M + U): LOX, y = −49.256x2 + 150.4x − 1.0847, R 2 = 0.9985; p16, y = 24.965x2 + 81.528x − 2.9098, R 2 = 0.9617; RUNX3, y = 44.245x2 + 61.71x − 2.8558, R 2 = 0.984; and TIG1, y = −20.932x2 + 133.9x − 11.113, R 2 = 0.9852 (Fig. 2).
Figure 2.

(a) Microarray images of control DNAs with methylation rates of 0%, 25%, 50%, 75% and 100%. M, methylated sequence probe; and U, unmethylated sequence probe. Three replicates of the experiment were used to create standard curves. (b) Standard curves were obtained from LOX, y = −49.256x2 + 150.4x − 1.0847, R 2 = 0.9985; p16, y = 24.965x2 + 81.528x − 2.9098, R 2 = 0.9617; RUNX3, y = 44.245x2 + 61.71x − 2.8558, R 2 = 0.984; and TIG1, y = −20.932x2 + 133.9x − 11.113, R 2 = 0.9852.
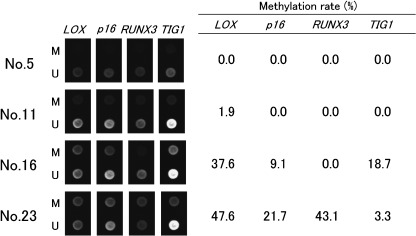
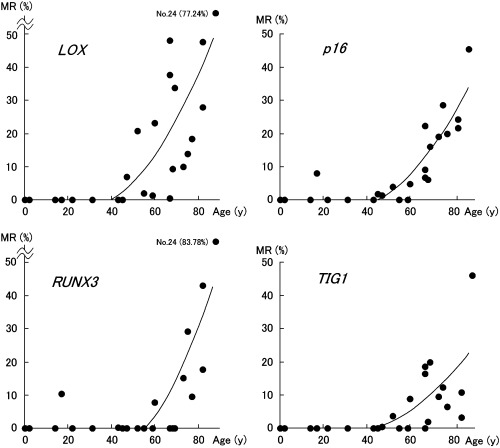
Methylation rates in non‐neoplastic gastric epithelia. Methylation rates (MRs) of LOX, p16, RUNX3 and TIG1 in non‐neoplastic gastric epithelia are listed in Table 1, and examples of microarray image are shown in Fig. 3. MRs ranged from 0.0% to 77.2% (mean, 15.8%) for LOX, 0.0% to 45.8% (mean, 10.0%) for p16, 0.0% to 83.8 (mean, 9.0%) for RUNX3, and 0.0% to 46.1% (mean, 6.6%) for TIG1. The MR of each gene was positively correlated with aging (P < 0.01 by Spearman's rank correlation test). The polynomial regression curves were represented by the following equations: LOX, y = 0.013x2 − 0.6184x + 4.0512, R 2 = 0.5728, P < 0.001; p16, y = 0.0107x2 − 0.6055x + 5.2943, R 2 = 0.7891, P < 0.00001; RUNX3, y = 0.0182x2 − 1.2234x + 11.566, R 2 = 0.5595, P < 0.001; and TIG 1, y = 0.0068x2 − 0.3586x + 2.4306, R 2 = 0.4670, P < 0.01 (Fig. 4).
Table 1.
Methylation rates in non‐nepolastic gastric epithelia
| No. | Age (years) | Sex | Cause of death | Methylation rate (%) | |||
|---|---|---|---|---|---|---|---|
| LOX | p16 | RUNX3 | TIG1 | ||||
| 1 | 0 | m | Stillborn | 0.0 | 0.0 | 0.0 | 0.0 |
| 2 | 2 | m | Myocarditis | 0.0 | 0.0 | 0.0 | 0.0 |
| 3 | 14 | m | Rhabdomyosarcoma | 0.0 | 0.0 | 0.0 | 0.0 |
| 4 | 17 | m | Acute lymphocytic leukemia | 0.0 | 8.0 | 10.3 | 0.0 |
| 5 | 22 | m | Brain tumor | 0.0 | 0.0 | 0.0 | 0.0 |
| 6 | 31 | f | Cerebral infarction | 0.0 | 0.0 | 0.0 | 0.0 |
| 7 | 43 | m | Hodgkin's disease | 0.0 | 0.0 | 0.1 | 0.0 |
| 8 | 45 | m | Hepatocellular carcinoma | 0.0 | 1.8 | 0.0 | 0.0 |
| 9 | 47 | m | Brain tumor | 7.0 | 1.3 | 0.0 | 0.4 |
| 10 | 52 | f | Cerebral infarction | 20.8 | 3.8 | 0.0 | 3.6 |
| 11 | 55 | m | Rectal cancer | 1.9 | 0.0 | 0.0 | 0.0 |
| 12 | 59 | m | Rectal cancer | 1.4 | 0.0 | 0.0 | 0.0 |
| 13 | 60 | f | Lung cancer | 23.2 | 4.7 | 7.9 | 8.9 |
| 14 | 67 | m | Epidural hematoma | 48.0 | 22.2 | 0.0 | 16.4 |
| 15 | 67 | f | Multiorgan failure | 0.5 | 6.7 | 0.0 | 0.0 |
| 16 | 67 | m | Pancreatic cancer | 37.6 | 9.1 | 0.0 | 18.7 |
| 17 | 68 | f | Ovarian cancer | 9.4 | 6.0 | 0.0 | 2.0 |
| 18 | 69 | f | Ovarian cancer | 33.8 | 15.9 | 0.0 | 20.0 |
| 19 | 73 | f | Malignant lymphoma | 9.9 | 19.1 | 15.2 | 9.6 |
| 20 | 75 | f | Sepsis | 13.8 | 28.6 | 29.3 | 12.4 |
| 21 | 77 | m | Lung cancer | 18.4 | 20.0 | 9.5 | 6.6 |
| 22 | 82 | m | Sepsis | 27.9 | 24.3 | 17.6 | 10.9 |
| 23 | 82 | m | Parkinson's disease | 47.6 | 21.7 | 43.1 | 3.3 |
| 24 | 87 | f | Lung cancer | 77.2 | 45.6 | 83.8 | 46.1 |
f, female; m, male.
Figure 3.

Representative microarray images and methylation rates of sample DNAs. M, methylated sequence probe; and U, unmethylated sequence probe.
Figure 4.

Regression curves: LOX, y = 0.013x2 − 0.6184x + 4.0512, R 2 = 0.5728, P < 0.001; p16, y = 0.0107x2 − 0.6055x + 5.2943, R 2 = 0.7891, P < 0.00001; RUNX3, y = 0.0182x2 − 1.2234x + 11.566, R 2 = 0.5595, P < 0.001; and TIG 1, y = 0.0068x2 − 0.3586x + 2.4306, R 2 = 0.4670, P < 0.01.
Discussion
A microarray‐based assay was recently developed for the quantitative evaluation of RUNX3 methylation.( 13 ) The analysis of RUNX3 revealed that a high‐level of methylation (MR > 30%) was cancer‐specific, occurring only in gastric cancers. However, there was evidence that an increased level of methylation in non‐neoplastic gastric epithelia might be a risk factor for gastric cancer evolution. In our previous study,( 5 ) methylation of p16 and hMLH1 was more frequent in non‐neoplastic gastric epithelia of gastric cancer patients than those of non‐gastric cancer individuals. To further investigate this phenomenon, this study extended the microarray‐based assay to the simultaneous analysis of multiple tumor suppressor genes with the use of multiplex PCR. The gastric epithelia of two of the three patients over the age of 80 years showed a high‐level (MR > 30%) of RUNX3 methylation. None of those under 80 years of age had gastric epithelia with a comparable level of methylation. Similar trends were also observed for LOX, p16 and TIG1, with the MR of each gene significantly correlated with aging (P < 0.01). Only one patient (No. 4) under 40 years of age showed an increased methylation level in any of the genes. Because multiple genes are aberrantly methylated in lymphocytic leukemia,( 14 ) leukemic cells may have been present in his tissue sample, although this possibility could not be confirmed by histological examination. The four regression curves from the microarray analysis were very similar, and a general increase in the methylation of multiple tumor suppressor genes appeared between 50 and 60 years of age. These data are well correlated with the finding that gastric cancer incidence and mortality increase with age, and that this tendency is more prevalent after the ages of 50 or 60.( 15 ) Thus, the results of this study are consistent with the notion that age‐related methylation is associated with cancer susceptibility in the elderly. It is possible that age‐related methylation might be influenced by Helicobacter pylori infection,( 16 ) because the prevalence of Helicobacter pylori infection was higher in the elderly.( 17 )
Another consequence of this set of experiments was the discovery of the general utility of the microarray‐based methylation assay. This study set out to investigate the methylation levels of four tumor suppressor genes using a single multiplex PCR. To this end, four pairs of methylated and unmethylated sequence‐specific probes were mounted on a microarray. If several multiplexed PCRs are used, up to 50 genes can be analyzed simultaneously. An age‐matched control study of MRs in non‐neoplastic gastric epithelia of gastric cancer patients and non‐gastric cancer individuals will set a standard for risk assessment. The construction and use of such an array could ultimately be used to facilitate cancer risk assessment, the biological characterization of tumors, and more accurate prognosis prediction.
Acknowledgments
This work was supported in part by a Grant‐in‐Aid for Cancer Research (15–20) from the Ministry of Health, Labour and Welfare, and a Grant‐in‐Aid for Cancer Research (The 37th) from the Foundation for Promotion of Cancer Research, Japan.
This project has been funded in part with federal funds from the National Cancer Institute, National Institutes of Health, under Contract No. NO1‐CO‐12400. The content of this publication does not necessarily reflect the views or policies of the Department of Health and Human Services, nor does mention of trade names, commercial products, or organization imply endorsement by the U.S. Government.
References
- 1. Toyota M, Issa JP. The role of DNA hypermethylation in human neoplasia. Electrophoresis 2000; 21: 329–33. [DOI] [PubMed] [Google Scholar]
- 2. Ahuja N, Li Q, Mohan AL, Baylin SB, Issa JP. Aging and DNA methylation in colorectal mucosa and cancer. Cancer Res 1998; 58: 5489–94. [PubMed] [Google Scholar]
- 3. Issa JP. CpG‐island methylation in aging and cancer. Curr Top Microbiol Immunol 2000; 249: 101–18. [DOI] [PubMed] [Google Scholar]
- 4. Waki T, Tamura G, Sato M, Motoyama T. Age‐related methylation of tumor suppressor and tumor‐related genes: an analysis of autopsy samples. Oncogene 2003; 22: 4128–33. [DOI] [PubMed] [Google Scholar]
- 5. Tamura G. Promoter methylation status of tumor suppressor and tumor‐related genes in neoplastic and non‐neoplastic gastric epithelia. Histol Histopathol 2004; 19: 221–8. [DOI] [PubMed] [Google Scholar]
- 6. Tamura G. Alterations of tumor suppressor and tumor‐related genes in the development and progression of gastric cancer. World J Gastroenterol 2006; 12: 192–8. [DOI] [PMC free article] [PubMed] [Google Scholar]
- 7. Endoh M, Tamura G, Honda T et al. RASSF2, a potential tumour suppressor, is silenced by CpG island hypermethylation in gastric cancer. Br J Cancer 2005; 93: 1395–9. [DOI] [PMC free article] [PubMed] [Google Scholar]
- 8. Homma N, Tamura G, Honda T et al. Spreading of methylation within RUNX3 CpG island in gastric cancer. Cancer Sci 2006; 97: 51–6. [DOI] [PMC free article] [PubMed] [Google Scholar]
- 9. Kaneda A, Wakazono K, Tsukamoto T et al. Lysyl oxidase is a tumor suppressor gene inactivated by methylation and loss of heterozygosity in human gastric cancers. Cancer Res 2004; 64: 6410–15. [DOI] [PubMed] [Google Scholar]
- 10. Waki T, Tamura G, Tsuchiya T, Sato K, Nishizuka S, Motoyama T. Promoter methylation status of E‐cadherin, hMLH1, and p16 genes in nonneoplastic gastric epithelia. Am J Pathol 2002; 161: 399–403. [DOI] [PMC free article] [PubMed] [Google Scholar]
- 11. Li QL, Ito K, Sakakura C et al. Causal relationship between the loss of RUNX3 expression and gastric cancer. Cell 2002; 109: 113–24. [DOI] [PubMed] [Google Scholar]
- 12. Youssef EM, Chen XQ, Higuchi E et al. Hypermethylation and silencing of the putative tumor suppressor Tazarotene‐induced gene 1 in human cancers. Cancer Res 2004; 64: 2411–17. [DOI] [PubMed] [Google Scholar]
- 13. So K, Tamura G, Honda T et al. Quantitative assessment of RUNX3 methylation in neoplastic and non‐neoplastic gastric epithelia using a DNA microarray. Pathol Int 2006; 56: 571–5. [DOI] [PubMed] [Google Scholar]
- 14. Yang Y, Takeuchi S, Hofmann WK et al. Aberrant methylation in promoter‐associated CpG islands of multiple genes in acute lymphoblastic leukemia. Leuk Res 2006; 30: 98–102. [DOI] [PubMed] [Google Scholar]
- 15. National Cancer Center. Cancer Statistics Japan. 2005; Available at URL: http://www.ncc.go.jp/jp/statistics/2005/index.html (in Japanese) or http://www.ncc.go.jp/en/statistics/2005/index.html (in English).
- 16. Maekita T, Nakazawa K, Mihara M et al. High levels of aberrant DNA methylation in Helicobacter pylori‐infected gastric mucosae and its possible association with gastric cancer risk. Clin Cancer Res 2006; 12: 989–95. [DOI] [PubMed] [Google Scholar]
- 17. Kawade M, Joh T, Oshima T et al. Prevalence of gastric cancer decreases with age in long‐living elderly in Japan, possibly due to changes in Helicobacter pylori infection status. J Gastroenterol Hepatol 2005; 20: 1333–7. [DOI] [PubMed] [Google Scholar]


