

Abstract
Sphere‐forming abilities in culture condition are considered a hallmark of cancer stem‐like cells, which represents tumor cell invasiveness and stem‐like characteristics. We aimed to show that the sphere‐forming subpopulation of human malignant melanoma cell line WM‐266‐4 acts differently to zebrafish embryo extracts compared with their bulk counterpart. Spheres were maintained in neural stem cell culture conditions. The embryos of zebrafish at specific developmental stages were collected and the extracts were purified under 100 kDa. Spheres were treated with embyo extracts and proliferation assay and immunocytochemistry were conducted. Spheroid cells expressed nestin and epidermal growth factor receptor (EGFR) but not melanoma antigen recognized by T‐cells (MART)1, indicating their stem‐like character. Zebrafish embryo extracts at 50% epiboly stage inhibited melanoma bulk cell proliferation in a dose‐dependent manner. However, sphere‐forming abilities were significantly enhanced under 1 µg/mL concentration of 50% epiboly stage embryo extract treatment. Our findings implicate that we should consider cell subsets of a different character from the tumor origin that can respond differently to exogenous substances or tumor microenvironments. We suggest that cancer research should consider both minor stem‐like subpopulations and the other major bulk tumor cells. (Cancer Sci 2009)
The existence of cancer stem‐like cells has been postulated for the last 30 years. Cancer stem‐like cells (CSCs) represent only minor populations within the tumor; however, they could be crucial for tumor formation because of their unlimited capacity for proliferation, self‐renewal, and drug resistance.( 1 , 2 , 3 , 4 , 5 ) For these reasons, they have also been termed ‘tumor‐initiating cells’.( 6 ) Current research aspects are to search specific markers of CSCs that can be considered as therapeutic targets.( 7 , 8 , 9 , 10 ) A recent report showed that the melanoma chemoresistance mediator ATP‐binding cassette transporter B5 (ABCB5) could represent a molecular marker of the tumorigenic stem‐like cell subset, and systemic administration of monoclonal antibodies directed at ABCB5 showed tumor inhibitory effects in human xenotransplantation mouse models.( 11 )
Cancer stem‐like cells (CSCs) were first identified in the hematopoietic system.( 12 ) More recently, they have also been discovered in solid tumors including those arising in the breast, colon, brain, and melanocyte.( 3 , 13 , 14 , 15 ) One of the key features of CSCs is anchorage independence which can make floating spheres in low attachment conditions or in serum‐free stem cell culture conditions.( 8 , 9 , 16 ) For example, Mani et al. showed that epithelial‐to‐mesenchymal transition (EMT) generates more spheres with many of the properties of self‐renewing stem cells; thus they suggested that blocking the EMT may hold promise in targeting CSCs.( 17 )
Independent of these findings, changes in the behavior of melanoma cells exposed to the embryonic microenvironment were investigated with zebrafish embryos.( 18 , 19 , 20 ) The authors showed that multipotent metastatic melanoma cells can communicate with embryonic progenitors; however, poorly aggressive melanoma cells could not. Because more aggressive cells have more dedifferentiated stem‐like characteristics, we could suppose that specific embryonic morphogens that can communicate with aggressive cancer cells or CSCs must exist, and could serve as therapeutic targets for inhibiting CSCs. Several studies showed that zebrafish embryo proteins inhibit cell growth in several tumor cell lines,( 21 , 22 ) but it has not yet been identified whether specific CSC subsets respond to embryonic morphogens in vitro.
Together, we hypothesized that the sphere‐forming subpopulation of human malignant melanoma cell line WM‐266‐4 may act differently to zebrafish embryo extracts compared with their bulk counterpart. A melanoma spheres culture method was already established and spheres were characterized for self‐renewal capacity, gene expression patterns, and tumorigenicity in nude mice (Na YR, unpublished data, 2008). In this report, we showed that melanoma sphere‐forming abilities were enhanced under a specific developmental stage of zebrafish embryo extract treatment, but that the proliferation of bulk counterpart was inhibited. Our results imply that there could be cell subsets of a different character to the tumor origin that can respond differently to their environments.
Materials and Methods
Cell cultures. Human cutaneous malignant metastatic melanoma cell line WM‐266‐4 was obtained from KCLB (Korean Cell Line Bank) and maintained in MEM Alpha (Gibco BRL, Long Island, NY, USA) supplemented with 10% FBS (Gibco), penicillin 100 U/mL (Gibco‐Invitrogen, Paisley, UK), and streptomycin 100 µg/mL (Gibco‐Invitrogen).
Melanoma spheroid cell culture. For growing melanoma spheroid cells, we used DMEM/F12 (Catalog no. 12500‐062; Gibco) medium optimized for growth of neural stem cells, conditioned with glucose 1.55 g/L (Sigma‐Aldrich, St. Louis, MO, USA); L‐Glutamine 73 mg/L (Sigma‐Aldrich); sodium bicarbonate 1.69 g/L (Sigma‐Aldrich); N‐2 Plus Media Supplement ×1000 containing bovine insulin, human transferrin, sodium selenite, putrescine, and progesterone (R&D Systems, Minneapolis, MN, USA); FGF basic 100 ng/mL; EGF 100 ng/mL (both from R&D Systems); penicillin 100 U/mL (Gibco‐Invitrogen); and streptomycin 100 µg/mL (Gibco‐Invitrogen). Daily supplementations were added with EGF 100 ng/mL and FGF basic 100 ng/mL. Cell morphology was examined under light microscopy (Olympus IX70; Center Valley, PA, USA) and photographed using a Nikon Coolpix 5000 digital camera (Melville, NY, USA).
Immunocytochemical staining. Cells grown on the 35‐mm glass bottom culture dish (MatTek, Ashland, MA, USA) or whole spheroid cells were fixed with 4% paraformaldehyde for 2 h and stained with primary antibodies specific for human nestin (Abcam, Cambridge, UK), epidermal growth factor receptor (EGFR) (Santa Cruz Biotechnology, Santa Cruz, CA, USA), and human melanoma antigen recognized by T‐cells (MART)1 (Abcam). Isotype‐matched mouse antibodies or normal rabbit IgG were used as controls. After washings, primary antibody binding was detected using the corresponding FITC or PE‐conjugated secondary antibodies (Sigma‐Aldrich). Nuclei were stained with Hoechst dye solution (Sigma‐Aldrich) and all staining was observed by confocal fluorescence microscopy (Leica TCS_SP2; Bannockburn, IL, USA).
Reverse transcription–polymerase chain reaction (RT‐PCR). RT‐PCR was used to detect the mRNA expression of nestin and EGFR. Total RNA was isolated from pools of adherent WM‐266‐4 cells, spheroid cells, and human teratocarcinoma cells (Tera‐1) using TRIzol Reagent (Invitrogen, Carlsbad, CA, USA). cDNA was produced from 1 µg of each RNA sample using the Maxime RT PreMix Kit with an oligo dT Primer (iNtRON Biotechnology, Kyungki‐do, Korea) in a 20‐µL reaction volume. PCR was performed with i‐Taq DNA polymerase (iNtRON, Kyounki‐do, Korea) using each primer set. The sequences of the primers and length of predicted amplified gene fragments are described in Table 1. PCR was initiated with denaturation for 3 min at 95°C, followed by 30 cycles of denaturation (1 min, 95°C), annealing (1 min, 50–60°C), and chain extension (1 min, 72°C), ending with 7 min of final extension at 72°C. PCR products derived from the overall pool of cDNA were visualized under ultraviolet light. Band densities were measured with an analyzing program (Kodak Digital Science 1D; NEN Life Science Products, Boston, MA, USA), normalized by the density of GAPDH.
Table 1.
Primer sequences, product size for RT‐PCR
| Protein | Primer sequence | Length of fragment (bp) |
|---|---|---|
| Nestin | 5′ AACAGCGACGGAGGTCTCTA | 220 |
| 3′ TTCTCTTGTCCCGCAGACTT | ||
| EGFR | 5′ TTCTTGCAGCGATACAGCTC | 441 |
| 3′ ATGCTCCAATAAATTCACTGC | ||
| GAPDH | 5′ TCTAGACGGCAGGTCAGGTCCACC | 598 |
| 3′ CCACCCATGGCAAATTCCATGGCA |
EGFR, epidermal growth factor receptor.
Embryo extracts treatment. The embryos of zebrafish (cultured under standard conditions as described in The Zebrafish Book ( 23 )) at specific stages (total six stages: one cell stage, eight‐cell stage, 512‐cell stage, 50% epiboly stage, segmentation period, pharyngula period) were separately collected, washed in distilled water, and dissolved with a Dounce tissue grinder (Wheaton, Millville, NJ, USA) in cold PBS for 60 s. The extracts were purified under 100 kDa with Amicon centrifugal filter devices (Millipore, Billerica, MA, USA) and stored at 4°C until use. For the melanoma cell bulk population, cells were initially subcultured in 96‐well plates (Nunc, Rochester, NJ, USA) with 5 × 10³ cells in each well. After 24 h, embryo extracts were added in 0.1, 1, and 10 µg/mL concentrations, and then growth rates were analyzed after 48 h. For the spheroid culture, 105 melanoma cells were plated in each six‐well (Nunc) plate with the formulated medium described above, and embryo extracts were added daily at a 1‐µg/mL concentration.
Proliferation assay. WM‐266‐4 cell proliferation was determined using a cell proliferation colorimetric assay kit (Roche Applied Science, Indianapolis, IN, USA) and assayed according to the manufacturer's instructions. Briefly, after 2‐h labeling with 5‐bromo‐2‐deoxyuridine (BrdU), the cells were fixed for 30 min at room temperature. Peroxidase‐conjugated anti‐BrdU antibodies were labeled for 90 min at room temperature and tetramethyl benzidine (TMB) was used as substrate. The plates were shaken for 5 min until the stop solution and dye were uniformly distributed and then read on a microtiter plate reader (Techan's Sunrise Absorbance Microplate Reader; Phenix Research Products, Hayward, CA, USA) at 450 nm. Standard medium was used as the blank for these assays. All experiments were repeated at least three times.
Sphere count assay. Spheroid counts were conducted as described by Mani et al.( 17 ) Floating cells with a central dark shadow and diameter approximately over 150 µm were regarded as melanoma spheroids and counted manually under stereomicroscope. All experiments were repeated at least three times and for each experiment, six counts per treatment were made.
Statistical analysis. Quantitative experiments were analyzed by the Student's t‐test using GraphPad Prism version 3 (GraphPad Software, La Jolla, CA, USA) for significant differences in embryo extract treated cells. Data are presented as means ± SD. P‐values equal to or more than 0.05 were considered not significant.
Results
WM‐266‐4 cells can grow as spheroids in serum‐depleted culture conditions. In normal culture conditions supplemented with 10% FBS, WM‐266‐4 cells grew as typical attached mesenchymal cell morphologies with long cytoplasmic projections and narrow cell bodies (Fig. 1a). Rapid medium change into serum‐depleted neural stem cell culture conditions made cells that gradually detached from the bottom of culture flask and aggregated. After 7 days with medium change, most of cell aggregates disappeared as debris and only a few cells grew as spheroids (Fig. 1b). Cell masses that had a central dark shadow and diameter over 150 µm (inset box in Fig. 1b) were considered as spheroids in this study. Clonogenecity of spheroid cells was also confirmed by limiting dilution assay (Supplementary Fig. 1).
Figure 1.

WM‐266‐4 cells can grow as spheroids in serum‐depleted culture conditions. (a) WM‐266‐4 cell morphology in normal culture conditions with 10% fetal bovine serum is shown. Typical mesenchymal cells with two or three cytoplasmic projections and long cell body are attached. Bar = 25 µm. (b) Fifteen days after medium change into neural stem‐cell culture conditions, most cell aggregates disappeared as cell debris, and small portions could grow as spheroids. Inset box shows a representative spheroid that has a dark central shadow and is over 150 µm in diameter. Bar = 100 µm.
Melanoma spheroid cells expressed overall nestin and EGFR expression but not MART1. We confirmed our spheroid cells by examining nestin and EGFR expression, a putative marker for neural stem cells( 11 , 24 ) and another marker for a small cellular subset highly enriched in stem cells from the embryonic brain,( 25 ) respectively (Fig. 2). Whole sphere fixation and immunocyto‐chemistry results showed that nestin was expressed in the overall cells composing each sphere (Fig. 2b). Spheres also expressed EGFR in general (Fig. 2c); however, they did not express MART1, a melanocyte‐specific phenotype marker (Fig. 2a). In contrast, the attached bulk population expressed MART1 in some areas (Fig. 2e), and we also found nestin‐positive attached melanoma cells although the expression rates were lower than spheres (Fig. 2d). All isotype‐matched controls were confirmed as negative results for which the data is not shown. Semi‐quantitative RT‐PCR data also showed more higher gene expression levels for nestin and EGFR in the spheroid cells than attached bulk cells (Fig. 2f).
Figure 2.
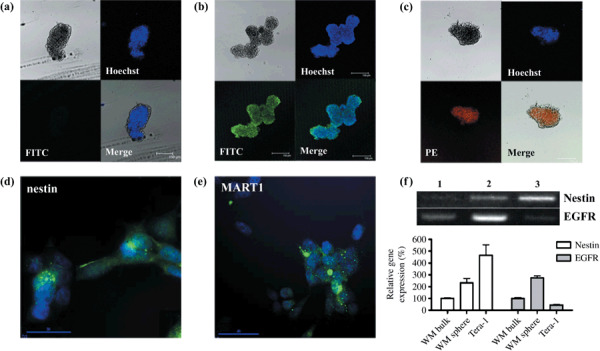
Melanoma spheroid cells express nestin and epidermal growth factor receptor (EGFR). A whole sphere was fixed at 4% paraformaldehyde and stained with Hoechst dye solution to visualize nuclei with the UV light emission wavelength at 495 nm. (a–c) Immunocytochemistry with anti‐human melanoma antigen recognized by T‐cells (MART)1 (a), nestin (b), and EGFR (c) antibody. Spheroid cells did not show detectable MART1 signals. Overall nestin (FITC) and EGFR (PE) expressions in the spheroid cells are shown. Spheres approximately 150 µm in diameter with a central dark shadow were considered as the minimum size. (d–e) Immunocytochemistry for nestin and MART1 in the attached WM‐266‐4 cells. Attached WM‐266‐4 cells expressed nestin in some cells of cytosol with filamentous morphology. Representative of three independent experiments. (f) Semi‐quantitative RT‐PCR results for nestin and EGFR. Lane 1: attached WM‐266‐4 bulk cells. Lane 2: WM‐266‐4 spheroid cells. Lane 3: Teratocarcinoma cells (Tera‐1) cells as a stem cell–positive control.
Melanoma bulk population growth is inhibited by zebrafish embryo extract treatment. To assess the effect of zebrafish embryo extracts at specific developmental stages (one cell stage, eight‐cell stage, 512‐cell stage, 50% epiboly stage, segmentation period, pharyngula period), WM‐266–4 bulk cells were exposed to various concentrations of embryo extracts (0.1, 1, 10 µg/mL), after which cell proliferation was measured by the BrdU‐incorporation rates (Fig. 3). Growth inhibition was confined in the group treated with portions of extracts under 100 kDa. Only in the 50% epiboly stage zebrafish embryo extract (EP)‐treated groups among the total six stages, was cell growth significantly and dose‐dependently reduced after 48 h in all the concentrations tested (Fig. 3b).
Figure 3.
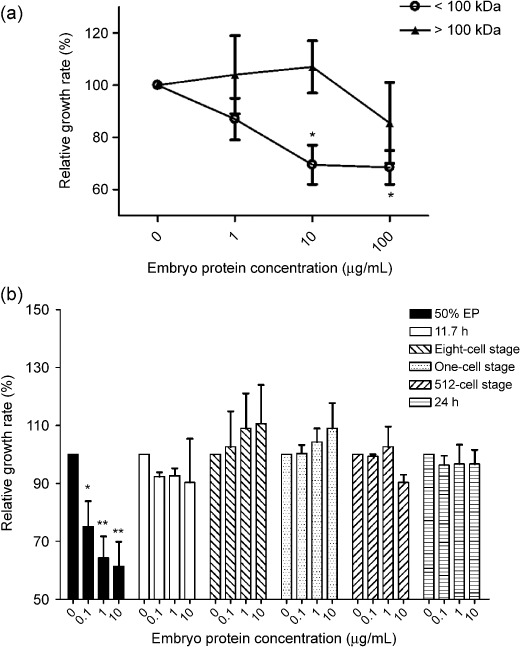
Effects of zebrafish embryo extracts on melanoma cell growth. (a) EP portion under 100 kDa inhibited WM‐266‐4 cell growth in a dose‐dependent manner. Cells were cultured in a 96‐well plate and relative growth rates compared with the control group were examined using a cell proliferation colorimetric assay kit (Roche Applied Science, Indianapolis, IN, USA) 48 h after embryo protein treatments. All other experiments in this study used protein portions below 100 kDa. *P < 0.02 by Student's t‐test (b) A total six stages of zebrafish embryos (one‐cell stage, eight‐cell stage, 512‐cell stage, 50% epiboly stage, segmentation period, pharyngula period) were treated over 48 h and then relative growth rates were examined. Only EP inhibited WM‐266‐4 cell growth. EP, 50% epiboly stage zebrafish embryo extracts. *P < 0.0396, **P < 0.0158 by Student's t‐test.
Sphere forming ability is enhanced in the EP treatment group. Melanoma bulk single cells of 105 were seeded in six‐well plates and cultured in formulated medium for enriching neural stem cells. Around 15 spheres at day 17 in each well were counted in the control group but the spheres could not grow up and gradually disappeared after day 17, with no sphere found at day 20 (Fig. 4). In contrast, sphere numbers increased steeply after day 14, totaling around 80 in the EP‐treated group.
Figure 4.
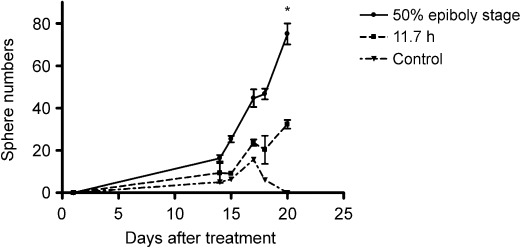
Sphere forming ability was enhanced by embryo protein treatment. Sphere forming rates were significantly higher in the EP treatment group than in the 11.7‐h or control groups. Manual sphere counts were conducted until day 20 after single cell seeding with each protein treatment. EP, 50% epiboly stage zebrafish embryo extracts. 11.7 h, zebrafish embryo extracts at the segmentation period. Two‐tailed P‐value < 0.0429 and number of pairs = 6 by paired t‐test.
Discussion
Here we demonstrated that melanoma spheroid cells act differently from their bulk counterpart to the zebrafish embryo extracts. We found that neural stem cell–enriching culture conditions resulted in floating melanoma sphere formation, and these spheres expressed nestin and EGFR but not MART1. We found that portions of 50% epiboly stage embryo extract under 100 kDa inhibited melanoma bulk population growth. Interestingly, embryo extracts at this stage can enhance melanoma sphere formation ability.
Our studies reveal that established metastatic melanoma cell line WM‐266‐4 cells could form spheres under neural stem cell culture conditions. The adherent population cultured in vitro under standard conditions generally displays spindle‐to‐epitheloid morphology, although some have small ovoid or flat polygonal forms. It seems that the WM‐266‐4 melanoma cell line stably maintains multiple morphologies. James et al. discussed this phenomenon as a tumor based on a mutant stem cell.( 3 ) They confirmed that the small cells in their culture condition were found to have a decreased proliferative rate and were less melanized. Our result that bulk population growth was inhibited by embryo extracts, but that the minor sphere‐forming subpopulation was not inhibited, may accord with this study. FACS analysis data suggests that the transit amplifying the MART1‐positive cell portion might be affected by embryo extracts, but that the nestin‐positive cancer stem‐like population seems not to be affected in the normal culture conditions (Supplementary Fig. 2). Further investigations are needed to find the exact mechanisms.
We selected a total of six different embryonic time‐points covering five different developmental stages.( 26 ) The one‐cell stage refers to maternal transcriptome status, the eight‐cell stage represents the active cleavage period, and the 512‐cell stage belongs to blastula. The 50% epiboly stage is the gastrula period in which the midblastula transition begins, so cell cycles during this stage are lengthened.( 23 ) In the segmentation period, a variety of morphogenetic movement occurs, and finally in the pharyngula period, most of the organogenesis is completed. In this study, only 50% epiboly stage embryo extracts (EP) seemed to affect to growth rates of spheroid cells and the bulk population. This finding is consistent with previous studies.( 22 ) In addition, Cucina et al. noted that the biological activity of the 50% epiboly stage embryo is shared by a semi‐purified protein fraction whose molecular weight ranges from 20 to 60 kDa, as we showed with portions of extracts under 100 kDa that had an effect on cell growth rates (Fig. 3). Conversely there have been several reports on inhibition of tumorigenicity of melanoma cells in vivo ( 19 , 20 ) examining how cancer cells influence embryonic stem cells. In one study, when melanoma cells were injected into the animal pole of blastula‐stage zebrafish embryos (3 h post fertilization), an abnormal cranial outgrowth formed in zebrafish and inhibition of the tumorigenicity of injected melanoma cells was observed.( 20 ) This means that there might be secretary communicating molecules between embryonic and cancer cells, and it might be possible that these communicating molecules are some kind of embryonic morphogen especially highly expressed during the 50% epiboly stage of development in zebrafish. For example these morphogens contain spadetail (spt), bone morphogenetic protein 7 (Bmp7), Pou‐2, chordin, Wnt11, nma, and Her‐5( 26 ) which could be key communicating factors between cancer cells and their microenvironment.( 15 , 27 , 28 ) Most of these are highly expressed transforming growth factor (TGF)‐β signaling molecules, and their effects accompany induction of mesodermal cell fate and inhibition of neural cell differentiation.( 15 ) It will be interesting to study these molecules as more specific targets which manage tumor cell behavior in different microenvironments.
The highlight in this study was the finding that melanoma sphere‐forming activities were enhanced in response to the 50% epiboly stage zebrafish extracts (EP). Sphere forming rates in the EP‐treated group were up to 0.1%, and this rate is in agreement with other reported CSC subpopulation rates (0.06% of CD20‐positive cells in the WM115 melanoma cell line,( 29 ) 1.6% of ABCB5+ tumor cell frequency in primary human melanoma cells,( 11 ) 2.5% of the CD133+ population in primary human colon carcinoma cells,( 28 ) 0.01~1.2% of the side population in established cancer cell lines( 9 )). To our knowledge, this is the first in vitro study on the interaction between cancer stem‐like subpopulations and embryonic extracts. Moreover, this subpopulation acts differently to the embryonic microenvironment compared with their bulk counterpart. Sendurai et al. showed that increased mammosphere‐forming abilities were acquired due to the EMT.( 17 ) It would be interesting to investigate the relationship between EMT and exogenous embryo proteins in cancer cells. Also we suggest that cancer therapy should consider these two populations opposite in character in the one tumor patient, although further studies are needed on the exact difference between CSC populations and their differentiated bulk counterpart in vivo in relation to molecular mechanisms and their environment.
This study clearly demonstrates the different aspects of CSCs and their bulk population in response to embryonic proteins. The results obtained here suggest that various angles of cancer therapy should be considered. Future studies will be required to find specific embryonic molecules that can communicate with CSCs in the aspect of either enhancing or inhibiting their activities.
Supporting information
Fig. S1. Limiting dilution assay. (a) The efficacy of secondary sphere formation. Secondary spheres formed in wells seeded with individual spheroid cells and attached WM‐266‐4 bulk cells. *indicates significantly increased rate of secondary sphere formation by cells from primary spheres (P < 0.05). (b) Secondary sphere formed from single spheroid cells 17 days after seeding. Bar = 100 µm.
Fig. S2. 50% epiboly stage zebrafish embryo proteins reduced only portions of MART1‐positive cells. FACS analysis was conducted using anti‐nestin and MART1 antibody in the attached bulk control group and embryo protein‐treated group. (a) Nestin‐positive cells did not seem to be affected. (b) However, MART1‐positive cell growth was inhibited with significant difference (P < 0.05).
Please note: Wiley‐Blackwell are not responsible for the content or functionality of any supporting materials supplied by the authors. Any queries (other than missing material) should be directed to the corresponding author for the article.
Supporting info item
Supporting info item
Supporting info item
Acknowledgments
We thankfully acknowledge financial support from a Korea Research Foundation Grant (No. KRF‐005‐E00077), and additional financial support from the BK21 Program for Veterinary Science.
References
- 1. Galmozzi E, Facchetti F, La Porta CA. Cancer stem cells and therapeutic perspectives. Curr Med Chem 2006; 13: 603–7. [DOI] [PubMed] [Google Scholar]
- 2. Dean M, Fojo T, Bates S. Tumour stem cells and drug resistance. Nat Rev Cancer 2005; 5: 275–84. [DOI] [PubMed] [Google Scholar]
- 3. Grichnik JM, Burch JA, Schulteis RD et al . Melanoma, a tumor based on a mutant stem cell? J Invest Dermatol 2006; 126: 142–53. [DOI] [PubMed] [Google Scholar]
- 4. Miki J, Rhim JS. Prostate cell cultures as in vitro models for the study of normal stem cells and cancer stem cells. Prostate Cancer Prostatic Dis 2007. [DOI] [PubMed]
- 5. Ross RA, Spengler BA. Human neuroblastoma stem cells. Semin Cancer Biol 2007; 17: 241–7. [DOI] [PubMed] [Google Scholar]
- 6. Reya T, Morrison SJ, Clarke MF, Weissman IL. Stem cells, cancer, and cancer stem cells. Nature 2001; 414: 105–11. [DOI] [PubMed] [Google Scholar]
- 7. Frank NY, Margaryan A, Huang Y et al . ABCB5‐mediated doxorubicin transport and chemoresistance in human malignant melanoma. Cancer Res 2005; 65: 4320–33. [DOI] [PubMed] [Google Scholar]
- 8. Keshet GI, Goldstein I, Itzhaki O et al . MDR1 expression identifies human melanoma stem cells. Biochem Biophys Res Commun 2008; 368: 930–6. [DOI] [PubMed] [Google Scholar]
- 9. Kondo T, Setoguchi T, Taga T. Persistence of a small subpopulation of cancer stem‐like cells in the C6 glioma cell line. Proc Natl Acad Sci USA 2004; 101: 781–6. [DOI] [PMC free article] [PubMed] [Google Scholar]
- 10. La Porta CA. Drug resistance in melanoma: new perspectives. Curr Med Chem 2007; 14: 387–91. [DOI] [PubMed] [Google Scholar]
- 11. Schatton T, Murphy GF, Frank NY et al . Identification of cells initiating human melanomas. Nature 2008; 451: 345–9. [DOI] [PMC free article] [PubMed] [Google Scholar]
- 12. Bonnet D, Dick JE. Human acute myeloid leukemia is organized as a hierarchy that originates from a primitive hematopoietic cell. Nat Med 1997; 3: 730–7. [DOI] [PubMed] [Google Scholar]
- 13. Annabi B, Rojas‐Sutterlin S, Laflamme C et al . Tumor environment dictates medulloblastoma cancer stem cell expression and invasive phenotype. Mol Cancer Res 2008; 6: 907–16. [DOI] [PubMed] [Google Scholar]
- 14. Baba T, Convery PA, Matsumura N et al . Epigenetic regulation of CD133 and tumorigenicity of CD133+ ovarian cancer cells. Oncogene 2008. [DOI] [PubMed]
- 15. Golestaneh N, Mishra B. TGF‐beta, neuronal stem cells and glioblastoma. Oncogene 2005; 24: 5722–30. [DOI] [PubMed] [Google Scholar]
- 16. Monzani E, Facchetti F, Galmozzi E et al . Melanoma contains CD133 and ABCG2 positive cells with enhanced tumourigenic potential. Eur J Cancer 2007; 43: 935–46. [DOI] [PubMed] [Google Scholar]
- 17. Mani SA, Guo W, Liao MJ et al . The epithelial‐mesenchymal transition generates cells with properties of stem cells. Cell 2008; 133: 704–15. [DOI] [PMC free article] [PubMed] [Google Scholar]
- 18. Hendrix MJ, Seftor EA, Seftor RE, Kasemeier‐Kulesa J, Kulesa PM, Postovit LM. Reprogramming metastatic tumour cells with embryonic microenvironments. Nat Rev Cancer 2007; 7: 246–55. [DOI] [PubMed] [Google Scholar]
- 19. Kulesa PM, Kasemeier‐Kulesa JC, Teddy JM et al . Reprogramming metastatic melanoma cells to assume a neural crest cell‐like phenotype in an embryonic microenvironment. Proc Natl Acad Sci USA 2006; 103: 3752–7. [DOI] [PMC free article] [PubMed] [Google Scholar]
- 20. Lee LM, Seftor EA, Bonde G, Cornell RA, Hendrix MJ. The fate of human malignant melanoma cells transplanted into zebrafish embryos: assessment of migration and cell division in the absence of tumor formation. Dev Dyn 2005; 233: 1560–70. [DOI] [PubMed] [Google Scholar]
- 21. Biava PM, Fiorito A, Negro C, Mariani M. Effects of treatment with embryonic and uterine tissue homogenates on Lewis lung carcinoma development. Cancer Lett 1988; 41: 265–70. [DOI] [PubMed] [Google Scholar]
- 22. Cucina A, Biava PM, D’Anselmi F et al . Zebrafish embryo proteins induce apoptosis in human colon cancer cells (Caco2). Apoptosis 2006; 11: 1617–28. [DOI] [PubMed] [Google Scholar]
- 23. Westerfield M. The Zebrafish Book , 3rd edn. University of Oregon, Eugene: Inst of Neuro Science, 1995.
- 24. Yu SC, Ping YF, Yi L et al . Isolation and characterization of cancer stem cells from a human glioblastoma cell line U87. Cancer Lett 2008; 265: 124–34. [DOI] [PubMed] [Google Scholar]
- 25. Murat A, Migliavacca E, Gorlia T et al . Stem cell‐related ‘self‐renewal’ signature and high epidermal growth factor receptor expression associated with resistance to concomitant chemoradiotherapy in glioblastoma. J Clin Oncol 2008; 26: 3015–24. [DOI] [PubMed] [Google Scholar]
- 26. Mathavan S, Lee SG, Mak A et al . Transcriptome analysis of zebrafish embryogenesis using microarrays. PLoS Genet 2005; 1: 260–76. [DOI] [PMC free article] [PubMed] [Google Scholar]
- 27. Katoh M. Networking of WNT, FGF, Notch, BMP, and Hedgehog signaling pathways during carcinogenesis. Stem Cell Rev 2007; 3: 30–8. [DOI] [PubMed] [Google Scholar]
- 28. Ricci‐Vitiani L, Lombardi DG, Pilozzi E et al . Identification and expansion of human colon‐cancer‐initiating cells. Nature 2007; 445: 111–5. [DOI] [PubMed] [Google Scholar]
- 29. Fang D, Nguyen TK, Leishear K et al . A tumorigenic subpopulation with stem cell properties in melanomas. Cancer Res 2005; 65: 9328–37. [DOI] [PubMed] [Google Scholar]
Associated Data
This section collects any data citations, data availability statements, or supplementary materials included in this article.
Supplementary Materials
Fig. S1. Limiting dilution assay. (a) The efficacy of secondary sphere formation. Secondary spheres formed in wells seeded with individual spheroid cells and attached WM‐266‐4 bulk cells. *indicates significantly increased rate of secondary sphere formation by cells from primary spheres (P < 0.05). (b) Secondary sphere formed from single spheroid cells 17 days after seeding. Bar = 100 µm.
Fig. S2. 50% epiboly stage zebrafish embryo proteins reduced only portions of MART1‐positive cells. FACS analysis was conducted using anti‐nestin and MART1 antibody in the attached bulk control group and embryo protein‐treated group. (a) Nestin‐positive cells did not seem to be affected. (b) However, MART1‐positive cell growth was inhibited with significant difference (P < 0.05).
Please note: Wiley‐Blackwell are not responsible for the content or functionality of any supporting materials supplied by the authors. Any queries (other than missing material) should be directed to the corresponding author for the article.
Supporting info item
Supporting info item
Supporting info item