

Abstract
Although AKT/protein kinase B is constitutively active in non‐small cell lung cancer (NSCLC) cells and is an attractive target for enhancing the cytotoxicity of therapeutic agents, the distinct roles of the AKT isoforms in NSCLC are largely unknown. In the present study, we investigated the roles of AKT1 and AKT2 in NSCLC cells using RNAi. The siRNA targeting of AKT1 or AKT2 effectively decreased protein levels of AKT1 and AKT2, respectively, in A549 and H460 cells. Cisplatin treatment of these cells increased apoptotic cell death compared with control. The siRNA‐induced knockdown of AKT1 in H460 cells significantly decreased basal MEK/ERK1/2 activity, resulting in nuclear factor‐κB activation, whereas knockdown of AKT2 resulted in anti‐apoptotic Bcl‐2 family protein MCL‐1 (MCL‐1) cleavage, the collapse of mitochondrial membrane potential, cytochrome c release, and activation of the caspase cascade. Consequently, both siRNA treatments enhanced the chemosensitivity of H460 cells to cisplatin. However, neither AKT1 nor AKT2 siRNA treatment had any effect of p27 expression, and although both treatments tended to induced G2/M phase arrest, the effect was not statistically significant. Treatment with AKT1 siRNA markedly decreased colony formation growth and migration, but AKT2 siRNA had no significant effects on these parameters. These data suggest that AKT1 and AKT2 both contribute to cell survival, albeit via different mechanisms, and that the effects on cell growth and migration are predominantly regulated by AKT1. These findings may aid in refining targeted strategies for the inhibition of AKT isoforms towards the sensitization of NSCLC cells to therapeutic agents. (Cancer Sci 2011; 102: 1822–1828)
AKT/protein kinase B (PKB) lies at the center of cell signaling pathways controlling cell survival and cell death,( 1 ) and AKT activation is associated with resistance to apoptosis,( 2 ) as well as cell survival,( 3 , 4 ) growth,( 5 ) migration,( 6 ) angiogenesis,( 7 ) and energy metabolism.( 8 , 9 ) Accumulating evidence suggests that AKT perturbations play an important role in tumorigenesis,( 10 ) because many reports have described increased and constitutive activation of AKT isoforms in different cancers caused by gene amplification,( 11 ) mRNA overexpression,( 12 ) mutations leading to constitutive phosphorylation,( 13 ) or the inactivation of antagonists, such as phosphatase and tensin homolog (PTEN).( 14 ) The anti‐apoptotic role of AKT accounts for its transforming ability and for the resistance of cancer cells to the action of chemotherapeutic agents( 15 ) and ionizing radiation.( 16 ) Thus, AKT seems to confer a growth advantage to tumor cells and may be pivotal in the control of their growth, survival, and migration.
In mammals, there are three AKT isoforms: AKT1/PKBα, AKT2/PKBβ, and AKT3/PKBγ. Of these, only AKT1 and AKT2 are expressed ubiquitously in all tissue types examined thus far, with AKT3 expressed exclusively in the testis and neuronal tissue and upregulated in some transformed cells.( 17 ) All three isoforms share a high degree of amino acid homology and are activated by similar pathways in a phosphatidylinositol 3‐kinase (PI3K)‐dependent manner.( 18 ) Although AKT has been subjected to extensive analysis, very few studies have addressed the issue of potential isoform‐specific roles and, in studies on cell systems, it is generally assumed that the AKT1 and AKT2 isoforms play redundant and overlapping roles. Possible selective and independent regulation by AKT1 and AKT2 is supported the results of a few studies examining distinct roles of the isoforms in proliferation,( 19 ) metastasis,( 20 ) differentiation,( 21 ) and myogenesis.( 22 )
In the present study, we investigated the roles of the AKT1 and AKT2 isoforms in non‐small cell lung cancer (NSCLC) cells using RNAi techniques. Our data provide evidence that AKT1 and AKT2 individually contribute to cell survival via different routes, with AKT1 having a more pronounced effect on the growth and migration in H460 cells. Thus, the inhibition of AKT may be effective in sensitizing NSCLC cells to chemotherapeutic agents.
Materials and Methods
Reagents. Cisplatin was obtained from Dong‐A Pharmaceutical (Seoul, Korea). Alamar blue, Trypan blue, Lipofectamine 2000, and tetramethylrhodamine ethyl ester perchlorate (TMRE) were purchased from Gibco‐Invitrogen (Rockville, MD, USA). Hoechst 33258 was purchased from Sigma‐Aldrich (St Louis, MO, USA). LY294002, U0126, and IκB kinase (IKK) inhibitor were obtained from Calbiochem (San Diego, CA, USA). Antibodies specific for BAX, hypoxia‐inducible factor‐1α (HIF‐1α), caspase‐9, and β‐actin were obtained from Santa Cruz Biotechnology (Santa Cruz, CA, USA). Antibodies specific for total AKT, AKT1, AKT2, phosphorylated (p‐) AKT (Thr308), p‐AKT (Ser473), ERK1/2, p‐ERK1/2, p‐MEK1/2, IκB‐α, BCL‐2, p27, p‐BAD, BCL‐2, MCL‐1, pro‐apoptotic Bcl‐2 family protein BID (BID), p‐JAK1/2, member of the sirtuin family (SIRT)‐1, cytochrome c, and caspase‐3 were obtained from Cell Signaling Technology (Danvers, MA, USA).
Cell culture. The human non‐small cell lung cancer (NSCLC) cell lines NCI‐H838, NCI‐H1703, A549, and NCI‐H460 were provided from the American Type Culture Collection (ATCC, Manassas, VA, USA). NSCLC cells were grown in non‐coated T75 culture flasks (Nalge Nunc, Naperville, IL, USA) in RPMI 1640 (Gibco‐Invitrogen) supplemented with 10% heat‐inactivated FBS (Gibco‐Invitrogen), 100 U/mL penicillin, and 100 mg/mL streptomycin (Gibco‐Invitrogen) in a humidified 5% CO2 atmosphere at 37°C. The medium was changed every 3 days and, once cells had reached subconfluence, they were dissociated using 0.05% trypsin/0.53 mM EDTA (Gibco‐Invitrogen).
siRNA transfection. Cells were plated 24 h before siRNA transfection so they were at 50% confluence on the day of transfection. Cells were transfected with Lipofectamine 2000 reagent according to the manufacturer’s instructions. Briefly, cells treated with siRNA–Lipofectamine 2000 complexes were incubated at 37°C in a CO2 incubator for 18 h. The medium was then changed with fresh culture medium and the transfected cells were further incubated for 0–24 h until the target gene was effectively downregulated. The siRNA targeting AKT1 (sc‐29195), AKT2 (sc‐29197), and MCL‐1 (sc‐35877), scrambled siRNA (sc‐37007), and FITC oligomer (sc‐36869) were all purchased from Santa Cruz Biotechnology.
Immunoblotting. Cells were washed with cold PBS (Gibco‐Invitrogen) and lysed in 300 μL cold RIPA buffer [50 mM Tris–HCl, pH 7.5, containing 1% Triton X‐100, 150 mM NaCl, 0.1% sodium dodecyl sulfate (SDS), and 1% sodium deoxycholate] with a protease inhibitor cocktail (Thermo Fisher Scientific, Rockford, IL, USA). Cell lysates were centrifuged at 3000 g for 10 min at 4°C. The supernatants were collected and the protein concentration was determined using a BCA protein assay kit (Thermo Fisher Scientific). For electrophoresis, 30 μg protein was dissolved in sample buffer (60 mM Tris‐HCl, pH 6.8, containing 14.4 mM β‐mercaptoethanol, 25% glycerol, 2% SDS, and 0.1% bromophenol blue), boiled for 5 min, and separated on a 10% SDS reducing gel. The separated proteins were transferred onto polyvinylidene difluoride (PVDF) membranes (Amersham Biosciences, Little Chalfont, Buckinghamshire, UK) using a trans‐blot system (Gibco‐Invitrogen). Blots were blocked for 1 h in TBS (10 mM Tris‐HCl, pH 7.5, with 150 mM NaCl) containing 5% non‐fat dry milk (BD Sciences, CA, USA) at room temperature, washed three times with TBS, and then incubated at 4°C overnight with primary antibodies (all antibodies were diluted 1:1000) in TBST (10 mM Tris, pH 7.5, containing 150 mM NaCl, and 0.02% Tween‐20) containing 3% non‐fat dry milk. The next day, the blots were washed three times with TBST and incubated for 1 h at room temperature with HRP‐conjugated secondary antibodies (1:2000 or 1:5000 dilution) in TBST containing 3% non‐fat dry milk. After washing three times with TBST, proteins were visualized with an ECL detection system (Amersham Biosciences).
Cell viability.
Alamar blue assay. Cells (5 × 10³ cells/well) were seeded onto 96‐well plates (Nalge Nunc) in 100 μL RPMI 1640 containing 10% FBS in the absence of phenol red and then incubated for 24 h at 37°C. Two hours prior to treatment, the medium was replaced with 90 μL RPMI 1640 containing 1% FBS without phenol red. Cells were then treated for 24–72 h with either siRNA and cisplatin separately or in different combinations, as described for the individual experiments. Three hours before the end of the incubation period, 11 μL of 1 × Alamar blue was to the cells. Absorbance was measured at 570 and 600 nm with an ELISA Reader (Molecular Devices, Sunnyvale, CA, USA).
Trypan blue exclusion assay. Cells were harvested using 0.05% trypsin/0.53 mM EDTA, incubated with 4% Trypan blue solution, and then counted using a hemacytometer under an inverted microscope (CK40; Olympus, Melville, NY, USA). Cells failing to exclude the dye were considered nonviable. Cell death data are expressed as a percentage of stained cells.
Binding activity of the nuclear p65 nuclear factor‐κB subunit. Nuclear factor (NF)‐κB activation was determined using an NF‐κB p65 transcription factor assay kit (Cayman Chemical Company, Ann Arbor, MI, USA) according to the manufacturer’s instructions. This ELISA uses a 96‐well plate coated with double‐stranded (ds) DNA containing the NF‐κB consensus binding site. Nuclear extracts were prepared with NE‐PER nuclear and cytoplasmic extraction reagents (Thermo Fisher Scientific) and added to the ELISA plate. Binding of NF‐κB to the target dsDNA was detected by incubation with primary antibodies specific for the activated form of the p65 subunit, visualized using an anti‐rabbit HRP conjugate, and quantified at 450 nm. Each condition was run in triplicate.
Measurement of mitochondrial membrane potential. Mitochondrial membrane potential (MMP) was measured using the fluorescent dye TMRE. At the end of transfection with AKT2 siRNA or MCL‐1 siRNA, the culture medium was removed and cells were incubated with 50 nM TMRE (final concentration) and 5 μg/mL Hoechst 33258 (final concentration) in HEPES buffer (Gibco‐Invitrogen) for 20 min at 37°C in a 5% CO2 incubator. Cells were washed with PBS and examined under a Nikon Eclipse TE2000‐U inverted microscope equipped with a Nikon LH‐M100C‐1 camera (Nikon, Tokyo, Japan). Images of each plate were captured at ×200 magnification using a digital camera.
Cell cycle analysis. Cells were trypsinized, washed with cold PBS, and fixed with 70% ethanol at 4°C for 2 h. Cells were then permeabilized and labeled with 125 μg/mL propidium iodide (PI) using CycleTEST PLUS DNA reagents (BD Sciences). The DNA content was analyzed using a FACSCalibur flow cytometer (BD Sciences), and the distribution of cells in the G0/G1, S, and G2/M phases of the cell cycle determined using CELLQUEST software (BD Sciences).
Colony formation assay. Cells transfected with siRNA were seeded at a density of 5 cells/cm2 in 100‐mm round culture dishes (Nalge Nunc) containing RPMI 1640 supplemented with 10% heat‐inactivated FBS. The medium was replaced with fresh medium every 3–4 days. After 10 days, samples were incubated with 1% (w/v) crystal violet (Biosesang, Seongnam, Korea) in methanol for 10 min and then washed with PBS. Only colonies with a diameter >1 mm were counted.
Wound healing assay. Cells were seeded into six‐well plates (Nalge Nunc) and allowed to grow in complete medium until they reached 70% confluency. Cell monolayers were wounded using a plastic pipette tip (1 mm) to create a scratch. Wounded monolayers were then washed several times with PBS to remove cell debris and then incubated in medium for 4 days. Cell migration into the wound was determined under an inverted microscope (Olympus CK40) at ×40 magnification on Day 4.
Cell migration assay. For the cell migration assay, 4 × 10⁴ siRNA‐transfected cells were resuspended in 300 μL serum‐free medium and added to the upper chamber of the QCM 24 Well Colorimetric Cell Migration Assay (Millipore, Billerica, MA, USA). Then, 500 μL of 10% FBS medium was added to the lower chamber and cells were incubated for 16 h. The cells and medium were carefully removed from the top of the insert by pipetting out the remaining cell suspension, and a cotton‐tipped swab was used to gently remove non‐migratory or non‐invasive cells from the interior of the insert. The insert was stained and images from five representative fields of each membrane were obtained. The number of migratory cells in the lower chamber was counted.
Statistical analysis. Data are presented as the mean ± SD. Statistical significance was determined using Student’s t‐test, with P < 0.05 considered significant.
Results
AKT activity in NSCLC cells and effects of siRNA knockdown in A549 and H460 cells. The NSCLC cell lines H460, A549, H838, and H1703 highly expressed phosphorylated and activated AKT (Fig. 1a). Following exposure to 5, 10, 20, or 50 μM of cisplatin, apoptotic cell death was induced in both a dose‐ and time‐dependent manner (data not shown). Treatment with 10 μM LY294002, an inhibitor of PI3K, induced cell death of NSCLC cells and the addition of LY294002 potentiated cisplatin‐induced cell death compared to cisplatin treatment alone (Fig. 1b). Thus, we examined the effect of the downregulation of AKT isoforms using siRNA specific for AKT1 and AKT2 in A549 and H460 cells treated with 10 μM or 20 μM cisplatin. Scrambled siRNA was used as a control. As shown in Figure 1(c), the transfection efficiency in A549 or H460 cells using an FITC oligomer was >95%. Treatment of cells with AKT1 or AKT2 siRNA effectively decreased protein levels of AKT1 and AKT2, respectively, in A549 and H460 cells (Fig. 1d), which induced cell death in the absence of cisplatin (1, 2). Cisplatin treatment resulted in increased cell death in both AKT1‐ and AKT2‐siRNA transfected cells compared with the scrambled siRNA control (Fig. 1e,f), indicating that activated AKT1 and AKT2 are essential for cell survival. Of the various NSCLC cell lines used, the H460 cells are the most resistant to the downregulation of AKT; thus, these cells were used to investigate the specific roles of AKT isoforms.
Figure 1.
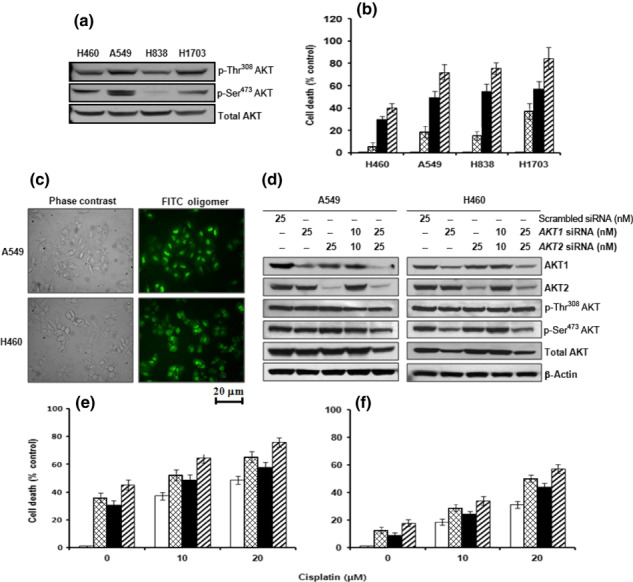
Effects of the downregulation of AKT1 and/or AKT2 on cisplatin‐induced apoptotic cell death in non‐small cell lung cancer (NSCLC) cell lines. (a) Western blot analysis of AKT phosphorylation in H460, A549, H838, and H1703 NSCLC cells. (b) Cell death after NSCLC cells had been exposed to 20 μM cisplatin for 24 h alone (▪) or in the presence ( ) of 10 μM LY294002. (□), vehicle (dimethyl sulfoxide); (
 ),10 μM LY294002 alone. (c) FITC oligomer‐treated A549 and H460 cells 24 h after transfection. Images were viewed using an inverted fluorescence microscope. The A549 and H460 cells were transfected with AKT1 and/or AKT2 siRNA (10 or 25 nM). (d) Western blot analysis of the expression of AKT1, AKT2, phosphorylated (p‐) Thr308 AKT, p‐Ser473 AKT, total AKT, and β‐actin in A549 and H460 cells. A549 and H460 cells were transfected with AKT1 and/or AKT2 siRNA (10 or 25 nM), incubated for 12 h, and then treated with 10 or 20 μM cisplatin for 24 h. (e,f) Alamar blue assay assessing the cell viability of A549 (e) and H460 cells (f) following transfection with scrambled siRNA (□), AKT1 siRNA (
 ), AKT2 siRNA (▪), or AKT1 siRNA + AKT2 siRNA (
 ). The number of dead cells is expressed as a percentage of control cells incubated with scrambled siRNA. Data are the mean ± SD from three separate experiments.
Figure 2.
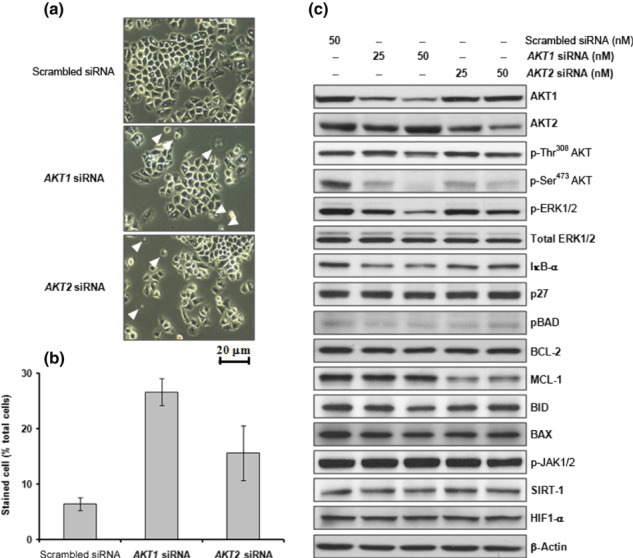
Effects of the downregulation of AKT1 and/or AKT2 on cell viability in H460 cells. (a) H460 cells were transfected with AKT1 or AKT2 siRNA (25 or 50 nM) and incubated for 12 h. Cells are shown 24 h after transfection. Images were viewed using an inverted microscope. Arrowheads indicate dead cells. (b) The number of viable cells was assessed by Trypan blue dye exclusion 24 h after transfection. Stained cells were counted as dead cells and are expressed as a percentage of total cells. Data are the mean ± SD from three separate experiments. (c) Western blot analysis of AKT1, AKT2, phosphorylated (p‐) Thr308 AKT, p‐Ser473 AKT, p‐ERK1/2, total ERK1/2, IκB‐α, p27 (kip1), anti‐apoptotic BCL‐2 family proteins, BCL‐2 and MCL‐1, pro‐apoptotic BCL‐2 family proteins, BID and BAX, p‐Janus kinase (JAK)1/2, member of the sirtuin family (SIRT)‐1, hypoxia‐inducible factor (HIF)1‐α, and β‐actin.
Effects of AKT1 siRNA transfection in H460 cells on NF‐κB activation and cisplatin sensitivity. To explore the role of AKT1 in H460 cells, an siRNA specific for AKT1 was used. Treatment of cells with AKT1 siRNA did not noticeably affect levels of p27, BCL‐2, MCL‐1, BID, BAX, SIRT‐1, or HIF1‐α, nor the phosphorylation of BAD and JAK1/2 (Fig. 2c). However, AKT1 siRNA treatment did effectively decrease basal MEK/ERK1/2 activity and IκB‐α expression while inducing cell death (2, 3). An increase in MEK/ERK1/2 activity was observed in 10 μM cisplatin‐treated H460 cells (Fig. 3a). Pretreatment of cells with 20 μM U0126 effectively attenuated the cisplatin‐induced increase in ERK1/2 activity (data not shown) and resulted in a decrease in cisplatin‐induced cell death compared with that in cells treated with cisplatin alone (Fig. 3b). These results suggest that cisplatin‐induced MEK/ERK1/2 activity mediates cell death in H460 cells. Exposure of 10 μM LY294002‐ or AKT1 siRNA‐treated cells to 10 μM or 20 μM cisplatin increased cell death compared with cisplatin treatment alone (Fig. 3b). Treatment of cells with AKT1 siRNA or 20 μM U0126 decreased basal IκB‐α expression, which induced NF‐κB activation accompanying cell death (Fig. 3c–f). Pretreatment of these cells with an IKK inhibitor resulted in sustained basal levels of IκB‐α expression and NF‐κB activity, which effectively attenuated AKT1 siRNA or U0126‐induced cell death (Fig. 3c–f). These data indicate that constitutively active AKT1 is essential for cell survival via inactivation of NF‐κB through the MEK/ERK1/2 signaling pathway.
Figure 3.
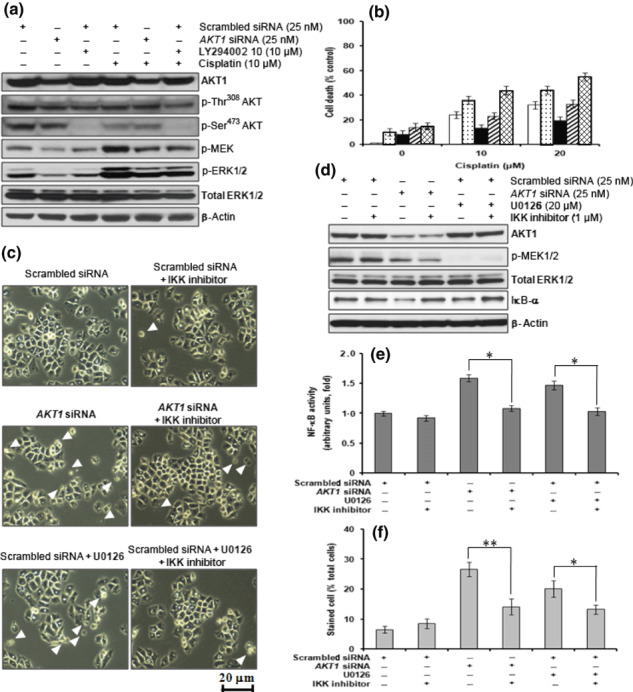
Downregulation of AKT1 induces apoptotic cell death through nuclear factor (NF)‐κB activation via decreased ERK activity. H460 cells were transfected with AKT1 siRNA (25 nM), incubated for 12 h, and then treated with 10 or 20 μM cisplatin for 24 h in the presence or absence of 10 μM LY294002 and/or 20 μM U0126. (a) Western blot analysis of AKT1, phosphorylated (p‐) Thr308 AKT, p‐Ser473 AKT, p‐MEK, p‐ERK1/2, total ERK1/2, and β‐actin. (b) Cell viability, as determined by the Alamar blue assay, following transfection of cells with scrambled siRNA (□), scrambled siRNA + LY294002 ( ), scrambled siRNA + U0126 (▪), scrambled siRNA + LY294002 + U0126 (
 ), or AKT1 siRNA (
 ). (c) AKT1 siRNA‐transfected H460 cells were treated with 20 μM U0126 and/or 1 μM IκB kinase (IKK) inhibitor for 24 h. Cells are shown at 24 h after treatment with U0126 and/or IKK inhibitor. Images were viewed using an inverted microscope. Arrowheads indicate dead cells. (d) Western blot analysis of AKT1, p‐ERK1/2, total ERK1/2, IκB‐α, and β‐actin. (e) Nuclear factor (NF)‐κB activity, as determined by the NF‐κB (p65) transcription factor assay. (f) The number of viable cells, as assessed by Trypan blue dye exclusion. Stained cells were counted as dead cells and are expressed as a percentage of total cells. Data are the mean ± SD from three separate experiments. *P < 0.05; **P < 0.01.
Effects of AKT2 siRNA transfection in H460 cells on MMP and cisplatin chemosensitivity. To explore the role of AKT2 in H460 cells, we used an siRNA specific for AKT2. Treatment of cells with AKT2 siRNA did not noticeably affect levels of IκB‐α, p27, BCL‐2, BID, BAX, SIRT‐1, and HIF1‐α, or the phosphorylation of ERK1/2, BAD, and JAK1/2 (Fig. 2c). However, AKT2 siRNA treatment effectively induced MCL‐1 cleavage, loss of MMP, and cytochrome c release into the cytosol, which resulted in cell death (2, 4). The MMP was assessed by fluorescence imaging using the potentiometric dye TMRE. Following AKT2 siRNA treatment, a decrease in fluorescence intensity was observed (Fig. 4b), which indicates the collapse of MMP by downregulation of AKT2. The anti‐apoptotic protein MCL‐1 resides within the outer mitochondrial membrane and prevents pore formation induced by members of the pro‐apoptotic BCL family. In addition, MCL‐1 siRNA treatment induced the collapse of MMP, cytochrome c release, and cleavage of caspases‐9 and ‐3, resulting in increased cell death (Fig. 4). Cisplatin treatment of AKT2‐ or MCL‐1 siRNA‐transfected cells increased caspase‐9 and caspase‐3 activity and enhanced cell death compared with cells transfected with scrambled siRNA (control; Fig. 4a,c). These data indicate that constitutively active AKT2 is essential for cell survival via the maintenance of intact MCL‐1 and stability of the mitochondrial membrane.
Figure 4.
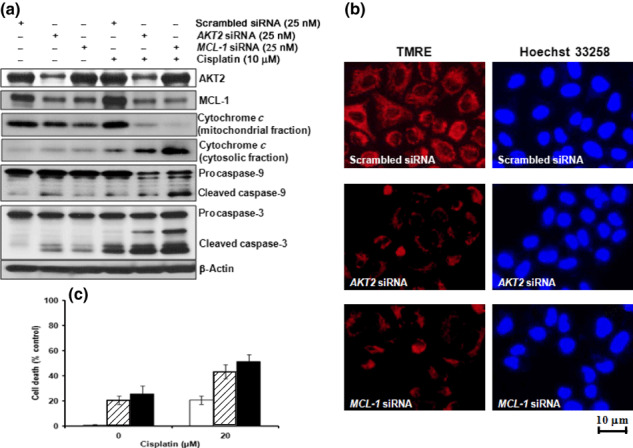
Downregulation of AKT2 induces apoptotic cell death via the collapse of mitochondrial membrane potential (MMP) following MCL‐1 cleavage. H460 cells were transfected with AKT2 siRNA (25 nM) or MCL‐1 siRNA (25 nM), incubated for 12 h, and then treated with 20 μM cisplatin for 24 h. (a) Western blot analysis of AKT2, MCL‐1, cytochrome c, caspase‐9, caspase‐3, and β‐actin expression. (b) AKT2 or MCL‐1 siRNA‐transfected H460 cells were treated with 50 nM tetramethylrhodamine, ethyl ester (TMRE) and 5 μg/mL Hoechst 33258 fluorescent dyes for 20 min. Images were viewed under an inverted fluorescence microscope. (c) Cell viability, as determined by the Alamar blue assay. The number of dead cells is expressed as a percentage of control cells incubated with scrambled siRNA. (□), scrambled siRNA; ( ), AKT2 siRNA; (▪), MCL‐1 siRNA. Data are the mean ± SD of three separate experiments.
Effects of AKT1 or AKT2 siRNA on cell cycle progression. The effects of AKT1 or AKT2 siRNA treatment on cell cycle progression of H460 cells were investigated. Although AKT1 and/or AKT2 siRNA treatment had no effect on p27 expression (Fig. 2c), there was a tendency for both treatments to induce G2/M cell cycle arrest (Fig. 5a,b), although the effect was not statistically significant. There was no significant difference in the effects of AKT1 and AKT2 siRNA treatment.
Figure 5.
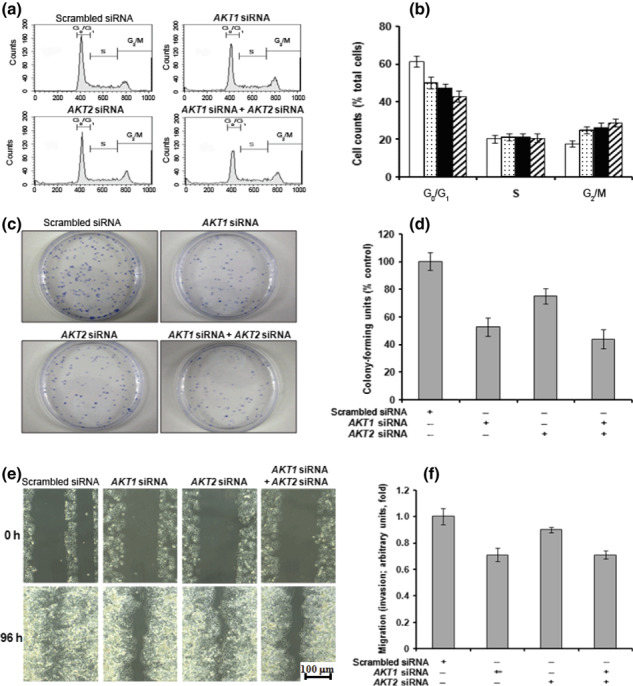
Downregulation of AKT1 decreases colony‐forming growth and migration. H460 cells were transfected with AKT1 and/or AKT2 siRNA (25 nM) and incubated for 24 h. (a,b) The distribution of cells in the G0/G1, S, and G2/M phases of the cell cycle was analyzed with a flow cytometer using propidium iodide. Data are presented as histograms (a) and a quantitative bar graph (b) following the transfection of cells with scrambled siRNA (□), AKT1 siRNA ( ), AKT2 siRNA (▪), or AKT1 siRNA + AKT2 siRNA (
 ). (c) AKT1 and/or AKT2 siRNA‐transfected cells were seeded in 100‐mm round culture dishes and stained with crystal violet after 10 days. (d) Colonies with diameters >1 mm were counted. (e) AKT1 and/or AKT2 siRNA‐transfected cells were wounded using a plastic pipette tip and incubated for 4 days. Cell migration into the wound was determined under an inverted microscope. (f) AKT1 and/or AKT2 siRNA‐transfected cells were added to the upper chamber of the QCM 24 Well Colorimetric Cell Migration Assay (Millipore) with serum‐free medium, whereas 10% FBS medium was added to the lower chamber. Cells that had migrated into the lower chamber were counted.
Effects of AKT1 siRNA treatment on clonogenic growth and migration. The effects of AKT1 and/or AKT2 siRNA on clonogenic growth of H460 cells were evaluated in the colony formation assay. As shown in Figure 5(c,d), AKT1 siRNA transfection resulted in an approximate 50% decrease in the number of colonies compared with the scrambled siRNA control. Following AKT2 siRNA transfection of H460 cells, there was an approximate 25% decrease in the number of colonies formed compared with control cells. In addition, AKT1 siRNA treatment effectively decreased wound‐healing migration (Fig. 5e) and transwell migration (Fig. 5f); comparatively to that of AKT1 siRNA‐treated cells, AKT2 siRNA treatment only partially inhibited migration. These data suggest that AKT1 is more crucial than AKT2 for the growth and migratory potential of H460 cells.
Discussion
In the present study, we showed that AKT was constitutively active in the NSCLC cell lines H460, A549, H838, and H1703. Treatment of NSCLC cells with 10 μM LY294002 alone partially induced cell death, whereas concomitant treatment of cells with LY294002 and cisplatin resulted in enhanced cisplatin‐induced apoptotic cell death. Moreover, knockdown of AKT1 or AKT2 using siRNA induced apoptotic cell death, which was potentiated by cisplatin treatment. Our attempt to establish stable cell lines using lentiviral vectors expressing shRNA to constitutively downregulate AKT1 or AKT2 resulted in non‐viable clones that continually died due to apoptosis (data not shown). The number of colonies formed by H460 cells after AKT1 siRNA treatment was only approximately 50% of that seen for control cells, whereas AKT2 siRNA‐transfected cells formed approximately about 75% of the colonies formed in scrambled siRNA control cells. Thus, although both AKT1 and AKT2 may play essential roles in cell survival in NSCLC cells, they likely act through different mechanisms.
The mechanisms by which the AKT isoforms promote cell survival include the phosphorylation of the pro‐apoptotic proteins BAD, caspase‐9, Forkhead transcription factors, and IKK, resulting, respectively, in reduced binding of BAD to BCL‐xL, the inhibition of caspase‐9 activity, FAS ligand gene transcription, and activation of the NF‐κB cascade.( 23 , 24 , 25 , 26 ) In addition, AKT has been shown to inhibit the RAF–MEK–ERK pathway through the phosphorylation of RAF‐1 in myotubes and to overcome constitutively active MAPK‐induced cell cycle arrest in MCF7 cells.( 27 , 28 ) Constitutively active AKT1 is able to phosphorylate a residue (Ser259) of RAF, which mediates binding to 14‐3‐3 proteins, resulting in the inhibition of RAF activity.( 28 ) Furthermore, constitutively active AKT1 has been reported to suppress ERK activity downstream of RAF and MEK and independent of ERK phosphorylation.( 29 ) In a previous study, we showed that AKT1 siRNA treatment did not affect RAF activity, but effectively attenuated the activity of p21‐activated protein kinase (PAK), MEK, ERK, and cAMP response element‐binding protein (CREB).( 30 ) In the present study, AKT1 siRNA treatment did not noticeably affect the expression of p27, BCL‐2, MCL‐1, BID, BAX, SIRT‐1, or HIF1‐α, or the phosphorylation of BAD and JAK1/2, but it did effectively decrease basal MEK/ERK1/2 activity and IkB‐α expression, which accompanied cell death. These results suggest that constitutively activate MEK/ERK is regulated by AKT1 via the PAK pathway, but independent of RAF.
In addition, we have shown in the present study that IκB‐α expression is attenuated by AKT1 siRNA treatment. It has been reported previously that cisplatin treatment induces AKT activation, the inhibition of which results in increased cytotoxicity in H460 cells.( 31 , 32 ) Because cisplatin also induces the activation of NF‐κB, a similar tendency for cytotoxicity has been observed in cells treated with an NF‐κB inhibitor.( 32 ) In contrast, independent inhibition of either AKT phosphorylation or NF‐κB activity could effectively sensitize H1299 cells to cisplatin. Interestingly, treatment of NSCLC with bortezomib, which inhibits NF‐κB by interfering with proteasome activity, is cytotoxic only in those cells that exhibit high constitutive activation of NF‐κB.( 33 ) Although NF‐κB activation can, indeed, protect cells under certain conditions, the results of the present study suggest that inhibition of the AKT1–MEK/ERK signaling pathway induces NF‐κB activity, resulting in apoptotic cell death and enhanced cisplatin chemosensitivity.
In the present study we showed that MCL‐1 levels and mitochondrial stability are reduced following AKT2 siRNA transfection. A previous report has suggested that the downregulation of AKT2 eventually leads to pathological autophagy.( 34 ) An important conclusion derived from the previous study is that wild‐type AKT2 may protect a cell from pathological autophagy by modulating mitochondrial homeostasis. Consistent with this, in the present study we observed that downregulation of AKT2 induces MCL‐1 cleavage, the collapse of MMP, and cytochrome c release into the cytosol, accompanied by activation of the caspase cascade, resulting in apoptotic cell death and increased chemosensitivity to cisplatin. As yet, few studies have explored the relationship between AKT2 and mitochondrial stability; therefore, further investigations in this area are needed.
In studies in which roles for AKT1 and AKT2 in cell motility have been reported, distinct and, in some cases, opposing functions for the two isoforms are often observed. For example, in fibroblasts, AKT1 has repeatedly been found to promote invasion.( 35 ) Furthermore, AKT1, but not AKT2, has been found to be important for endothelial cell migration through the regulation of the nitric oxide signaling pathway.( 36 ) However, previous studies have found that although AKT2 stimulates the motility of breast and ovarian cancer cells, AKT1 actually inhibits the motility of these cells.( 37 ) Overexpression of wild‐type AKT2 in an ERBB2‐overexpressing breast cancer cell line enhanced invasiveness in vitro and metastases in animal models.( 38 , 39 ) In other studies, overexpression of activated AKT1 in ErbB2 transgenic mouse mammary tumors decreased their metastatic potential, but enhanced their proliferation.( 40 ) These studies tend to find that in cells where one isoform stimulates motility, the other isoform usually has a limited or even opposing role. Our data indicate that although AKT1 promotes migration in NSCLC cells, as evidenced by the results of both wound‐healing and transwell assays, AKT2 only moderately affects cell motility.
In conclusion, we have demonstrated that AKT1 and AKT2 comparably contribute to cell survival via different routes, and consideration of this may aid in the development of targeted strategies for specific AKT isoform inhibition with the aim of sensitizing NSCLC cells to therapy.
Disclosure Statement
The authors report no potential conflicts of interest.
Acknowledgments
This study was supported by grants from the National R&D Program for Cancer Control, Ministry for Health, Welfare and Family Affairs, Republic of Korea (project no: 0720230) and Samsung Biomedical Research Institute grant (#SBRI C‐A7‐201‐3).
References
- 1. Wendel HG, De Stanchina E, Fridman JS et al. Survival signalling by Akt and eIF4E in oncogenesis and cancer therapy. Nature 2004; 428: 332–7. [DOI] [PubMed] [Google Scholar]
- 2. Xu J, Zhou JY, Wei WZ, Wu GS. Activation of the Akt survival pathway contributes to TRAIL resistance in cancer cells. PLoS One 2010; 5: e10226. [DOI] [PMC free article] [PubMed] [Google Scholar]
- 3. Yoshizawa A, Fukuoka J, Shimizu S et al. Overexpression of phospho‐eIF4E is associated with survival through AKT pathway in non‐small cell lung cancer. Clin Cancer Res 2010; 16: 240–8. [DOI] [PMC free article] [PubMed] [Google Scholar]
- 4. Zhuang J, Hawkins SF, Glenn MA et al. Akt is activated in chronic lymphocytic leukemia cells and delivers a pro‐survival signal: the therapeutic potential of Akt inhibition. Haematologica 2010; 95: 110–8. [DOI] [PMC free article] [PubMed] [Google Scholar]
- 5. Dey JH, Bianchi F, Voshol J, Bonenfant D, Oakeley EJ, Hynes NE. Targeting fibroblast growth factor receptors blocks PI3K/AKT signaling, induces apoptosis, and impairs mammary tumor outgrowth and metastasis. Cancer Res 2010; 70: 4151–62. [DOI] [PubMed] [Google Scholar]
- 6. Hollier BG, Kricker JA, Van Lonkhuyzen DR, Leavesley DI, Upton Z. Substrate‐bound insulin‐like growth factor (IGF)‐I–IGF binding protein–vitronectin‐stimulated breast cell migration is enhanced by coactivation of the phosphatidylinositide 3‐kinase/AKT pathway by alphav‐integrins and the IGF‐I receptor. Endocrinology 2008; 149: 1075–90. [DOI] [PubMed] [Google Scholar]
- 7. Ma J, Sawai H, Ochi N et al. PTEN regulates angiogenesis through PI3K/Akt/VEGF signaling pathway in human pancreatic cancer cells. Mol Cell Biochem 2009; 331: 161–71. [DOI] [PubMed] [Google Scholar]
- 8. Gottlob K, Majewski N, Kennedy S, Kandel E, Robey RB, Hay N. Inhibition of early apoptotic events by Akt/PKB is dependent on the first committed step of glycolysis and mitochondrial hexokinase. Genes Dev 2001; 15: 1406–18. [DOI] [PMC free article] [PubMed] [Google Scholar]
- 9. Hahn‐Windgassen A, Nogueira V, Chen CC, Skeen JE, Sonenberg N, Hay N. Akt activates the mammalian target of rapamycin by regulating cellular ATP level and AMPK activity. J Biol Chem 2005; 280: 32081–9. [DOI] [PubMed] [Google Scholar]
- 10. Blanco‐Aparicio C, Cañamero M, Cecilia Y et al. Exploring the gain of function contribution of AKT to mammary tumorigenesis in mouse models. PLoS One 2010; 5: e9305. [DOI] [PMC free article] [PubMed] [Google Scholar]
- 11. Staal SP. Molecular cloning of the akt oncogene and its human homologues AKT1 and AKT2: amplification of AKT1 in a primary human gastric adenocarcinoma. Proc Natl Acad Sci USA 1987; 84: 5034–7. [DOI] [PMC free article] [PubMed] [Google Scholar]
- 12. Govindarajan B, Sligh JE, Vincent BJ et al. Overexpression of Akt converts radial growth melanoma to vertical growth melanoma. J Clin Invest 2007; 117: 719–29. [DOI] [PMC free article] [PubMed] [Google Scholar]
- 13. Han SW, Kim TY, Jeon YK et al. Optimization of patient selection for gefitinib in non‐small cell lung cancer by combined analysis of epidermal growth factor receptor mutation, K‐ras mutation, and Akt phosphorylation. Clin Cancer Res 2006; 12: 2538–44. [DOI] [PubMed] [Google Scholar]
- 14. Haas‐Kogan D, Shalev N, Wong M, Mills G, Yount G, Stokoe D. Protein kinase B (PKB/Akt) activity is elevated in glioblastoma cells due to mutation of the tumor suppressor PTEN/MMAC. Curr Biol 1998; 8: 1195–8. [DOI] [PubMed] [Google Scholar]
- 15. Sos ML, Koker M, Weir BA et al. PTEN loss contributes to erlotinib resistance in EGFR‐mutant lung cancer by activation of Akt and EGFR. Cancer Res 2009; 69: 3256–61. [DOI] [PMC free article] [PubMed] [Google Scholar]
- 16. Martelli AM, Tazzari PL, Tabellini G et al. A new selective AKT pharmacological inhibitor reduces resistance to chemotherapeutic drugs, TRAIL, all‐trans‐retinoic acid, and ionizing radiation of human leukemia cells. Leukemia 2003; 17: 1794–805. [DOI] [PubMed] [Google Scholar]
- 17. Brazil DP, Yang ZZ, Hemmings BA. Advances in protein kinase B signalling: AKTion on multiple fronts. Trends Biochem Sci 2004; 29: 233–42. [DOI] [PubMed] [Google Scholar]
- 18. Franke TF, Yang SI, Chan TO et al. The protein kinase encoded by the Akt proto‐oncogene is a target of the PDGF‐activated phosphatidylinositol 3‐kinase. Cell 1995; 81: 727–36. [DOI] [PubMed] [Google Scholar]
- 19. Yang W, Ju JH, Lee KM, Shin I. Akt isoform‐specific inhibition of MDA‐MB‐231 cell proliferation. Cell Signal 2011; 23: 19–26. [DOI] [PubMed] [Google Scholar]
- 20. Dillon RL, Marcotte R, Hennessy BT, Woodgett JR, Mills GB, Muller WJ. Akt1 and akt2 play distinct roles in the initiation and metastatic phases of mammary tumor progression. Cancer Res 2009; 69: 5057–64. [DOI] [PMC free article] [PubMed] [Google Scholar]
- 21. Yun SJ, Kim EK, Tucker DF, Kim CD, Birnbaum MJ, Bae SS. Isoform‐specific regulation of adipocyte differentiation by Akt/protein kinase Balpha. Biochem Biophys Res Commun 2008; 371: 138–43. [DOI] [PubMed] [Google Scholar]
- 22. Sumitani S, Goya K, Testa JR, Kouhara H, Kasayama S. Akt1 and Akt2 differently regulate muscle creatine kinase and myogenin gene transcription in insulin‐induced differentiation of C2C12 myoblasts. Endocrinology 2002; 143: 820–8. [DOI] [PubMed] [Google Scholar]
- 23. Datta SR, Dudek H, Tao X et al. Akt phosphorylation of BAD couples survival signals to the cell‐intrinsic death machinery. Cell 1997; 91: 231–41. [DOI] [PubMed] [Google Scholar]
- 24. Cardone MH, Roy N, Stennicke HR et al. Regulation of cell death protease caspase‐9 by phosphorylation. Science 1998; 282: 1318–21. [DOI] [PubMed] [Google Scholar]
- 25. Ozes ON, Mayo LD, Gustin JA, Pfeffer SR, Pfeffer LM, Donner DB. NF‐kappaB activation by tumour necrosis factor requires the Akt serine‐threonine kinase. Nature 1999; 401: 82–5. [DOI] [PubMed] [Google Scholar]
- 26. Romashkova JA, Makarov SS. NF‐kappaB is a target of AKT in anti‐apoptotic PDGF signalling. Nature 1999; 401: 86–90. [DOI] [PubMed] [Google Scholar]
- 27. Rommel C, Clarke BA, Zimmermann S et al. Differentiation stage‐specific inhibition of the Raf‐MEK‐ERK pathway by Akt. Science 1999; 286: 1738–41. [DOI] [PubMed] [Google Scholar]
- 28. Zimmermann S, Moelling K. Phosphorylation and regulation of Raf by Akt (protein kinase B). Science 1999; 286: 1741–4. [DOI] [PubMed] [Google Scholar]
- 29. Galetic I, Maira SM, Andjelkovic M, Hemmings BA. Negative regulation of ERK and Elk by protein kinase B modulates c‐Fos transcription. J Biol Chem 2003; 278: 4416–23. [DOI] [PubMed] [Google Scholar]
- 30. Lee MW, Kim DS, Min NY, Kim HT. Akt1 inhibition by RNA interference sensitizes human non‐small cell lung cancer cells to cisplatin. Int J Cancer 2008; 122: 2380–4. [DOI] [PubMed] [Google Scholar]
- 31. Cortes‐Sempere M, Chattopadhyay S, Rovira A et al. MKP1 repression is required for the chemosensitizing effects of NF‐kappaB and PI3K inhibitors to cisplatin in non‐small cell lung cancer. Cancer Lett 2009; 286: 206–16. [DOI] [PubMed] [Google Scholar]
- 32. Sánchez‐Pérez I, Benitah SA, Martínez‐Gomariz M, Lacal JC, Perona R. Cell stress and MEKK1‐mediated c‐Jun activation modulate NFkappaB activity and cell viability. Mol Biol Cell 2002; 13: 2933–45. [DOI] [PMC free article] [PubMed] [Google Scholar]
- 33. Russo A, Fratto ME, Bazan V et al. Targeting apoptosis in solid tumors: the role of bortezomib from preclinical to clinical evidence. Expert Opin Ther Targets 2007; 11: 1571–86. [DOI] [PubMed] [Google Scholar]
- 34. Santi SA, Lee H. Ablation of Akt2 induces autophagy through cell cycle arrest, the downregulation of p70S6K, and the deregulation of mitochondria in MDA‐MB231 cells. PLoS One 2011; 6: e14614. [DOI] [PMC free article] [PubMed] [Google Scholar]
- 35. Zhou GL, Tucker DF, Bae SS, Bhatheja K, Birnbaum MJ, Field J. Opposing roles for Akt1 and Akt2 in Rac/Pak signaling and cell migration. J Biol Chem 2006; 281: 36443–53. [DOI] [PubMed] [Google Scholar]
- 36. Huang Q, Sheibani N. High glucose promotes retinal endothelial cell migration through activation of Src, PI3K/Akt1/eNOS, and ERKs. Am J Physiol Cell Physiol 2008; 295: C1647–57. [DOI] [PMC free article] [PubMed] [Google Scholar]
- 37. Arboleda MJ, Lyons JF, Kabbinavar FF et al. Overexpression of AKT2/protein kinase Bbeta leads to up‐regulation of beta1 integrins, increased invasion, and metastasis of human breast and ovarian cancer cells. Cancer Res 2003; 63: 196–206. [PubMed] [Google Scholar]
- 38. Bacus SS, Altomare DA, Lyass L et al. AKT2 is frequently upregulated in HER‐2/neu‐positive breast cancers and may contribute to tumor aggressiveness by enhancing cell survival. Oncogene 2002; 21: 3532–40. [DOI] [PubMed] [Google Scholar]
- 39. Rychahou PG, Kang J, Gulhati P et al. Akt2 overexpression plays a critical role in the establishment of colorectal cancer metastasis. Proc Natl Acad Sci USA 2008; 105: 20315–20. [DOI] [PMC free article] [PubMed] [Google Scholar]
- 40. Young CD, Nolte EC, Lewis A, Serkova NJ, Anderson SM. Activated Akt1 accelerates MMTV‐c‐ErbB2 mammary tumourigenesis in mice without activation of ErbB3. Breast Cancer Res 2008; 10: R70. [DOI] [PMC free article] [PubMed] [Google Scholar]