

Abstract
Although gastric cancer is the second leading cause of cancer death worldwide, specific and sensitive biomarkers that can be used for its diagnosis are still unavailable. Attempting to improve on current approaches to the serological diagnosis of gastric cancer, we subjected serum samples from 245 individuals (including 127 gastric cancer patients, 100 age‐ and sex‐matched healthy individuals, nine benign gastric lesion patients and nine colorectal cancer patients) for analysis by surface‐enhanced laser desorption/ionization (SELDI) mass spectrometry. Peaks were detected with Ciphergen SELDI software version 3.1.1 and analyzed with Biomarker Patterns’ software 5.0. We developed a classifier for separating the gastric cancer groups from the healthy groups. Three protein masses with 1468, 3935 and 7560 m/z were selected as a potential ‘fingerprint’ for the detection of gastric cancer. It was able to distinguish the gastric cancer patients from the health volunteers with a sensitivity of 95.6% and a specificity of 92.0% in the training set. In the blinding set, it was capable of differentiating the gastric cancer samples from the others with a specificity of 88.0%, a sensitivity of 85.3%, and an accuracy of 86.4%. These values were all higher than those achieved in a parallel analysis by measuring serum carcinoembryonic antigen (CEA) and carbohydrate antigen (CA)19‐9 together. Therefore, the decision tree analysis of serum proteomic patterns has the potential to be used in gastric cancer diagnosis. (Cancer Sci 2007; 98: 37–43)
Gastric cancer is the most frequent malignancy of the gastrointestinal tract among Chinese and certain South‐East Asian populations and the second most common cancer worldwide, accounting for almost 10% of all new cancer cases.( 1 ) It is also among the leading causes of death from cancer throughout the world.( 1 ) However, the precise molecular pathways of gastric carcinogenesis and the clinical progression of the disease have not been fully elucidated.
Although the prognosis for patients with gastric cancer has improved overall in recent years because of progress in diagnostic techniques and treatments, the outcome for patients with late clinical stage is still poor, with a 5‐year survival rate of less than 35%.( 2 ) The mortality of gastric cancer will be decreased if the cancer could be detected earlier. Currently, the most reliable method of diagnosing gastric cancer (i.e. the gold standard method) is gastroscopic biopsy, but it does not lend itself to screening purposes because it is an uncomfortably invasive and complex procedure. Therefore, tumor markers with high specificity and sensitivity are desirous of being identified for screening and diagnosis of gastric cancer easily.
The identification of such biomarkers may now be possible because of the completion of the human genome project, which has focused scientific attention on the development of methods that permit the rapid characterization of proteins encoded by the genome. For example, recent advances in the analytical separation of heterogeneous protein complexes and the development of robust and sensitive methods of mass spectrometry (MS) that are able to reliably analyze peptides and proteins have strongly facilitated the global analysis of proteins in cells and tissues. In addition, new strategies that facilitate proteomic analysis by dramatically simplifying the sample separation and coupling it with mass spectrometers have recently been introduced for use in tumor biomarker discovery. One such strategy is surface‐enhanced laser desorption/ionization (SELDI), which has been combined with time‐of‐flight (TOF) mass spectrometry.( 3 , 4 , 5 , 6 ) The combined system is a novel, extremely sensitive and rapid method able to analyze complex mixtures of proteins and peptides that are affinity bound to a protein chip. SELDI profiling has been successfully used to differentiate ovarian, breast, prostate and liver cancers from controls in serum,( 7 , 8 , 9 , 10 , 11 , 12 , 13 , 14 ) to detect markers of bladder cancer in urine,( 15 ) and to identify markers of pancreatic cancer in pancreatic juices.( 16 )
The purpose of our study was to determine whether there was a certain pattern of serum proteins useful for gastric cancer diagnosis that could be identified by using SELDI‐TOF MS. We therefore applied SELDI‐TOF MS to the identification of differentially expressed proteins in serum samples from patients with gastric cancer and from controls. We first detected proteins with SELDI‐TOF and analyzed them with a biomarker pattern software program. A proteomic pattern composed of three biomarkers was found to be potentially useful in the diagnosis of gastric cancer. Specifically, this pattern distinguished between serum samples from patients with gastric cancer and those from other groups with a specificity of 88.0%, a sensitivity of 85.3%, and an accuracy of 86.4%. The results of a parallel analysis showed a significant advantage for the decision tree analysis of SELDI data over the combined measurement of carcinoembryonic antigen (CEA) and carbohydrate antigen (CA)19‐9. Additionally, we identified the biomarker with a molecular weight of 1468 m/z as fibrinopeptide A (FpA).
Materials and Methods
Patients and samples. The serum samples from cancer patients were collected by the tissue bank of Beijing Cancer Hospital from all in‐patients from January to July 2004. Samples from patients with other diseases and healthy volunteers were collected by the Beijing Chaoyang Hospital during this same period. All samples were obtained with patient consent and institutional review board approval.
The serum samples were immediately stored as aliquots at −80°C until use. A total of 245 serum specimens were collected. The control specimens (n = 100) were from 30 volunteers with no evidence of disease and 70 patients with no digestive disease (i.e. no history or evidence of gastric cancer). The cancer specimens were from 127 patients with gastric cancer and nine with colorectal cancer; these cancers had been confirmed pathologically before treatment initiation or serum collection. The grade of cancers was assessed according to the World Health Organization classification system. (17) Benign gastric lesion disease (n = 9) was also confirmed gastroscopically before serum collection. The demographic information for all collected samples is provided in Table 1, and the numbers of samples used for profiling (training group) and validation (test group) are listed by histopathological classification in Table 2.
Table 1.
General information for the gastric cancer patients and control groups
| Histological classification | No. samples | No. male samples | No. female samples | Age range (years) | Mean age (years) |
|---|---|---|---|---|---|
| Normal | 100 | 60 | 40 | 18–83 | 48.4 |
| Gastric cancer | |||||
| Stage I | 20 | 16 | 4 | 43–79 | 64.0 |
| Stage II | 20 | 16 | 4 | 45–81 | 60.7 |
| Stage III | 59 | 37 | 22 | 35–81 | 60.6 |
| Stage IV | 28 | 16 | 12 | 27–81 | 57.0 |
| Benign lesion | 9 | 2 | 7 | 43–72 | 56.0 |
| Colorectal cancer | 9 | 6 | 3 | 33–69 | 53.7 |
Table 2.
Numbers of serum samples for training and test groups
| Histopathological classification | Training group | Test group | Total |
|---|---|---|---|
| Normal | 50 | 50 | 100 |
| Gastric cancer | 45 | 82 | 127 |
| Benign lesion | 0 | 9 | 9 |
| Colorectal cancer | 0 | 9 | 9 |
Protein chip array preparation and SELDI spectrum generation. The ProteinChip biomarker system (Ciphergen Biosystems, Fremont, CA, USA), a platform for SELDI‐TOF MS, was used for protein profile analysis. Serum samples were thawed and centrifuged for 10 min at 16 000 g to remove cellular fragments. The strong anion exchange (SAX2) array (Ciphergen Biosystems) was used for serum protein SELDI analysis and was assembled in a 96‐well bioprocessor (Ciphergen Biosystems). The array was pre‐equilibrated in 200 µL binding buffer (50 mM Tris‐HCl, pH 8.0) on a shaker at 400 r.p.m. for 5 min at room temperature. Each serum sample was prepared by mixing 3 µL of the serum with 6 µL of a 9 M urea buffer on ice for 30 min and then diluting the mixture with 108 µL of a binding buffer. Next, 100 µL of the diluted sample was applied to each array spot, randomized and incubated on a platform shaker at 400 r.p.m. at room temperature for 1 h. After two washings with 200 µL of binding buffer and one with high‐performance liquid chromatography‐gradient water, the chip arrays were removed from the bioprocessor, and 0.5 µL of saturated energy‐absorbing molecule (EAM) solution (sinapinic acid in 50% acetonitrile and 0.5% trifluoroacetic acid) was applied to each spot. The spots were air dried and then subjected to another application of saturated EAM solution. After air drying, mass spectrometry was carried out with a chip reader (PBS‐IIC; Ciphergen Biosystems), which uses an automated data collection protocol with the manufacturer's software (ProteinChip software 3.1.1) to collect data to a maximum molecular weight of 100 000 m/z. Laser intensity was set to 175–190, detector sensitivity to 9, and the focus mass between 1 and 15 km/z, conditions determined on the basis of the maximum protein peak yield. External calibration of the instrument was carried out using the manufacturer's standard (All‐in‐1 Peptide molecular weight standard; Ciphergen Biosystems).
Peak detection of SELDI spectra. Peak detection was carried out with the same ProteinChip software. All of the spectra were compiled and normalized to the total ion current of an m/z value between 1000 and 10 000, and the baselines were subtracted. The part of the spectrum with m/z values less than 1000 was not used for analysis because signals from EAM generally interfered with peak detection in this area. Peaks with m/z values between 1000 and 10 000 m/z were autodetected with a signal‐to‐noise ratio greater than 8, and the peaks were clustered using second‐pass peak selection with a signal‐to‐noise ratio greater than 2 and a 0.3% mass window. When m/z values were within 0.3% of the mass accuracy window, they were considered identical between replicates. The resulting peak intensity values were logarithmically transformed to reduce the variance of the data over multiple samples.
Quality control of SELDI spectra. The reproducibility of the SELDI spectra was estimated by using two representative serum samples: one from a healthy control and the other from a cancer patient. To assess intrachip variability, each serum sample was loaded onto four spots of a SAX2 chip. To assess interchip variability, the same samples were assayed three times independently. Four protein peaks in the molecular weight range of 1000–10 000 m/z and the intensity range of 40–60 were selected randomly over the course of the study and used to calculate the intra‐array (within one chip array) and interarray (between two chip arrays) coefficients of variance (CV).
Decision tree classification and model assessment. To detect gastric cancer biomarkers, we compared the SELDI spectra of serum from the gastric cancer patients with those from healthy individuals, patients with benign gastric lesion or with colorectal cancer.
Software (Biomarker Patterns’ software [BPS] 5.0; Ciphergen Biosystems) was used to analyze the proteomic features of the training set data, which consisted of SELDI spectra from 45 serum samples of patients with gastric cancer and 50 serum samples from healthy controls. A decision tree was generated by using the Gini method with non‐linear combinations.( 18 ) A 10‐fold cross‐validation analysis was carried out as an initial evaluation of the test error of the algorithm. Briefly, we split the data set into 10 random segments and used nine of them as training sets and the other as a test set for the algorithm. Multiple trees were initially generated from 95 samples by varying the splitting factor by increments of 0.1. These trees were then evaluated by a cross‐validation analysis. The peaks forming the main splitters of the tree with the highest predictive rates were selected, and the tree was rebuilt based on these peaks alone and evaluated by the test set. P‐values were calculated on the basis of a t‐test (Biomarker Wizard software; Ciphergen Biosystems). A P‐value of less than 0.05 was considered statistically significant.
The validity and accuracy of the classification algorithm were then challenged in a blind study of a new test data set consisting of data from 82 patients with gastric cancer, 50 healthy controls, nine patients with benign gastric lesions, and nine patients with colorectal cancer. These samples were arranged randomly and their origins were unknown to the technicians who processed them.
Protein identification of a 1468‐m/z peptide. The 1468‐m/z peptide was identified with a mass spectrometer (QStar/Pulsar mass spectrometer; Applied Biosystems, Foster City, CA, USA) and a protein chip interface (PCI‐1000 ProteinChip interface; Ciphergen Biosystems). Briefly, a SAX2 array was prepared as described earlier, and all eight spots were loaded with serum from one of the patients with gastric cancer. One spot was used in a regular SELDI analysis to confirm the presence of the 1468‐m/z peptide, and the other spots were analyzed by tandem MS. The 1468‐m/z peptide was targeted to be fragmented into smaller ions by collision‐induced dissociation in the MS‐MS collision cell, and these ions were then used in a protein search engine (Mascot; Matrix Science, Boston, MA, USA) to look for any matches with sequences of known peptides and proteins in the database.
Determination of serum levels of CEA and CA19‐9. Serum levels of the tumor markers CEA and CA19‐9 were determined with time‐resolved fluoroimmunoassays (Wallac DELFIA CEA kit and Wallac DELFIA CA19 C9 kit, with cut‐off values of 5 ng/mL and 27.0 U/mL, respectively; PerkinElmer, Wellesley, MA, USA). Assays were carried out according to the manufacturer's instructions.
Results
SELDI spectrum generation and assay reproducibility. Fig. 1 is a representative protein spectrum obtained after SELDI MS and SAX2 processing that shows the protein masses between 1000 and 15 000 m/z of a single serum specimen. As the figure shows, the SELDI technology was particularly effective in resolving the low molecular weight proteins and polypeptides (<10 000 m/z).
Figure 1.
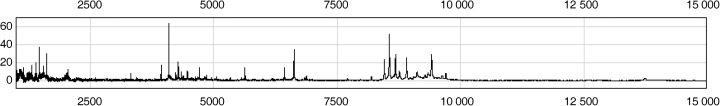
Representative protein mass spectra of the serum sample processed on a SAX2 chip surface, showing the proteins with masses between 1000 and 15 000 m/z.
The reproducibility of the assay was estimated by using representative samples from healthy controls and cancer patients, as described in Materials and Methods. Four protein peaks in the molecular weight range from 1000 to 10 000 m/z (6433, 6631, 8560 and 9416 m/z) and the intensity range of 40–60 were selected randomly to calculate the intra‐array and interarray CV. The intra‐array and interarray CV for mass accuracy were both 0.03%, and for the normalized intensity were 16 and 19.1%, respectively (data not shown).
Decision tree classification and model assessment. To identify the serum proteins and polypeptides that were significantly different between gastric cancer and non‐gastric cancer serum samples, we carried out peak detection with Biomarker Wizard 3.1.1 software after normalizing peak intensities to the total ion current. After being analyzed with the software, 61 out of 181 peaks from patients with gastric cancer were selected, which could be used to distinguish these samples from those from healthy controls or patients with other diseases in the training and test data sets.
Three peaks were selected by the BPS algorithm as candidate biomarkers to distinguish between serum samples from patients with cancer and those from controls. The three peaks, named for their molecular weights of 1468, 3935 and 7560 m/z, achieved a sensitivity of 95.6% and a specificity of 92.0% in diagnosing gastric cancer in the training data set. Their mass spectra and gray‐scale and gel views are shown in Fig. 2. These peaks showed significantly different intensity levels between gastric cancer and other serum samples. Both the 1468‐ and 7560‐m/z peptides appeared to be upregulated but the 3935‐m/z peptide was downregulated in serum samples from patients with gastric cancer compared with samples from healthy volunteers and patients with other diseases.
Figure 2.
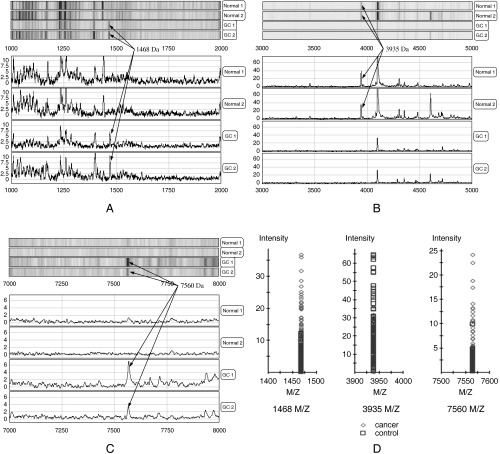
Detection of three proteins in the mass pattern of serum. Mass spectra of serum samples from two different gastric cancer (GC) patients (GC1 and GC2) and two non‐cancer controls (Normal 1 and Normal 2) were generated on a SAX2 ProteinChip array (A–C). The signal intensity at three proteins were significantly different between the gastric cancer specimens and the normal specimens. (D) The average molecular masses of the two proteins identified as upregulated in GC specimens were 1468 and 7560 m/z. The third protein (3935 m/z) was downregulated in GC specimens.
Fig. 3 is the decision tree that was generated from the learning set to classify these two groups. The decision tree classification was then used to predict the presence or absence of cancer in serum samples in the blind test. Of the 82 cases of gastric cancer, 12 were misclassified by the decision tree. And among the 50 healthy volunteers, six were misjudged as gastric cancer. The sensitivity and specificity of the decision tree classification were thus 85.3 (70/82) and 88.0% (44/50), respectively. Of the nine cases of benign gastric lesions, three were misclassified, including two cases of chronic hemorrhagic gastritis and one of a perforation of a gastroduodenal ulcer. Finally, of the nine cases of colorectal cancer, two were misclassified. A summary of the classification results from the decision tree in the training and the blind test data sets is presented in Table 3.
Figure 3.
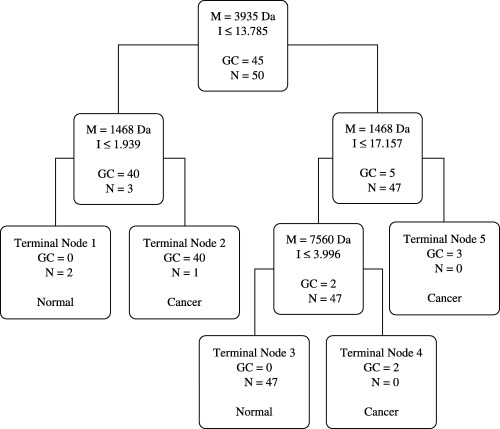
Decision tree classification of the gastric cancer (GC) and non‐cancer (N) groups. The boxes show the decision nodes with the peak mass (M) in m/z, the peak intensity (I) cut‐off levels, and the number of samples. These three masses form the splitting rules. Cases that follow the rule were placed in the left daughter node and the others were put in the right daughter node. The final boxes are the terminal nodes classified as being either cancer or normal.
Table 3.
Results from the decision tree algorithm in the training and test set
| Data set | Identified as gastric cancer | Identified as normal | ||
|---|---|---|---|---|
| n | % | n | % | |
| Training set | ||||
| Gastric cancer (n = 45) | 43 | 95.6 † | 2 | 4.4 |
| Normal (n = 50) | 4 | 8.0 | 46 | 92.0 ‡ |
| Test set | ||||
| Gastric cancer (n = 82) | 70 | 85.3 † | 12 | 14.7 |
| Normal (n = 50) | 6 | 12.0 | 44 | 88.0 ‡ |
| Benign lesion (n = 9) | 3 | 33.3 | 6 | 66.7 |
| Colorectal cancer (n = 9) | 2 | 22.2 | 7 | 77.8 |
Sensitivity and
‡ specificity in training and test set.
Identification of the 1468‐m/z peptide. Identifying potential gastric cancer biomarkers would help us to understand their biological roles in the disease and to know how to utilize them in diagnosis. The small molecular weight of the 1468‐m/z peptide allowed us to conveniently identify it by using direct MS‐MS analysis on a ProteinChip array. A SAX2 array was loaded with the serum from a gastric cancer patient who showed a high level of the 1468‐m/z peptide and was analyzed by tandem MS, as described in Materials and Methods. Fig. 4 shows the parent ion (far right) and a large number of small fragments (left of the parent ion) from the MS‐MS spectra of the 1468‐m/z peptide. We searched a protein database for the 98 most intense ions; 40 of these ions matched theoretical fragments of FpA (DSGEGDFLAEGGGVR). Furthermore, we confirmed the identity of the 1468‐m/z peptide as FpA by immunoprecipitation (data not shown). Therefore, we had a high degree of confidence that the 1468‐m/z peptide was FpA.
Figure 4.
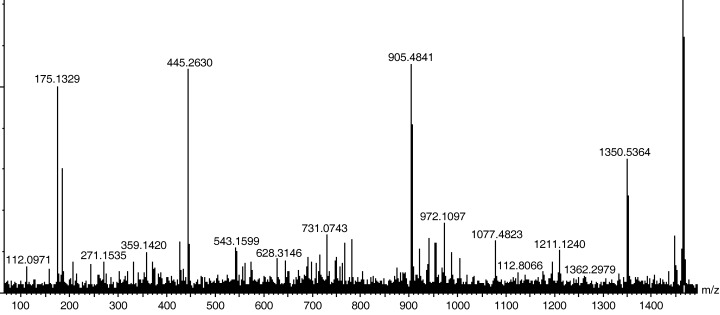
Tandem mass spectrometry analysis of peptide 1468 m/z. The 1468‐m/z parent ion (the first major peak from the right side) was fragmented into smaller ions of different sizes. The molecular weights of these ions were used in a protein search engine for protein identification.
Determination of serum levels of CEA and CA19‐9. To compare the sensitivity for gastric cancer diagnosis using the SELDI ProteinChip system with current serum biomarkers, we measured CEA and CA19‐9 in serum from 82 patients with gastric cancer and nine cases of benign gastric lesion. The combined measurement of CEA and CA19‐9 had a predictive value of only 40.2% (33 of 82; Table 4) for gastric cancer and a predictive value of 77.8% (two of seven; Table 4) for benign gastric lesion disease.
Table 4.
Comparison of the predictions from the decision tree algorithm and the combined serum measurements of CEA and CA19‐9 in patients with gastric cancer and patients with benign gastric lesions
| Correct prediction | False prediction | P‐value | |||
|---|---|---|---|---|---|
| n | % | n | % | ||
| Gastric cancer (n = 82) | |||||
| CEA/CA19‐9 | 33 | 40.2 | 49 | 59.8 | <0.01 |
| Decision tree | 70 | 85.3 | 12 | 14.7 | |
| Benign gastric lesions (n = 9) | |||||
| CEA/CA19‐9 | 7 | 77.8 | 2 | 22.2 | >0.05 |
| Decision tree | 6 | 66.7 | 3 | 33.3 | |
Discussion
Human cancers are diseases with a high degree of genetic heterogeneity. And it is necessary to set up panels of multiple biomarkers for earlier cancer detection and diagnosis. This entails the development of high‐throughput proteomic and genetic approaches and reliable bioinformatic tools for data analysis. The recent development of SELDI technology offers the advantage of rapid and simultaneous detection of multiple proteins from complex biological mixtures in the screening of protein expression profiles known as phenomic fingerprints.( 19 , 20 , 21 , 22 , 23 )
We used the SELDI ProteinChip system in combination with the BPS classification algorithm for setting up protein profiling of serum samples from gastric cancer patients. To select the biochip that was suitable for the analysis of serum and to build a decision tree for gastric cancer diagnosis, we tested different surface biochips, such as IMAC, WCX2 and SAX2, before our formal experiment. We found that the SAX2 chip was more appropriate. At the same time, α‐cyano‐4‐hydroxycinnamic acid (CHCA) and sinapinic acid (SPA) were applied as estimate matrix. We found that the main peak masses were not obviously different using the different matrixes. Three potential biomarkers were found: the peaks at 1468 and 7560 m/z were gastric cancer‐associated biomarkers, whereas the 3935‐m/z peptide appeared more frequently in serum from the healthy controls. Using these biomarkers, we generated an algorithm that was 85.3% accurate in distinguishing patients with gastric cancer from healthy controls in the blind test set, 66.7% (six of nine) accurate in the benign gastric lesion disease set, and 77.8% (seven of nine) accurate in the colorectal cancer set. Such cross validation and analysis of the independent test data sets statistically support the potential use of the algorithm in gastric cancer detection. We also tried to explore the association of the algorithm with clinical stages, but no relationship was founded.
The existing available biomarkers for detection of gastric cancer, such as CEA and CA19‐9, are not satisfactory in their sensitivity and specificity. The reported sensitivity of CEA at the cut‐off value of 5 ng/mL was 23.8% and that of CA19‐9 at the cut‐off value of 27 U/mL was 45.5%.( 24 ) The reported specificities of CEA and CA19‐9 were 91.4 and 91.2%, respectively. Additionally, neither CEA nor CA19‐9 was a specific tumor‐associated antigen for gastric cancer. In other digestive tumors, such as colorectal cancer, pancreatic cancer and esophageal cancer, the sensitivities of CEA were 33.6, 33.3 and 14.5%, and those of CA19‐9 were 30.4, 87.5 and 27.9%, respectively.( 24 ) Interestingly, the rate of serum CEA positivity was highest in lung cancer (69.2%).( 24 ) Thus, CEA and CA19‐9 provide no relevant information for the detection of localized cancers.
We demonstrated that, comparing with serum biomarkers CEA and CA19‐9, SELDI profiling is significantly better at distinguishing patients with gastric cancer from healthy persons or patients with other diseases. The decision tree analysis correctly predicted 86.4% (114 of 132) on the blind test samples, resulting in a positive predictive value of 92.1% and a negative predictive value of 78.6%. In addition, the serum levels of CEA and CA19‐9 were measured in gastric cancer samples using an autoanalyzer in the blind test data set. The combined measurement of CEA and CA19‐9 had a predictive value of only 40.2% (33 of 82; Table 4). When we used statistical software (SAS version 8.0; SAS Institute, Cary, NC, USA) to compare the results of our test method with the results of CEA and CA19‐9 measurement, the decision tree analysis of SELDI data had a significant advantage over the combined measurement of CEA and CA19‐9 (P < 0.01; Table 4). Furthermore, 77.8% (seven of nine) of the colorectal cancer samples that were correctly classified also showed a significantly higher specificity. Of the nine samples from benign gastric lesions, 66.7% (six of nine) were correctly classified by the decision tree analysis. These results showed that the decision tree analysis of SELDI data was a more sensitive and specific method for gastric cancer diagnosis.
Of the three potential protein biomarkers, the 1468‐m/z peptide appeared more frequently in the serum of patients with gastric cancer than in the serum of any other group. This gastric cancer‐associated biomarker, identified as FpA by MS‐MS analysis, was previously proposed as a tumor marker. High levels of plasma FpA have been reported as the most reliable index for the early detection and diagnosis of hepatic metastases and for follow‐up of gastric cancers.( 25 ) In addition, because FpA is a product of the coagulation cascade, increased levels of this substance in the blood may be a predictive and sufficiently reliable indicator of the onset of clotting disorders. It is known that thrombophlebitis and associated disorders may be paraneoplastic symptoms or postoperative complications of gastric cancer,( 26 , 27 , 28 , 29 ) but there is relatively little information on the reasons why and the mechanisms by which they are associated with oncogenesis and progression of gastric cancer. Our results and previous findings suggest that FpA may play a role in cancer, but further investigation is needed.
Although substantial evidence supports the use of SELDI profiling technology as a potential tool for cancer diagnosis, there has also been considerable controversy. The major concern is whether SELDI‐based approaches are reproducible.( 30 , 31 , 32 , 33 ) In our study, the reproducibility of the SELDI spectra was estimated by using two representative serum samples: one from healthy controls and another from cancer patients. Each serum sample was spotted on all eight spot surfaces of one SAX2 array loaded in the bioprocessor, and credible CV were obtained. The intra‐array and interarray CV for mass were both 0.03% and for the normalized intensity were 16 and 18.9%, respectively. Thus, we demonstrated acceptable reproducibility in our study.
For the evaluation and validation of this approach for detection of gastric cancer on a larger scale, interlaboratory repeated assays must be carried out and interlaboratory calibration and standardization of SELDI instrumental and assay platforms established. Semmes and colleagues demonstrated that interlaboratory reproducibility of SELDI‐TOF‐MS serum profiling for prostate cancer approached that of measurement of discrete m/z peaks over time and across laboratories under strict operating procedures for the detection of prostate cancer.( 34 ) These results suggest that high‐throughput proteomic techniques such as SELDI improve the early detection of gastric cancer.
Very recently, Ebert et al. used the same ProteinChip approach to analyze serum mass spectra from gastric cancer patients.( 35 ) They found three potential biomarkers (3503, 3946 and 15 958 m/z) that were obviously different to our result. This difference was possibly caused by the patients’ racial differences, cancer types and the different pH value of the binding buffer (we used binding buffer of pH 8.0, compare with pH 8.5 used by Ebert et al.( 35 )), which could result in the SAX2 ProteinChip capturing different proteins.
One potential drawback of our study was its relatively small sample size, which reduced the validity of generalized conclusions. The complete evaluation of this algorithm will require the testing of its predictive rates in larger training, blind, and independent serum sets. Additionally, the comparative analysis of different types of algorithms will be of paramount importance for selection of the bioinformatic features needed for effective biomarker detection and distinguishing specific types of cancer.
In summary, we have set up a serum proteomic pattern by SELDI‐TOF MS that has potential for clinical usage. It has higher specificity and sensitivity for gastric cancer diagnosis than CEA and CA19‐9, the markers used currently. Furthermore, the 1468‐m/z peak in the pattern, which appeared more frequently in the serum of patients with gastric cancer than that of any other group, was identified as FpA and its function is worth investigating.
Acknowledgment
This work was supported by the National Basic Research Program on Carcinogenesis and Cancer Development (2004CB518702) and the Nature Science Foundation of China (30672418).
References
- 1. Parkin DM, Pisani P, Ferlay J. Estimates of the worldwide incidence of 25 major cancers in 1990. Int J Cancer 1999; 80: 827–41. [DOI] [PubMed] [Google Scholar]
- 2. Yamazaki H, Oshima A, Murakami R et al. A long‐term follow‐up study of patients with gastric cancer detected by mass screening. Cancer 1989; 63: 613–17. [DOI] [PubMed] [Google Scholar]
- 3. Liotta LA, Kohn EC, Petricion EF. Clinical proteomics: personalized molecular medicine. JAMA 2001; 286: 2211–14. [DOI] [PubMed] [Google Scholar]
- 4. Fung ET, Wright GL Jr, Dalmasso EA. Proteomic strategies for biomarker identification: progress and challenges. Curr Opin Mol Ther 2000; 2: 643–50. [PubMed] [Google Scholar]
- 5. Merchant M, Weinberger SR. Recent advancements in surface‐enhanced laser desorption/ionization‐time of flight‐mass spectrometry. Electrophoresis 2000; 21: 1164–77. [DOI] [PubMed] [Google Scholar]
- 6. Chapman K. The ProteinChip Biomarker System from Ciphergen Biosystems: a novel proteomics platform for rapid biomarker discovery and validation. Biochem Soc Trans 2002; 30: 82–7. [DOI] [PubMed] [Google Scholar]
- 7. Petricoin EF, Ardekani AM, Hitt BA et al. Use of proteomics patterns in serum to identify ovarian cancer. Lance 2002; 359: 572–7. [DOI] [PubMed] [Google Scholar]
- 8. Rai AJ, Zhang Z, Rosenzweig J et al. Proteomic approaches to tumor marker discovery. Arch Pathol Lab Med 2002; 126: 1518–26. [DOI] [PubMed] [Google Scholar]
- 9. Li J, Zhang Z, Rosenzweig J et al. Proteomics and bioinformatics approaches for identification of serum biomarkers to detect breast cancer. Clin Chem 2002; 48: 1296–304. [PubMed] [Google Scholar]
- 10. Adam BL, Qu Y, Davis JW et al. Serum protein fingerprinting coupled with a pattern‐matching algorithm distinguishes prostate cancer from benign prostate hyperplasia and healthy men. Cancer Res 2002; 62: 3609–14. [PubMed] [Google Scholar]
- 11. Petricoin EF 3rd, Ornstein DK, Paweletz CP et al. Serum proteomic patterns for detection of prostate cancer. J Natl Cancer Inst 2002; 94: 1576–8. [DOI] [PubMed] [Google Scholar]
- 12. Koopmann J, Zhang Z, White N et al. Serum diagnosis of pancreatic adenocarcinoma using surface‐enhanced laser desorption and ionization mass spectrometry. Clin Cancer Res 2004; 10: 860–8. [DOI] [PubMed] [Google Scholar]
- 13. Zhang Z, Bast RC Jr, Yu Y et al. Three biomarkers identified from serum proteomic analysis for the detection of early stage ovarian cancer. Cancer Res 2004; 64: 5882–90. [DOI] [PubMed] [Google Scholar]
- 14. Poon TC, Yip TT, Chan AT et al. Comprehensive proteomic profiling identifies serum proteomic signatures for detection of hepatocellular carcinoma and its subtypes. Clin Chem 2003; 49: 752–60. [DOI] [PubMed] [Google Scholar]
- 15. Vlahou A, Schellhammer PF, Mendrinos S et al. Development of a novel proteomic approach for the detection of transitional cell carcinoma of the bladder in urine. Am J Pathol 2001; 158: 1491–502. [DOI] [PMC free article] [PubMed] [Google Scholar]
- 16. Rosty C, Christa L, Kuzdzal S et al. Identification of hepatocarcinoma‐intestine‐pancreas/pancreatitis‐associated protein I as a biomarker for pancreatic ductal adenocarcinoma by protein biochip technology. Cancer Res 2002; 62: 1868–75. [PubMed] [Google Scholar]
- 17. Beahrs OH, Hansen DE, Hutter RVP et al. Stomach. In: Manual for Staging of Cancer, 4th edn. Philadelphia: JB Lippincott, 1992: 63. [Google Scholar]
- 18. Gianola D, Perez‐Enciso M, Toro MA. On marker‐assisted prediction of genetic value: beyond the ridge. Genetics 2003; 163: 347–65. [DOI] [PMC free article] [PubMed] [Google Scholar]
- 19. Chen YD, Zheng S, Yu JK et al. Artificial neural networks analysis of surface‐enhanced laser desorption/ionization mass spectra of serum protein pattern distinguishes colorectal cancer from healthy population. Clin Cancer Res 2004; 10: 8380–5. [DOI] [PubMed] [Google Scholar]
- 20. Tang N, Tornatore P, Weinberger SR. Current developments in SELDI affinity technology. Mass Spectrom Rev 2004; 23: 34–44. [DOI] [PubMed] [Google Scholar]
- 21. Eleftherios PD. Mass spectrometry as a diagnostic and a cancer biomarker discovery tool: opportunities and potential limitations. Mol Cell Proteomics 2004; 3: 367–78. [DOI] [PubMed] [Google Scholar]
- 22. Petricoin E III, Liotta LA. Counterpoint: The vision for a new diagnostic paradigm. Clin Chem 2003; 49: 1276–8. [DOI] [PubMed] [Google Scholar]
- 23. Grizzle WE, Adam BL, Bigbee WL et al. Serum protein expression profiling for cancer detection: validation of a SELDI‐based approach for prostate cancer. Dis Markers 200304; 19: 185–95. [DOI] [PMC free article] [PubMed] [Google Scholar]
- 24. Schneider J, Schulze G. Comparison of tumor M2‐pyruvate kinase (tumor M2‐PK), carcinoembryonic antigen (CEA), carbohydrate antigens CA19‐9 and CA72‐4 in the diagnosis of gastrointestinal cancer. Anticancer Res 2003; 23: 5089–93. [PubMed] [Google Scholar]
- 25. Abbasciano V, Levato F, Zavagli G. Specificity of carcinoembryonic antigen, gastrointestinal cancer‐associated antigen, tissue polypeptide antigen, fibrinopeptide a and gamma‐glutamyltransferase in the diagnosis and follow‐up of gastric cancer. Oncology 1988; 45: 159–61. [DOI] [PubMed] [Google Scholar]
- 26. Abbasciano V, Tassinari D, Sartori S et al. Usefulness of coagulation markers in staging of gastric cancer. Cancer Detect Prev 1995; 19: 331–6. [PubMed] [Google Scholar]
- 27. Rahr HB, Sorensen JV, Larsen JF et al. Markers of coagulation and fibrinolysis in portal blood from patients with and without gastric malignancy. Scand J Gastroenterol 1994; 29: 516–21. [DOI] [PubMed] [Google Scholar]
- 28. Abbasciano V, Graziano L, Arcudi D et al. CEA, GICA, TPA, fibrinopeptide‐A, gamma‐GT and gastric cancer. A contribution to the rationalization of a combined assay. Recenti Prog Med 1991; 82: 517–19. [PubMed] [Google Scholar]
- 29. Abbasciano V, Guerra S, Reali MG et al. Pre‐ and postsurgery activation of blood coagulation in gastric and large bowel cancers: diagnostic, therapeutic and prognostic hints. Oncology 1990; 47: 261–6. [DOI] [PubMed] [Google Scholar]
- 30. Diamandis EP. Analysis of serum proteomic patterns for early cancer diagnosis: drawing attention to potential problems. J Natl Cancer Inst 2004; 96: 353–6. [DOI] [PubMed] [Google Scholar]
- 31. Diamandis EP. Re: diagnostic potential of serum proteomic patterns in prostate cancer. J Urol 2004; 171: 1244–5. [DOI] [PubMed] [Google Scholar]
- 32. Sorace JM, Zhan M. A data review and re‐assessment of ovarian cancer serum proteomic profiling. BMC Bioinformatics 2003; 4: 24. [DOI] [PMC free article] [PubMed] [Google Scholar]
- 33. Baggerly KA, Morris JS, Coombes KR. Reproducibility of SELDI‐TOF protein patterns in serum: comparing datasets from different experiments. Bioinformatics 2004; 20: 777–85. [DOI] [PubMed] [Google Scholar]
- 34. Semmes OJ, Feng Z, Adam BL et al. Evaluation of serum protein profiling by surface‐enhanced laser desorption/ionization time‐of‐flight mass spectrometry for the detection of prostate cancer. I. Assessment of platform reproducibility. Clin Chem 2005; 51: 102–12. [DOI] [PubMed] [Google Scholar]
- 35. Ebert MP, Meuer J, Wiemer JC et al. Identification of gastric cancer patients by serum protein profiling. J Proteome Res 2004; 3: 1261–6. [DOI] [PubMed] [Google Scholar]