

Abstract
Young age can be an independent prognostic factor for adverse prognosis in women with breast carcinoma (BC). In younger women, BC exhibited more aggressive pathological features than older women, indicating differences in biology. Frequent alterations in chromosomal (chr.) 3p22.3 in different malignancies indicated the existence of multiple candidate tumor suppressor genes (TSG) in this region, yet its association with BC remains unclear. In an effort to understand the differences in molecular pathogenesis in two age groups of BC, detailed analysis of alterations at chr.3p22.3 region was carried out in 47 early onset (group‐A: ≤40 years) and 59 late‐onset (group‐A: >40 years) BC samples. Deletion mapping of the four candidate TSG, hMLH1, APRG1, ITGA9 and RBSP3/HYA22, located within 1 Mb of chr.3p22.3 showed high deletion in hMLH1 and RBSP3/HYA22 genes. Frequent methylation was also observed in these genes and significantly associated with their deletion. Quantitative messenger RNA (mRNA) expression and immunohistochemical analysis showed down‐regulation of these genes. Alterations (deletion/methylation) of hMLH1 were significantly associated with RBSP3/HYA22 in group‐A (P = 0.02). Significant poor survival in group‐A patients with alterations in hMLH1 and RBSP3/HYA22 and the same in group‐B patients with hMLH1 alterations indicated their importance as prognostic markers. Differential association of alterations of these genes with higher histological grades, more advanced stages and positive lymph node involvement were also seen. Thus, the present study suggests hMLH1 and RBSP3/HYA22 to be candidate TSG associated with development of both early and late‐onset BC undergoing frequent genetic and epigenetic alteration and having significant prognostic implications. (Cancer Sci 2008; 99: 1984–1991)
Breast cancer (BC), is the third most prevalent malignancy and primary cause of death in women worldwide.( 1 ) In India, it accounts for 19% of all cancers among women, and is the second most common cancer when both sexes are considered together, whereas about 23% of eastern Indian women suffer from this disease.( 2 , 3 ) Considering the age at onset of tumor, BC can be classified as early onset (group‐A: ≤40 years) and late‐onset (group‐B: >40 years).( 4 , 5 ) However, the cut‐off value for early onset BC varies among investigators, ranging from 35–50 years.( 6 , 7 ) Despite this discrepancy, younger women with BC exhibit more aggressive pathological features, including large tumor size of higher grade, presence of positive lymph nodes, absence of steroid receptors and high S‐phase fraction, than older women with BC.( 6 , 7 ) Another report showed that, in an Asian population, BC patients below 40 years have tumors with a poorer prognostic profile. However, this did not translate into poorer overall survival and might be attributable to more aggressive adjuvant treatment of younger patients.( 8 ) All these reports suggested early onset BC to be a biologically separate disease that independently predicts more adverse outcomes. Thus, the molecular analysis of BC in the two age groups is essential to ascertain the differences in pathogenesis, if any. Our previous studies on chromosomes (chrs.) 1p/q, 9p/q, 11p/q, 13q and 17p/q have shown differences in pattern of molecular alterations in the two age groups.( 6 , 7 , 9 , 10 ) So, to find out the differences in pathogenesis in early and late‐onset BC, detailed molecular analysis is pertinent.
Cytogenetic analyses detected frequent loss of chromosome 3p (chr.3p) in a variety of malignancies.( 11 , 12 , 13 , 14 , 15 , 16 ) Loss of heterozygosity (LOH) at chrs.3p25, 3p22–24, 3p21.3, 3p21.2–21.3, 3p14.2, 3p14.3 and 3p12 reported in breast cancers suggest the presence of tumor suppressor genes (TSG) within these deleted regions.( 17 , 18 ) Among these deleted regions, chr.3p22.3 harbors multiple candidate TSG viz. hMLH1, APRG1, ITGA9 and RBSP3/HYA22 within a 1‐megabase (Mb) region.
The DNA mismatch repair gene (MMR) hMLH1, located 37 Mb from chr.3p‐ter, was reported to be altered in a variety of malignancies including BC. Varying frequency of mutations (10–47%) and methylation (32–44%) of hMLH1 have been reported in both breast cancer cell lines and primary BC.( 18 , 19 , 20 , 21 , 22 , 23 ) Association between mutation and methylation was seen in sporadic BC resulting in microsatellite instability (MSI).( 19 ) Moreover, loss in expression of hMLH1 in BC with no apparent methylation point towards other alternative mechanisms contributing to loss of function.( 24 ) The APRG1 gene located 0.4 Mb centromeric to hMHL1 has been implicated in cell membrane interactions and reported to be a candidate TSG associated with BC.( 25 ) Another candidate TSG, ITGA9 (integrin α9 subunit) gene located 0.4 Mb further down‐stream of APRG1, is a member of the β1 integrin family expressed by stratified squamous epithelium and associated with cell differentiation and growth.( 26 ) The RBSP3/HYA22 (CTDSPL) gene located 190 kilobase (Kb) downstream of ITGA9 was reported to undergo frequent homozygous (HD) and hemizygous deletion (HED) in various malignancies including BC.( 26 , 27 ) RBSP3/HYA22 is suggested to be a member of a previously uncharacterized family of small C‐terminal domain (CTD) phosphatases that catalyzes the dephosphorylation of Ser 5 within the consensus repeat of the largest RNA polymerase II subunit, thus affecting gene transcription.( 29 ) Missense and nonsense mutations of RBSP3/HYA22 in different tumors have been reported. RBSP3/HYA22 plays a direct role in dephosphorylation of ppRB, presumably leading to blocks in the cell cycle at the G1–S boundary.( 27 ) It is also reported to have tumor suppressive role in both in vitro and in vivo systems.( 27 )
Hence, it is evident that cumulative increase in genetic instability and cellular proliferation could be a consequence of genetic and epigenetic alterations of these genes. Study of coalterations of these genes could be useful in devising a diagnostic and prognostic marker. So, to delineate the molecular pathogenesis of early and late‐onset BC, attempts were made in the present study to analyze the alterations (deletion, methylation and expression) in these genes and correlate them with different clinico‐pathological parameters.
Materials and Methods
Patients, tumor tissues and cell lines. Forty‐seven early‐onset (group‐A) and fifty‐nine late‐onset (group‐B) sporadic BC samples and their corresponding normal tissues or peripheral blood leukocytes (PBL) were randomly collected over a period of 9 years (1999–2007) from 104 unrelated patients undergoing surgery at the hospital of Chittaranjan National Cancer Institute, Kolkata, India and stored at –80°C. Informed consent from patients and Research Ethics Committee of the institute were obtained. All tumors were graded and staged according to International Union Against Cancer (UICC) tumor size, lymph node, metastasis (TNM) classification.( 30 ) Detailed clinico‐pathological histories of the patients are presented in Table 1. Part of the freshly operated tissues was directly collected in TRIzol reagent (Invitrogen, USA) for RNA isolation and the rest for DNA extraction. The BC cell line MCF‐7 was obtained from American Type Culture Collection (ATCC) and grown according to ATCC instructions.
Table 1.
Clinico‐pathological parameters of early and late‐onset breast cancer
| Clinical features | Group A | Group B | ||
|---|---|---|---|---|
| Case | Average age (years) | Case | Average age (years) | |
| Histological type | ||||
| Ductal | 45 | 34 | 59 | 53 |
| Lobular | 2 | 28 | 0 | – |
| Clinical stage | ||||
| Stage I | 1 | 40 | 2 | 48 |
| Stage II | 7 | 33 | 21 | 51 |
| Stage III | 36 | 35 | 33 | 53 |
| Stage IV | 3 | 37 | 3 | 57 |
| Sex | ||||
| Male | 0 | – | 3 | 52 |
| Female | 45 | 35 | 56 | 52 |
| Tumor differentiation | ||||
| Well | 4 | 32 | 8 | 52 |
| Moderate | 32 | 33 | 39 | 47 |
| Poor | 11 | 38 | 12 | 56 |
| Lymph node | ||||
| Positive | 33 | 35 | 48 | 52 |
| Negative | 14 | 31 | 11 | 51 |
Microdissection and DNA extraction. Cryosections (5 µm) were microdissected under a dissecting microscope (Leica MZ 16) using surgical blades to remove contaminant normal cells. Samples containing at least 70–80% tumor cells were taken for DNA isolation via proteinase‐K digestion, followed by phenol/chloroform extraction procedure.( 31 )
Deletion analysis of the chr.3p22.3 region. Standard polymerase chain reaction (PCR) analysis with (γ‐p32) adenosine triphosphate (ATP) end‐labeled forward primer was done using microsatellite markers at chr.3p22.3 intragenic to different candidate genes.( 31 , 32 ) The markers D3S1611 and D3S1007 located intragenic to hMLH1, D3S3623 at APRG1 intron 1–2, D3S3880 at ITGA9 3′untranslated region (UTR) region and D3S4237 at RBSP3/HYA22 3′UTR region (telomeric to centromeric) were taken for analysis. Primers are listed in Supplement Table 1. All markers were selected on the basis of their map positions and heterozygosity (Ensembl release 44; Genome Database). PCR conditions include a 30 s denaturing step at 95°C, 30 s at appropriate annealing temperature (55–60°C) and 1 min at 72°C followed by final extension at 72°C for 7 min. PCR products were electrophoresed in 8 M urea containing 7% denaturing polyacrylamide sequencing gel and autoradiographed.
Multiplex PCR was done to see homozygous/hemizygous (HD/HED) deletion in the non‐informative markers (D3S3880, D3S4237).( 31 , 32 ) The SST (Somatostatin precursor; UniSTS_NUM 49790) microsatellite marker at chr.3q27.3 was used as control (CL) owing to low frequency of alterations seen in BC (data not shown). Primer seqeunces are in Supplement Table 1. The PCR products were run on 2% agarose gel, stained with ethidium bromide and visualized under UV transluminator.
Using a densitometric scanner (Bio‐Rad GS‐800, USA) the number of alleles at LOI (locus of interest) was determined from the signal intensities according to the following formula:
where T = tumor DNA, N = normal DNA, CL = control and LOI = locus of interest.
Allelic values of ≤0.5, 0.9–1.7, ≥1.8 to <5.0 and >5.0 will be considered as homozygous deletion (HD), hemizygous deletion (HED), retention of both alleles (RA) and amplification of the alleles respectively.( 33 )
PCR based methylation sensitive restriction analysis (MSRA). The methylation analysis of hMLH1 and RBSP3/HYA22 gene promoters was carried out by a methylation‐sensitive restriction analysis (MSRA).( 34 ) Approximately, 100 ng of paired DNA samples were individually digested overnight with a methyl‐sensitive restriction enzyme HpaII and its methylation insensitive isoschizomer MspI separately (Roche Diagnostics, Germany). The same digestion mixture was used for PCR analysis of all the genes and controls. Furthermore, mock digestion was carried out with each sample without any restriction enzymes. Primer sequences were: hMLH1, – 670 FP: 5′‐CGCTCGTAGTATTCGTGC‐3′ to – 61 RP: 5′‐ACCTCAGTGCCTCGTGCTCAC‐3′; RBSP3/HYA22, –682 FP: 5′‐ACTCCTCCCCACATCTCTCA‐3′ to – 490 RP: 5′‐CGACACAGGGTGAGTGGAG‐3′ in respect to transcription start site. Promoter region of hMLH1 gene harbored four CCGG‐recognition sites for the above restriction enzymes, whereas there is only one CCGG site in the RBSP3/HYA22 promoter. To avoid false positivity, MSRA was done taking two controls: (i) 445‐bp fragment of the β‐3A adaptin gene (K1: has restriction site both HpaII and MspI enzymes but is never methylated) at chr.5q14.1 was used as digestion control; and (ii) a 229‐bp fragment of the RARβ2 exon‐1 (K2) at chr.3p24.2 was used as integrity control and contains no recognition sites for the above enzymes.( 35 )
Quantitative real‐time PCR (Q‐PCR). The mRNA expression of hMLH1 and RBSP3/HYA22 genes in normal breast tissue (n = 6) and primary BC (n = 14) and one breast cancer cell line (MCF‐7) was analyzed by quantitative real‐time (Q‐PCR). Total RNA was isolated from samples using TRIzol reagent according to the manufacturer's protocol (Ambion, USA). Complementary‐DNA (cDNA) was synthesized from 1 µg total RNA using Random hexamer (Invitrogen, USA) and Superscript III (Invitrogen, USA) according to manufacturer's protocol. PCR was performed in 40 cycles on an ABI Prism 7500 using Power SYBR Green PCR Master Mix (Applied Biosystems, USA) in a final volume of 15 µL. Each sample was run in triplicates and the average value was considered for analysis. Relative quantities (ΔΔCt) were obtained by normalization against human β2‐microglobulin gene.( 36 ) Primers for Q‐PCR were: hMLH1, F.P. 5′‐ttctcaggttatcggagccagcac‐3′; R.P. 5′‐cttcgtcccaattcacctcagtgg‐3′ and RBSP3/HYA22, F.P. 5′‐aggtgaccaaccccaagga‐3′; and R.P. 5′‐tcacggaagcagcagaagaa‐3′.
Immunohistochemistry. Immunostaining of hMLH1 was done in 20 primary BC samples using the avidin–biotin–peroxidase complex (ABC) staining kit according to manufacturers protocol (Santa Cruz Biotechnology, CA, USA). About 3–5 µm paraffin sections were de‐paraffinized, rehydrated and reacted overnight with primary antibodies (rabbit polyclonal immunoglobulin G [IgG] sc‐581 for hMLH1; Santa Cruz, CA, USA) at a dilution of 1:100 at 4°C. Horseradish‐peroxidase (HRP)‐conjugated goat antirabbit secondary antibody (sc‐2004) was added at 1:500 dilutions. The slides were developed using 3–3′ diaminobenzidine (DAB) as the chromogen and counterstained with hematoxylin. The staining intensity (– = negative, + = weak, 2+ = moderate and 3+ = strong) and the percentage of positive cells (– = 0%, + = 1–24%, 2+ = 25–49% and 3+ = 50–100%) were evaluated by two observers independently.( 19 )
Statistical analysis of clinical data. Fisher's exact test was used to determine the association between genetic profile of tumors and different clinico‐pathological features. Survival analysis was performed according to Kaplan–Meier method. Post‐operative overall survival was measured from the date of surgery to the date of last follow‐up or death (up to 5 years). Probability value (P‐value) ≤0.05 was considered statistically significant. All statistical analyses were performed using statistical programs EpiInfo 6.04b and SPSS 10.0 (SPSS, Chicago, IL, USA).
Results
Deletion analysis of chr.3p22.3 region. Overall deletion noted in the entire 1 Mb analyzed region of chr.3p22.3 was seen to be 32% (15/47) in group‐A and 37% (22/59) in group‐B samples. Microsatellite analysis identified deletion in hMLH1, APRG1, ITGA9 and RBSP3/HYA22 genes in both age groups of BC. In group‐A, hMLH1 showed highest 38% (12/32) deletion followed by RBSP3/HYA22 (30%: 14/47), APRG1 (16%: 5/32) and ITGA9 (15%: 7/47). Likewise, in group‐B, 32% (12/38) samples showed deletion in hMLH1 followed by RBSP3/HYA22 (24%: 14/59), ITGA9 (14%: 8/59) and APRG1 (13%: 4/32). Seven BC samples in group‐A (#2737, 983, 5901, 588, 2972 L, 3156, 3266) and six in group‐B (#2587, 148, 1186, 5213, 2766, 563) showed deletion or non‐informativeness (homozygous condition) of the entire studied region indicating loss of the entire region. Five samples in both groups showed homozygous deletion (HD) in RBSP3/HYA22 (1, 2, 3). Microsatellite size alteration (MA) was observed only in 3 out of 106 samples (#5595, 3990, 1273) (Fig. 3b), whereas another sample (#7) showed loss in one allele and microsatellite size alteration of the other allele (LMA) (Fig. 3c). Higher frequency of deletion in hMLH1 and RBSP3/HYA22 in both the age groups compared to APRG1 and ITGA9, indicating that they were the candidate TSG associated with pathogenesis in both age groups of BC.
Figure 1.
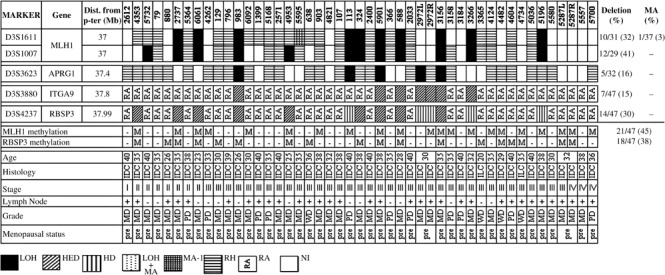
Schematic representation of the pattern of alterations in chromosome 3p22.3 in Early‐Onset (≤40 years) primary breast cancer (BC). LOH, loss of heterozygosity; HED, hemizygous deletion; HD, homozygous deletion; MA‐1, microsatellite size alteration of one allele; LOH + MA, loss of one allele and size alteration of the other; RH, retention of heterozygosity (for informative markers); RA, retention of both alleles (for non‐informative markers); NI, non informative; M, presence of methylation; –, absence of methylation; WD, well differentiated; MD, moderately differentiated; PD, poorly differentiated tumor grades; IDC, invasive ductal carcinoma; ILC, invasive lobular carcinoma; pre, pre‐menopausal; post, post‐menopausal; na, not applicable.
Figure 2.
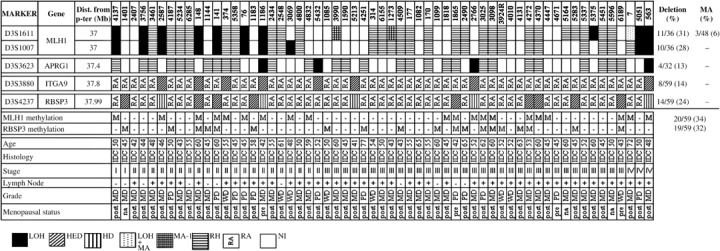
Schematic representation of the pattern of alterations in chromosome 3p22.3 in late‐onset (>40 years) primary breast cancer.
Figure 3.
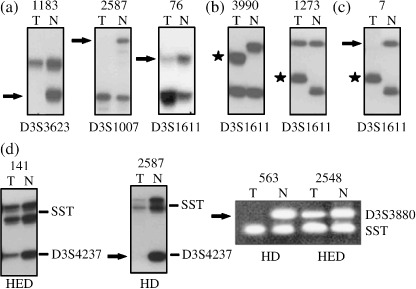
Representative samples showing: (a) LOH, loss of heterozygosity; (b). MA‐1, microsatellite size alteration of one allele; (c). LOH + MA, loss of one allele and size alteration of other; and (d) homozygous/hemizygous deletion (HD/HED). Arrowhead (→) indicates loss of corresponding allele and star ( ) indicates size alteration of one or both alleles.
In both groups, deletion in APRG1, ITGA9 and RBSP3/HYA22 showed significant association (Table 2), whereas hMLH1 deletion showed significant association with other genes in group‐A and with ITGA9 in group‐B.
Table 2.
Association between 4 candidate tumor suppressor genes loci at chr.3p22.3 in early and late‐onset breast cancer
| Group‐A | Group‐B | ||||||||||||||||
|---|---|---|---|---|---|---|---|---|---|---|---|---|---|---|---|---|---|
| hMLH1 | APRGI | ITGA9 | RBSP3 | hMLH1 | APRGI | ITGA9 | RBSP3 | ||||||||||
| D+ | D– | D+ | D– | D+ | D– | D+ | D– | D+ | D– | D+ | D– | D+ | D– | D+ | D– | ||
| hMLH1 | D+ | – | – | 4 | 8 | 6 | 6 | 11 | 1 | – | – | 2 | 10 | 4 | 8 | 5 | 7 |
| D– | 1 | 34 | 1 | 34 | 3 | 32 | 2 | 45 | 4 | 43 | 9 | 38 | |||||
| P‐value | na | 0.003* | 0.0001* | 0.0000001* | na | 0.13 | 0.02* | 0.1 | |||||||||
| APRG1 | D+ | – | – | – | – | 4 | 1 | 5 | 0 | – | – | – | – | 4 | 0 | 3 | 1 |
| D– | 3 | 39 | 9 | 33 | 4 | 51 | 11 | 44 | |||||||||
| P‐value | na | na | 0.00001* | 0.0002* | na | na | 0.0000002* | 0.01* | |||||||||
| ITGA9 | D+ | – | – | – | – | – | – | 7 | 0 | – | – | – | – | – | – | 6 | 2 |
| D– | 7 | 33 | 8 | 43 | |||||||||||||
| P‐value | na | na | na | 0.00001* | na | na | na | 0.0002* | |||||||||
Abbreviations used are: D+: Deletion positive; D–: Deletion negative; *indicates P‐value significance.
Methylation analysis of hMLH1 and RBSP3/HYA22 gene promoters. Methylation analysis of hMLH1 and RBSP3/HYA22 were performed owing to their high frequency of deletion in both age groups. Higher frequency of methylation in hMLH1 promoter was seen in group‐A (45%: 21/47) than group‐B (34%: 20/59). However, comparable frequencies of methylation in RBSP3/HYA22 promoter was observed in both group‐A (38%: 18/47) and group‐B (32%: 19/59) (1, 2, 4). Concomitant methylation in hMLH1 and RBSP3/HYA22 promoters were seen in 11 group‐A and 7 group‐B samples. However, no association was seen between methylation of these two genes in either group.
Figure 4.
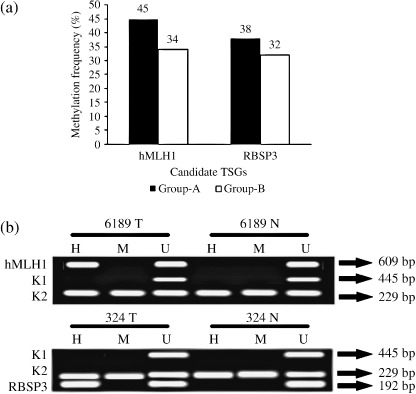
(a) Histogram showing pattern of methylation in hMLH1 and RBSP3/HYA22 in two age groups of breast cancer (BC). (b) Representative agarose gels showing methylation in hMLH1 and RBSP3/HYA22 done by MSRA. H, HpaII digested DNA; M, MspI digested DNA; U, undigested DNA. Controls: A 445‐bp fragment of β3A adaptin gene (K1) and 229‐bp fragment of RARβ2 exon‐1 (K2).
Association between overall alterations of hMLH1 and RBSP3/HYA22. Either deletion or methylation in any one of these genes were seen in about 64% group‐A and 61% group‐B samples, indicating the importance of chr.3p22.3 in the development of BC. Overall alterations (deletion/methylation) of hMLH1 and RBSP3/HYA22 in group‐A were 51% and 49%, respectively, which was comparatively higher than that seen in group‐B (39% each) (Fig. 5). Significant association was seen between overall alterations of hMLH1 and RBSP3/HYA22 in group‐A (P = 0.002). Deletion and methylation in hMLH1 and RBSP3/HYA22 were significantly associated in both group‐A (P = 0.01 and 0.0007) and group‐B (P = 0.01 and 0.02) (Table 3).
Figure 5.
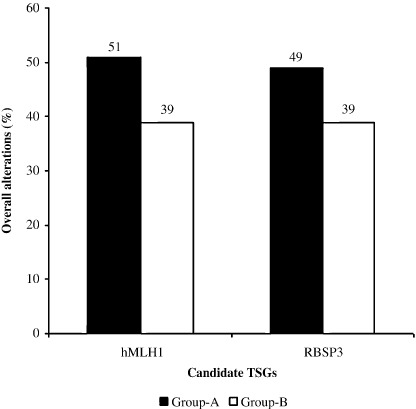
Patten of overall alterations in hMLH1 and RBSP3/HYA22 at chr3p22.3.
Table 3.
Association between deletion and methylation of hMLH1 and HYA22 in two age groups of breast cancer
| Group‐A | Group‐B | ||||||||||||||||
|---|---|---|---|---|---|---|---|---|---|---|---|---|---|---|---|---|---|
| hMLH1 | hMLH1 | RBSP3 | RBSP3 | hMLH1 | hMLH1 | RBSP3 | RBSP3 | ||||||||||
| D+ | D– | M+ | M– | D+ | D– | M+ | M– | D+ | D– | M+ | M– | D+ | D– | M+ | M– | ||
| hMLH1 | D+ | – | – | 9 | 3 | 11 | 1 | 8 | 4 | – | – | 9 | 3 | 5 | 7 | 8 | 4 |
| D– | 12 | 23 | 3 | 32 | 10 | 25 | 11 | 36 | 9 | 38 | 11 | 36 | |||||
| P‐value | na | 0.01* | 0.0000001* | 0.02* | na | 0.0007* | 0.1 | 0.004* | |||||||||
| hMLH1 | M+ | – | – | – | – | 11 | 10 | 11 | 10 | – | – | – | – | 10 | 10 | 7 | 13 |
| M– | 3 | 23 | 7 | 19 | 4 | 35 | 12 | 27 | |||||||||
| P‐value | na | na | 0.002* | 0.07 | na | na | 0.0006* | 0.74 | |||||||||
| RBSP3 | D+ | – | – | – | – | – | – | 9 | 5 | – | – | – | – | – | – | 8 | 6 |
| D– | 9 | 24 | 11 | 34 | |||||||||||||
| P‐value | na | na | na | 0.01* | na | na | na | 0.02* | |||||||||
Abbreviations used are: D+: Deletion positive; D–: Deletion negative; M+: Methylation positive; M–: Methylation negative. *indicates p value significance.
Expression analysis. Q‐PCR analysis of hMLH1 and RBSP3/HYA22 mRNA revealed reduced expression in both the genes. With respect to non‐tumor control, fold reduction in expression in tumors was seen in the following order: hMLH1 (10.4 ± 13.9) and RBSP3/HYA22 (28.9 ± 39.1). Reduced expression was noted in about 33–40% of the tumors, more than the mean fold reduction of the respective genes (Fig. 6). Immunohistochemical analysis revealed intense nuclear localization of hMLH1 protein in samples without any alteration (deletion and/or methylation), whereas moderate to negative expression was observed in samples harboring genetic and/or epigenetic alterations. Expression of hMLH1 protein showed significant concordance with its alteration (deletion/methylation) status (P = 0.0004) (Table 4, Fig. 7). The protein expression of RBSP3/HYA22 was not checked owing to the lack of commercially available antibody.
Figure 6.
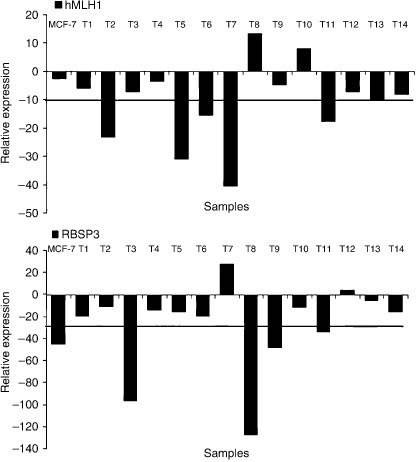
Quantitative real‐time–polymerase chain reaction (RT‐PCR) analysis showing hMLH1 and RBSP3/HYA22 mRNA expression in breast cancer (BC) samples (n = 15). Bars represented the gene expression normalized to β2‐microglobulin and relative to normal counterpart using the 2‐ΔΔCt method as described in Materials and Methods. Bar 1 represents the BC cell line MCF‐7 and bars 2–15 represents breast tumors. Horizontal line indicates the mean fold of reduction of the respective genes.
Table 4.
Immunohistochemical expression status of hMLH1 with respect to alteration (deletion and/or methylation)
| Sample No. | hMLH1 alterationDeletion/Methylation | Expression |
|---|---|---|
| 1186 | +/+ | – |
| 374 | –/+ | – |
| 4187 | –/– | +++ |
| 3266 | +/+ | – |
| 5451 | –/– | +++ |
| 5596 | –/– | +++ |
| 3156 | +/+ | – |
| 324 | +/– | ++ |
| 4131 | +/+ | – |
| 5051 | +/– | – |
| 4124 | –/+ | – |
| 1818 | –/+ | ++ |
| 113 | +/+ | – |
| 314 | –/– | +++ |
| 5732 | +/– | – |
| 1865 | –/+ | – |
| 4671 | –/– | +++ |
| 3025 | –/+ | – |
| 6155 | +/+ | – |
| 5375 | +/– | – |
| P‐value = 0.0004* |
Sample no is patient's registration number.
Figure 7.
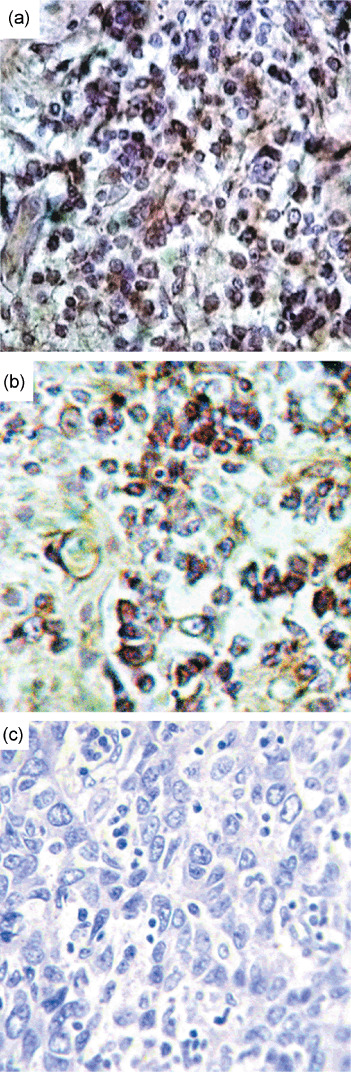
Immunohistochemistry of hMLH1 gene. Breast cancer samples showing high (a) or moderate (b) or low/negative (c) expression of hMLH1 gene. All magnifications are at 20×.
Association with other candidate genes. Among the 106 BC samples, a subset of 29 group‐A and 33 group‐B samples were further studied to find out the association of hMLH1 with other DNA repair genes BRCA1, BRCA2, TP53 and RBSP3/HYA22 with Rb. Deletion status of these genes was published in our previous report.( 9 ) A majority (64–90%) of the samples in either group showed alterations in any one of the DNA repair genes (data not shown). Coincidental alterations of other genes along with hMLH1 alterations were as follows: group‐A: BRCA1 (52%: 15/29); BRCA2 (45%: 13/29); TP53 (28%: 9/29) and group‐B: BRCA1 (27%: 9/33); BRCA2 (21%: 7/33); TP53 (27%: 9/33), indicating involvement of multiple DNA repair pathways. Similar to DNA repair genes, 67–79% samples showed alterations of RBSP3/HYA22 and/or Rb in both age groups, suggesting the importance of this pathway in the development of BC. However, the coincidental alteration of RBSP3/HYA22 and Rb was less frequent (21–27%) in both groups.
Clinico‐pathological association and patient survival. In group‐A, overall alterations of both hMLH1 and RBSP3/HYA22 were significantly associated with higher histological grades (P = 0.03 and 0.004). Moreover, hMLH1 deletion showed significant association with lymph node invasion in group‐A (P = 0.01) and with more advanced stages in group‐B (P = 0.03). On the other hand, methylation of RBSP3/HYA22 showed significant association with higher tumor grades in group‐A (P = 0.002) and lymph node metastasis in group‐B (P = 0.04).
In both age groups of BC, presence of alterations (deletion and/or methylation) in hMLH1 showed significantly poor patient survival as revealed by Kaplan–Meier analysis. Contrastingly, only group‐A patients with alterations in RBSP3/HYA22 had poor disease outcome (Fig. 8).
Figure 8.
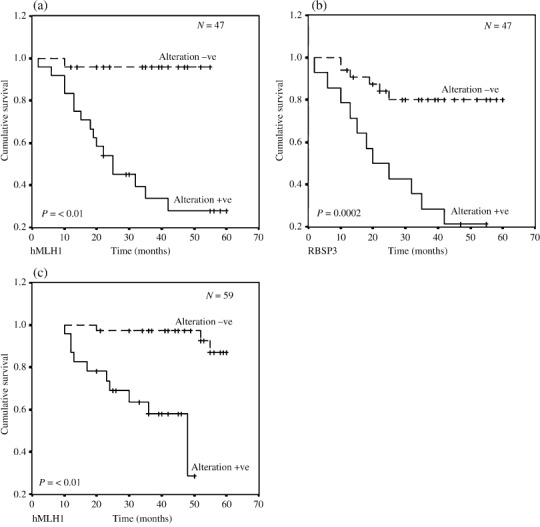
Kaplan–Meier 5‐year survival probability curves with cumulative survival of breast cancer (BC) patients by overall alteration status of (a) hMLH1 and (b) RBSP3/HYA22 in early‐onset BC and (c) only hMLH1 in late‐onset BC. Survival time was defined as the time from surgery to the patient's death, known recurrence or the last time the patient was known to be alive. The log rank test was used to assess the differences in the patient survival between cases with plot for the differences in overall survival among cases with any alteration (Alteration +ve) and no alteration (Alteration –ve) of the analyzed genes. The dotted line represents survival probability without alteration and smooth line represents with alteration probability. N total number of early‐onset BC.
Discussion
Differential pattern of alterations of different chromosomal regions in early and late‐onset BC has been reported in our previous studies.( 6 , 7 , 9 , 10 ) Further study of molecular alterations (deletion/methylation) of the candidate genes at chr.3p22.3 would provide an in‐depth analysis of their association in pathogenesis of the two separate age groups of BC. Overall alterations noted in the entire studied locus were comparable in both age group‐A (64%) and group‐B (61%), indicating the importance of chr.3p22.3 in the development of BC. Among the four candidate TSG studied, deletion frequency of hMLH1 and RBSP3/HYA22 were significantly higher than APRG1 and ITGA9, indicating the importance of the former two genes in the development of BC. In group‐A, both hMLH1 and RBSP3/HYA22 showed higher frequency of overall alterations than in group‐B (Fig. 5). This is the first report of its kind to show differential patterns of alteration in hMLH1 and RBSP3/HYA22 genes in the two age groups of BC.
Significant association between deletion and methylation of hMLH1 and RBSP3/HYA22 in both groups suggested them to be candidate TSG in BC. Concordant down‐regulation of mRNA and protein as a consequence of alterations (deletion/methylation) in these genes further confirmed this contention. Sporadic BC samples having MSI in other chromosomal arms have been reported to show frequent mutation and methylation of the DNA mismatch repair gene hMLH1.( 19 , 37 ) On the contrary, we have seen infrequent MSI in different chromosomal arms in primary BC.( 6 , 7 , 9 , 10 , 38 ) This might be due to differences in etiology, ethnicity and probably methods used in the analysis. Hypermethylation of hMLH1 promoter accounted for the majority of the cases with reduced expression of hMLH1.( 19 , 20 ) A similar result was also observed in the present study. The clinico‐pathological association of hMLH1 with progression and prognosis of BC has not yet been reported. Significant association of hMLH1 deletions with lymph node invasion in group‐A and with advanced stages in group‐B as well as adverse patient outcome with hMLH1 alterations in both age groups indicate hMLH1 to be a good diagnostic and prognostic marker. Moreover, high incidence hMLH1 alterations along with other DNA repair genes like BRCA1/BRCA2 in group‐A suggested altered pathogenesis in the two age groups of BC.
Alterations of another candidate TSG, RBSP3/HYA22 also localized in chr.3p22.3, have been implicated in a number of epithelial malignancies. The primary function of RBSP3/HYA22 is dephosphorylation of phosphorylated retinoblastoma gene (ppRb) thus preventing E2F‐mediated downstream transcriptional signaling, leading to a block of the cell cycle at the G1–S boundary.( 27 , 28 , 29 ) Frequent homozygous (HD) and hemizygous deletion (HED) of this locus have been reported in BC.( 39 ) In acute lymphoid leukemias (ALL) frequent methylation of RBSP3/HYA22 promoter have been reported that correlated with decreased gene expression.( 40 ) However, very few reports exist regarding molecular alterations of RBSP3/HYA22 and its association with BC. We, for the first time, have showed that RBSP3/HYA22 indeed undergoes frequent and differential pattern of alterations in both early and late‐onset BC. Clinico‐pathological studies showed methylation of RBSP3/HYA22 to be significantly associated with higher tumor grades in group‐A and with lymph node invasion in group‐B. The association noted between RBSP3/HYA22 alterations and adverse patient survival in group‐A suggested its usefulness as a prognostic tool in this age group. Moreover, frequent alterations of RBSP3/HYA22 and/or Rb indicated ablation of the RBSP3/HYA22‐Rb‐E2F associated cell cycle pathway in BC.
It is evident from the present study that hMLH1 and RBSP3/HYA22 are frequently altered (deletion/methylation) in primary BC, but are differentially associated in the two age groups. Thus, it is suggested that the dysregulation of the DNA repair pathways and G1–S cell cycle checkpoint might give some selective growth advantage for progression and adverse prognosis of the disease.
Supporting information
Fig. S1 Rate of mortality in breast cancer patients showing inactivation of either or both the hMLH1 and RBSP3/HYA22 genes compared with normal (none of the genes are altered).
Please note: Wiley‐Blackwell are not responsible for the content or functionality of any supporting materials supplied by the authors. Any queries (other than missing material) should be directed to the corresponding author for the article.
Supporting info item
References
- 1. Alberg AJ, Lam AP, Helzlsouer KJ. Epidemiology, prevention, and early detection of breast cancer. Curr Opin Oncol 1999; 11: 435–41. [DOI] [PubMed] [Google Scholar]
- 2. Sen U, Sankaranarayanan R, Mandal S, Ramanakumar AV, Parkin DM, Siddiqi M. Cancer patterns in eastern India: the first report of the Kolkata cancer registry. Int J Cancer 2002; 100: 86–91. [DOI] [PubMed] [Google Scholar]
- 3. Saxena S, Chakraborty A, Kaushal M et al . Contribution of germline BRCA1 and BRCA2 sequence alterations to breast cancer in Northern India. BMC Med Genet 2006; 7: 75. [DOI] [PMC free article] [PubMed] [Google Scholar]
- 4. Albain KS, Allred DC, Clark GM. Breast cancer outcome and predictors of outcome: are there age differentials? J Natl Cancer Inst Monogr 1994; 16: 35–42. [PubMed] [Google Scholar]
- 5. Chung M, Chang HR, Bland KI, Wanebo HJ. Younger women with breast carcinoma have a poorer prognosis than older women. Cancer 1996; 77: 97–103. [DOI] [PubMed] [Google Scholar]
- 6. Chunder N, Mandal S, Basu D, Roy A, Roychoudhury S, Panda CK. Deletion mapping of chromosome 1 in early onset and late onset breast tumors–a comparative study in eastern India. Pathol Res Pract 2003; 199: 313–21. [DOI] [PubMed] [Google Scholar]
- 7. Chunder N, Mandal S, Roy A, Roychoudhury S, Panda CK. Analysis of different deleted regions in chromosome 11 and their interrelations in early‐ and late‐onset breast tumors: association with cyclin D1 amplification and survival. Diagn Mol Pathol 2004; 13: 172–82. [DOI] [PubMed] [Google Scholar]
- 8. Foo CS, Su D, Chong CK et al . Breast cancer in young Asian women: study on survival. ANZ J Surg 2005; 75: 566–72. [DOI] [PubMed] [Google Scholar]
- 9. Chunder N, Mandal S, Roy A, Roychoudhury S, Panda CK. Differential association of BRCA1 and BRCA2 genes with some breast cancer‐associated genes in early and late onset breast tumors. Ann Surg Oncol 2004; 11: 1045–55. [DOI] [PubMed] [Google Scholar]
- 10. Sinha S, Chunder N, Mukherjee N et al . Frequent deletion and methylation in SH3GL2 and CDKN2A loci are associated with early‐ and late‐onset breast carcinoma. Ann Surg Oncol 2008; 15: 1070–80. [DOI] [PubMed] [Google Scholar]
- 11. Kok K, Naylor SL, Buys CH. Deletions of the short arm of chromosome 3 in solid tumors and the search for suppressor genes. Adv Cancer Res 1997; 71: 27–92. [DOI] [PubMed] [Google Scholar]
- 12. Fullwood P, Marchini S, Rader JS et al . Detailed genetic and physical mapping of tumor suppressor loci on chromosome 3p in ovarian cancer. Cancer Res 1999; 59: 4662–7. [PubMed] [Google Scholar]
- 13. Maitra A, Wistuba II, Washington C et al . High‐resolution chromosome 3p allelotyping of breast carcinomas and precursor lesions demonstrates frequent loss of heterozygosity and a discontinuous pattern of allele loss. Am J Pathol 2001; 159: 119–30. [DOI] [PMC free article] [PubMed] [Google Scholar]
- 14. Wistuba II, Montellano FD, Milchgrub S et al . Deletions of chromosome 3p are frequent and early events in the pathogenesis of uterine cervical carcinoma. Cancer Res 1997; 57: 3154–8. [PubMed] [Google Scholar]
- 15. Wistuba II, Behrens C, Milchgrub S et al . Sequential molecular abnormalities are involved in the multistage development of squamous cell lung carcinoma. Oncogene 1999; 18: 643–50. [DOI] [PubMed] [Google Scholar]
- 16. Wistuba II, Behrens C, Virmani AK et al . High resolution chromosome 3p allelotyping of lung cancer and preneoplastic bronchial epithelium reveals multiple sites of 3p allele loss and frequent breakpoints in the 600 kb 3p21.3 region. Cancer Res 2000; 60: 1949–60. [PubMed] [Google Scholar]
- 17. Yang Q, Yoshimura G, Mori I, Sakurai T, Kakudo K. Chromosome 3p and breast cancer. J Hum Genet 2002; 47: 453–9. [DOI] [PubMed] [Google Scholar]
- 18. Stone JG, Coleman G, Gusterson B et al . Contribution of germline MLH1 and MSH2 mutations to lobular carcinoma in situ of the breast. Cancer Lett 2001; 167: 171–4. [DOI] [PubMed] [Google Scholar]
- 19. Murata H, Khattar NH, Kang Y, Gu L, Li GM. Genetic and epigenetic modification of mismatch repair genes hMSH2 and hMLH1 in sporadic breast cancer with microsatellite instability. Oncogene 2002; 21: 5696–703. [DOI] [PubMed] [Google Scholar]
- 20. Murata H, Khattar NH, Gu L, Li GM. Roles of mismatch repair proteins hMSH2 and hMLH1 in the development of sporadic breast cancer. Cancer Lett 2005; 223: 143–50. [DOI] [PubMed] [Google Scholar]
- 21. Seitz S, Wassmuth P, Plaschke J et al . Identification of microsatellite instability and mismatch repair gene mutations in breast cancer cell lines. Genes Chromosomes Cancer 2003; 37: 29–35. [DOI] [PubMed] [Google Scholar]
- 22. Viswanathan M, Solomon SP, Tsuchida N, Selvam GS, Shanmugam G. Methylation of E‐cadherin and hMLH1 genes in Indian sporadic breast carcinomas. Indian J Exp Biol 2006; 44: 115–9. [PubMed] [Google Scholar]
- 23. Naqvi RA, Hussain A, Deo SS et al . Hypermethylation analysis of mismatch repair genes (hmlh1 and hmsh2) in locally advanced breast cancers in Indian women. Hum Pathol 2008. [Epub ahead of print]. [DOI] [PubMed]
- 24. Duriseti S, Winnard PT Jr, Mironchik Y, Vesuna F, Raman A, Raman V. HOXA5 regulates hMLH1 expression in breast cancer cells. Neoplasia 2006; 8: 250–8. [DOI] [PMC free article] [PubMed] [Google Scholar]
- 25. Leris AC, Roberts TR, Jiang WG, Newbold RF, Mokbel K. Evidence for a tumour suppressive function of APRG1 in breast cancer. Breast Cancer Res Treat 2005; 93: 97–100. [DOI] [PubMed] [Google Scholar]
- 26. Häkkinen L, Kainulainen T, Salo T, Grenman R, Larjava H. Expression of integrin alpha9 subunit and tenascin in oral leukoplakia, lichen planus, and squamous cell carcinoma. Oral Dis 1999; 5: 210–7. [DOI] [PubMed] [Google Scholar]
- 27. Kashuba VI, Li J, Wang F et al . RBSP3/HYA22 (RBSP3/HYA22) is a tumor suppressor gene implicated in major epithelial malignancies. Proc Natl Acad Sci USA 2004; 101: 4906–11. [DOI] [PMC free article] [PubMed] [Google Scholar]
- 28. Yeo M, Lin PS, Dahmus ME, Gill GN. A novel RNA polymerase II C‐terminal domain phosphatase that preferentially dephosphorylates serine 5. J Biol Chem 2003; 78: 6078–85. [DOI] [PubMed] [Google Scholar]
- 29. Sobin LH, Wittekind C. TNM Classification of Malignant Tumors, 6th edn. New York: Wiley, 2002. [Google Scholar]
- 30. Dasgupta S, Mukherjee N, Roy S et al . Mapping of candidate tumor suppressor genes’ loci on human chromosome 3 in head and neck squamous cell carcinoma of Indian patient population. Oral Oncol 2002; 38: 6–15. [DOI] [PubMed] [Google Scholar]
- 31. Tripathi Bhar A, Banerjee S, Chunder N et al . Differential alterations of the genes in the CDKN2A–CCND1–CDK4–RB1 pathway are associated with the development of head and neck squamous cell carcinoma in Indian patients. J Can Res Clin Oncol 2003; 129: 642–50. [DOI] [PubMed] [Google Scholar]
- 32. Ichimura K, Bolin MB, Goike HM, Schmidt EE, Moshref A, Collins VP. Deregulation of the p14ARF/MDM2/p53 Pathway Is a Prerequisite for Human Astrocytic Gliomas with G1‐S Transition Control Gene Abnormalities. Cancer Res 2000; 60: 417–24. [PubMed] [Google Scholar]
- 33. Loginov VI, Maliukova AV, Seregin IuA et al . Methylation of the promoter region of the RASSF1A candidate tumor suppressor gene in primary epithelial tumors. Mol Biol 2004; 38: 549–60. [PubMed] [Google Scholar]
- 34. Ivanova T, Petrenko A, Gritsko T et al . Methylation and silencing of the retinoic acid receptor‐β2 gene in cervical cancer. BMC Cancer 2002; 2: 4. [DOI] [PMC free article] [PubMed] [Google Scholar]
- 35. Livak KJ, Schmittgen TD. Analysis of relative gene expression data using real‐time quantitative PCR and the 2(‐Delta Delta C(T)) Method. Methods 2001; 25: 402–8. [DOI] [PubMed] [Google Scholar]
- 36. Köster F, Schröer A, Fischer D, Horn AK, Diedrich K, Friedrich M. Immunohistochemistry of proteins for DNA mismatch repair in correlation to prognostic factors of mammarian cancer. Oncol Rep 2007; 17: 1223–7. [PubMed] [Google Scholar]
- 37. Bhattacharya N, Chunder N, Basu D et al . Three discrete areas within the chromosomal 8p21.3–23 region are associated with the development of breast carcinoma of Indian patients. Exp Mol Pathol 2004; 76: 264–71. [DOI] [PubMed] [Google Scholar]
- 38. Protopopov A, Kashuba V, Zabarovska VI et al . An integrated physical and gene map of the 3.5‐Mb chromosome 3p21.3 (AP20) region implicated in major human epithelial malignancies. Cancer Res 2003; 63: 404–12. [PubMed] [Google Scholar]
- 39. Senchenko VN, Liu J, Loginov W et al . Discovery of frequent homozygous deletions in chromosome 3p21.3 LUCA and AP20 regions in renal, lung and breast carcinomas. Oncogene 2004; 23: 5719–28. [DOI] [PubMed] [Google Scholar]
- 40. Shu J, Jelinek J, Chang H et al . Silencing of bidirectional promoters by DNA methylation in tumorigenesis. Cancer Res 2006; 66: 5077–84. [DOI] [PubMed] [Google Scholar]
Associated Data
This section collects any data citations, data availability statements, or supplementary materials included in this article.
Supplementary Materials
Fig. S1 Rate of mortality in breast cancer patients showing inactivation of either or both the hMLH1 and RBSP3/HYA22 genes compared with normal (none of the genes are altered).
Please note: Wiley‐Blackwell are not responsible for the content or functionality of any supporting materials supplied by the authors. Any queries (other than missing material) should be directed to the corresponding author for the article.
Supporting info item