

Abstract
The advances in preclinical cancer models, including orthotopic implantation models or genetically engineered mouse models of cancer, enable pursuing the molecular mechanism of cancer disease that might mimic genetic and biological processes in humans. Lung cancer is the major cause of cancer deaths; therefore, the treatment and prevention of lung cancer are expected to be improved by a better understanding of the complex mechanism of disease. In this study, we have examined the quantification of two distinct mouse lung cancer models by utilizing imaging modalities for monitoring tumor progression and drug efficacy evaluation. The utility of microcomputed tomography (micro‐CT) for real‐time/non‐invasive monitoring of lung cancer progression has been confirmed by combining bioluminescent imaging and histopathological analyses. Further, we have developed a more clinically relevant lung cancer model by utilizing K‐rasLSL–G12D/p53LSL–R270H mutant mice. Using micro‐CT imaging, we monitored the development and progression of solitary lung tumor in K‐rasLSL–G12D/p53LSL–R270H mutant mouse, and further demonstrated tumor growth inhibition by anticancer drug treatment. These results clearly indicate that imaging‐guided evaluation of more clinically relevant tumor models would improve the process of new drug discovery and increase the probability of success in subsequent clinical studies. (Cancer Sci 2009)
Lung cancer is the leading cause of cancer deaths worldwide;( 1 ) therefore, the treatment and prevention of lung cancer are major unmet needs that could be improved by a better understanding of the molecular process and progression of the disease. Advances in preclinical cancer models including orthotopic implantation models or genetically engineered mouse models (GEMMs) of cancer enable investigation of the molecular mechanism of cancer disease that might better mimic genetic and biological processes in humans than the conventional subcutaneous transplant model.( 2 , 3 ) It has been recently appreciated that the tumor microenvironment plays an important role for cancer cell survival, progression, and acquiring malignant metastatic ability.( 2 , 3 ) Orthotopic tumor implantation models have been considered to reflect the tumor microenvironment; therefore, tumor cells often resemble clinical cancer disease processes.( 4 ) Amongst various cancer GEMMs that have developed to resemble human cancer disease, transgenic expression of an oncogenic mutant K‐ras G12D gene in mouse lung tissues has been known to result in the development of lung adenocarcinoma,( 5 ) and further additional expression of p53 R270H dominant‐negative mutant gene using the Cre‐lox recombinase has been shown to promote K‐rasG12D‐initiated lung cancer development.( 6 ) Despite these advances in preclinical cancer model development, their application to the drug discovery process has often been challenging because of the difficulties in assessing quantitative information for efficacy evaluations of new drug candidates.( 2 , 3 , 7 , 8 )
Imaging technology has been playing a larger role for in vivo real‐time/non‐invasive monitoring of disease progression as well as evaluation of the efficacy of therapeutic approaches in preclinical animal models.( 9 ) Bioluminescence imaging (BLI) takes advantage of the detection of photons emitted by luciferase‐expressing cells in the living animal and has been used for quantitative monitoring of tumor growth or disseminated matastatic disease in deeper tissue with high sensitivity.( 10 , 11 , 12 , 13 , 14 ) Amongst clinical imaging modalities, X‐ray computed tomography (CT) has been demonstrated as a quantitative tool for detecting lung cancer in clinical settings and also in preclinical animal studies. Implementation of micro‐CT has been shown to be a powerful tool to image and quantify pathogenesis in living animal tissues such as lung and bone.( 15 , 16 , 17 , 18 , 19 , 20 , 21 )
In this study, we have examined the quantification of two distinct mouse lung cancer models by utilizing imaging modalities for monitoring tumor progression and drug efficacy evaluation. The applicability of micro‐CT for real‐time/non‐invasive monitoring of lung cancer progression has been confirmed by combining BLI and histopathological analyses. Further, we have developed more clinically relevant lung cancer GEMM by modifying the K‐rasLSL–G12D/p53LSL–R270H mouse model, successfully monitored development and progression of lung tumor, and further demonstrated anticancer drug efficacy by micro‐CT imaging. These results clearly indicate that imaging‐guided evaluation of more clinically relevant tumor models would improve the process of new drug discovery and increase the probability of success in subsequent clinical studies.
Materials and Methods
Animals. Male C57BL/6J mice were purchased from CLEA Japan Inc. (Tokyo, Japan). K‐rasLSL–G12D/p53LSL–R270H (K‐ras/p53) mouse lung tumor development model in mixed 129 and C57BL/6 strains were licensed from Dr T. Jacks's Laboratory (MIT, Cambridge, MA, USA),( 6 ) and mouse colonies were maintained at Charles River Japan. All animal studies were approved by the Banyu Institutional Animal Care and Use Committee.
Cells. Mouse Lewis Lung Carcinoma cell line (3LL) was maintained in RPMI‐1640 medium (Invitrogen, Carlsbad, CA, USA) supplemented with 10% fetal bovine serum.( 4 ) Lentivirus‐luciferase protein (LV‐luc) which carries the expression cassette for luc2 (Promega, Madison, WI, USA) under the SV40 promoter was constructed with pLenti6/V5 (Invitrogen). To establish luciferase‐expressing 3LL cells, cultured cells were infected with LV‐luc at a moi of 500 for overnight in a volume of 500 µL.
Intra‐pulmonary tumor cell implantation. Luciferase‐expressing 3LL cells (3LL‐luc2) were harvested with 0.05% trypsin containing 0.1 mM EDTA (Invitrogen), washed with PBS, and resuspended (5 × 10⁴ cells/mL) in PBS containing 500 µg/mL Matrigel (BD Bioscience, Franklin Lakes, NJ, USA). Intra‐pulmonary implantation procedure has been described previously.( 4 , 22 ) Briefly, C57BL/6 J mice were anesthetized with isoflurane, and a small skin incision on the left chest wall was made. On observing the motion of the left lung, 20 µL of cell suspension were directly injected into the lung with a 29‐gauge needle attached with a 0.3 mL‐syringe (Becton Dickinson, Franklin Lakes, NJ, USA). The skin incision was closed with a surgical skin clip and 3‐mg cefamezine (cephalosporin) was given subcutaneously (Astellas, Tokyo, Japan). Anti‐cancer drug treatments were started on day 7 after implantation of tumor cells. CDDP (cisplatin; randa, 0.5 mg/mL) was purchased from Nippon Kayaku, Tokyo, Japan. Gemcitabine hydrochloride (Gemzar) was purchased from Eli Lilly, Indianapolis, IN, USA. Gemcitabine hydrochloride powder was dissolved with saline to reach a final concentration of 20 mg/mL. Mice were treated by intra peritoneal injection of CDDP (3 mg/kg) and Gemcitabine (60 mg/kg) or CDDP (4 mg/kg) and Gemcitabine (100 mg/kg).
Generation of solitary lung tumors driven by K‐ras/p53 mutation. Solitary lung tumors were initiated by intrapulmonary injection of recombinant adenovirus expressing Cre recombinase (Ade‐Cre) into K‐ras/p53 mice. Mice were anesthetized with isoflurane and a small skin incision was made on the left chest wall. On observing the motion of the left lung, 2 µL of Ade‐Cre (108 plaque‐forming units [pfu]) were directly injected into the lung with a 29‐gauge needle attached with micro syringe controlled by a syringe pump (KD Scientific, Holleston, MA, USA). The skin incision was closed with a surgical skin clip and 3‐mg cefamezine was given subcutaneously. Anticancer drug treatments started at week 11 after Ade‐Cre infection. Mice were treated twice a week (3–4 day interval) by intraperitoneal injection of CDDP (2 mg/kg) for 9 weeks.
In vivo bioluminescent imaging. Bioluminescent imaging was conducted using the IVIS‐200 System (Xenogen, Hopkinton, MA, USA). Prior to acquiring images, 2.5 mg of D‐luciferin (Xenogen) was administered by intraperitoneal injection to all animals. Mice were placed under 3% isoflurane anesthesia which was maintained at 37°C for the duration of image acquisition. Imaging times ranged from 0.5 s to 5 min (binning = 4–8), depending on the total tumor burden as a function of light emission from tumor cells. Animals were positioned on stage within field of view: D. The mice were imaged twice a week; left side and dorsal views facing the camera were acquired. Regions of interest analyses was performed using Living Image 2.50 Software (Xenogen) to determine the light emitted from the chest. For each mouse, all values were determined as photons per s (photon/s).
Microcomputed tomography (micro‐CT). Mice were anesthetized with a continuous flow of 1% to 3% isoflurane/oxygen mixture (2 L/min), and the chest area was able to be imaged at one time using the GE eXplore Locus micro‐CT scanner (GE Healthcare, London, Canada). The isotropic resolution of this instrument is 93 µm. The micro‐CT image acquisition consisted of 400 projections collected in one full rotation of the gantry in approximately 10 min. The image acquisition was not respiratory‐gated. The X‐ray tube settings were 80 kV and 450 µA. The resulting raw data were reconstructed to a final image volume of 875 × 875 × 465 slices at (93 µm)3 voxel dimensions. The reconstructed slices were output in the CT manufacturer's raw format and were corrected equal to Hounsfield units. The reconstructed images were viewed and analyzed using MicroView analysis + version 2.2 software (GE Healthcare). The image analysis method was based on using threshold and region‐grow algorithms to segment the image data and define the separate anatomic structures of interest. As a first step, images were cropped to display the lung region. Then, the total chest space volume, including the heart, was selected using manual segmentation. Next, a histogram of voxel values within the total chest space was plotted. Usually the histogram shows two peaks. The lower peak consists of air space in the lung, and the higher peak consists of the heart, esophagus, bronchi, vascular tissue, and tumor. To separate the two peaks, an optimal threshold value is automatically determined using the function of the MicroView analysis + version 2.2 software. Tumors formed at air space in the lung can be distinguished from other soft‐tissue in a reconstructed 3D image of the higher voxels; therefore, the tumor nodule structure was selected using a combination of manual segmentation and semiautomated contouring of the optimal threshold value. These analyses were generally consistent between two independent operators and performed by a well‐trained researcher in a blinded manner.
Histological analysis. Mice were sacrificed, then the trachea was exposed and the lungs were inflated with 4% paraformaldehide/PBS (PFA). Lung tissues were fixed in PFA overnight and then placed into 70% ethanol before embedding in paraffin blocks. The lung tissue samples were sectioned at 3 µm for placement of slides and stained with hematoxylin–eosin for evaluation of tumor formation.
Statistical analysis. Data are presented as means ± SEM. Either the unpaired Student's t‐test or Kruskal–Wallis test was used to compare two or more than two groups to the vehicle control group, respectively. Values of P < 0.05 were considered statistically significant.
Results
Early non‐invasive monitoring of pulmonary tumor growth in the orthotopic lung cancer implantation model. To explore the applicability of micro‐CT detection as well as the tumor growth kinetics of tumor growth in the lung, we first examined the quantitative monitoring of implanted tumor growth by BLI. 3LL‐luc2 cells were orthotopically implanted by the intrapulmonary injection method, and further solitary lung tumor formation and progression was monitored by BLI to detect photon emission from the luciferase activity of implanted 3LL‐luc2 cells (Fig. 1a,b). Immediately after the intrapulmonary implantation, we detected tumor‐derived photon signals in the lung, and further observed successful tumor growth determined by time‐dependent progression of photon signals (Fig. 1a,b). We also confirmed that the size of solitary lung tumor colonies determined by histophathological analysis and the photon emission from luciferase activity by BLI showed significant correlation (data not shown). These data clearly indicate that the BLI can non‐invasively and accurately monitor the intrapulmonary transplanted tumor growth, even at a very early phase of tumor development (on day 0). With micro‐CT images, the implanted lung tumor burdens were easily distinguished from surrounding normal lung tissues as early as 3 days after the implantation, and further successfully detected solitary tumor growth at the implanted site of lung. Furthermore, three‐dimensional reconstituted images provided the spatial information and size of the implanted tumor (Fig. 1c,d). By analyzing the volume of tumor from micro‐CT images, the pulmonary tumor growth could be visualized, and further positive correlation between BLI and micro‐CT images was observed (Fig. 1e; Spearman r = 0.8333, P < 0.05). Collectively, these results clearly demonstrate the applicability of micro‐CT imaging as non‐invasive and quantitative monitoring tool for lung tumor establishment and subsequent progression in the orthotopic mouse lung cancer model.
Figure 1.
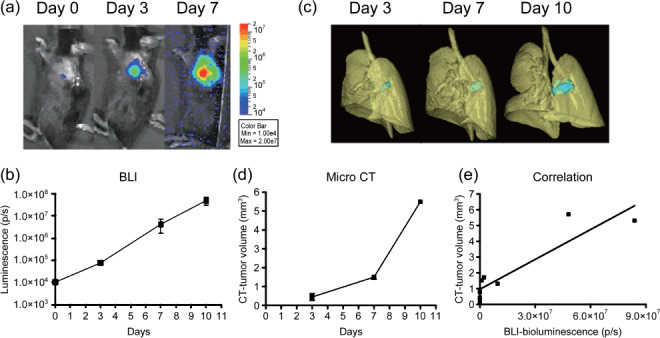
Non‐invasive monitoring of pulmonary tumor growth in an orthotopic lung cancer implantation model. Mice were intrapulmonary inoculated with luciferase‐expressing mouse Lewis Lung Carcinoma cell line (3LL‐luc2) cells (1000 cells in 20 µL volume) on day 0, and then monitored for orthotopic tumor growth by bioluminescence imaging (BLI) (a,b) or microcomputed tomography (micro‐CT) (c,d) on indicated days after tumor inoculation. Images of the 3D‐reconstituted tumor colony are shown in blue. Data represent mean ± SEM. n = 3, except CT images on day 10 (n = 2). (e) Relationship between BLI of tumor and tumor volume reconstituted from micro‐CT images.
Demonstration of anti‐tumor efficacy of standard chemotherapy on orthotopically implanted pulmonary tumor growth by BLI and micro‐CT. To further determine whether micro‐CT imaging detects the effect of anticancer drugs in the orthotopically implanted lung cancer model, we next examined the drug efficacy study treated with the combination of CDDP and gemcitabine as a standard chemotherapy for lung cancer disease. Considering the capability of micro‐CT to detect solitary implanted lung tumors, CDDP and gemcitabine administration (i.p., twice a week) was started 7 days after the intrapulmonary implantation of 3LL‐luc2 cells. As shown in Figure 2, both BLI and micro‐CT imaging successfully detected the growth inhibition effect of combination chemothrerapy compared to control group images. By analyzing photon counts of BLI (Fig. 3a) or volume analysis of micro‐CT images (Fig. 3b), there was a clear trend of dose‐dependent antitumor response with both imaging modalities. These results clearly demonstrate that micro‐CT imaging is capable of detecting antitumor drug efficacy in this pulmonary mouse tumor model as well as BLI. Collectively, present results strongly indicate the advantage of micro‐CT imaging to monitor pulmonary tumor formation and subsequent growth in complex preclinical animal lung cancer models.
Figure 2.
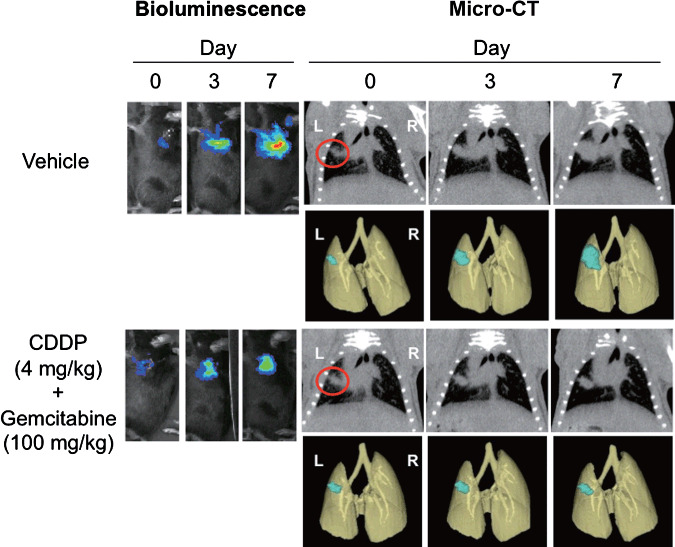
Bioluminescence imaging (BLI) and microcomputed tomography (micro‐CT) images of orthotopically implanted pulmonary tumor growth treated with combination chemotherapy. Mice were intrapulmonary inoculated with luciferase‐expressing mouse Lewis Lung Carcinoma cell line (3LL‐luc2) cells (1000 cells in 20 µL volume) on day 0, and then monitored for orthotopic tumor growth by BLI and micro‐CT. Images of the 3D‐reconstituted tumor colony are shown in blue. Mice were randomly assigned into study groups 7 days after the tumor inoculation and were treated with CDDP (cisplatin)/Gemcitabine. BLI and micro‐CT images were taken on indicated days after tumor inoculation. Representative images of five mice for each group are shown.
Figure 3.
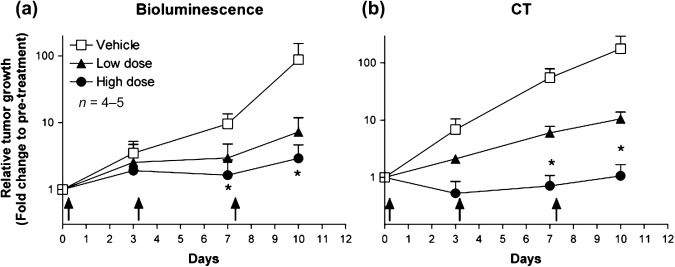
Effect of combination chemotherapy on orthotopically implanted pulmonary tumor growth quantified by bioluminescence imaging (BLI) and microcomputed tomography (micro‐CT). Summary of quantitative analysis of BLI (a) or micro‐CT imaging (b) are shown. Data represent mean ± SEM. Arrows indicate where CDDP (cisplatin)/Gemcitabine were administered. * P < 0.05.
Establishment of genetically engineered mouse solitary lung cancer model and monitoring by micro‐CT imaging. It has previously been reported that conditional oncogenic K‐ras and tumor suppressor p53 mutation successfully mimics human lung cancer pathogenesis in a genetically engineered mouse model.( 6 ) In this model, both conditional expression of LSL‐K‐rasG12D and p53LSL–R270H allele develop malignant lung tumors upon Cre‐mediated recombination by intranasal administration of recombinant adenovirus expressing Ade‐Cre.( 6 , 23 , 24 ) Although this model is thought to be the more clinically relevant mouse model which mimics human lung cancer disease, multiple/disseminated lung tumor formation was introduced by intranasal Ade‐Cre delivery for tumor initiation. To establish a lung cancer model that develops solitary lung tumors driven by K‐ras and p53 mutation, we applied an intrapulmonary Ade‐Cre delivery method to introduce site‐specific Cre recombinase expression in the lung tissue of K‐ras/p53 mice. As shown in Figure 4, intrapulmonary delivery of Ade‐Cre successfully initiated solitary lung tumor development as early as 6 weeks post infection where Ade‐Cre was delivered, and the overall solitary lung tumor development rate was 66.7% (30 mice developed lung tumor colonies from a total of 45 intrapulmonary‐infected mice). More importantly, K‐ras‐ and p53‐mutation‐driven lung tumor can be monitored by micro‐CT in a non‐invasive and real‐time manner (Fig. 4c). These results clearly demonstrate the successful establishment of the K‐ras/p53 driven solitary lung tumor model, and further utility of real‐time lung tumor monitoring by micro‐CT imaging in the K‐ras/p53‐driven genetically engineered tumor model.
Figure 4.
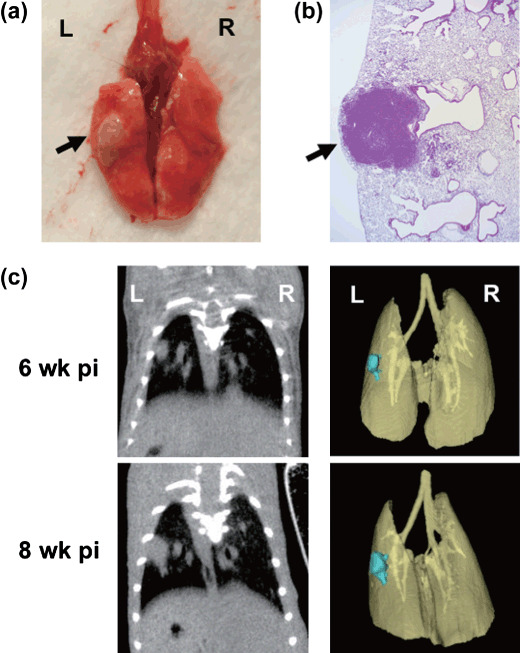
Intrapulmonary recombinant adenovirus expressing Cre recombinase (Ade‐Cre) delivery formed mouse solitary lung cancer in K‐rasLSL–G12D/p53LSL–R270H mice, and real‐time monitoring by micro‐CT imaging. Ade‐Cre (108 pfu in 2 µL volume) was intrapulmonary injected into K‐ras/p53 mice. Representative macroscopic observation of Ade‐Cre‐induced lung solitary tumor (a) and histopathological observation (b) at 10 weeks post infection are shown. Arrows indicate where solitary tumor nodule was observed. Representative 3D‐reconstituted micro‐CT images of solitary lung tumor at 6 or 8 weeks post infection are shown (c). Images of the 3D‐reconstituted tumor colony are shown in blue.
Utility of micro‐CT imaging in an antitumor efficacy study conducted with lung cancer GEMM. Finally, we tested the utility of micro‐CT imaging to detect the effect of anticancer drugs in the K‐ras‐p53‐mutation‐driven gene‐engineered solitary lung cancer model. The cohort of K‐ras/p53 mice was intrapulmonary infected with Ade‐Cre, and then monitored by micro‐CT to detect tumor formation and growth. The group of mice was treated with CDDP (i.p., 2 mg/kg, twice a week) from 11 weeks post Ade‐Cre infection. As shown in Figure 5, micro‐CT imaging successfully detected solitary lung tumor formation driven by Kras/p53 mutation, and further visualized lung tumor growth inhibition upon CDDP treatments compared to the control group. The summary results of tumor volume determined by 3D‐analysis of micro‐CT imaging are shown in Figure 6. The time‐dependent K‐ras/p53‐mutation‐driven lung tumor formation and growth (Fig. 6a) and the inhibition of lung tumor progression by CDDP treatment (Fig. 6b) were successfully determined by analyzing micro‐CT imaging. Collectively, these results further demonstrate the capability of micro‐CT imaging to monitor pulmonary tumor development and progression in the complex genetically engineered animal lung cancer model driven by K‐ras and p53 mutation.
Figure 5.
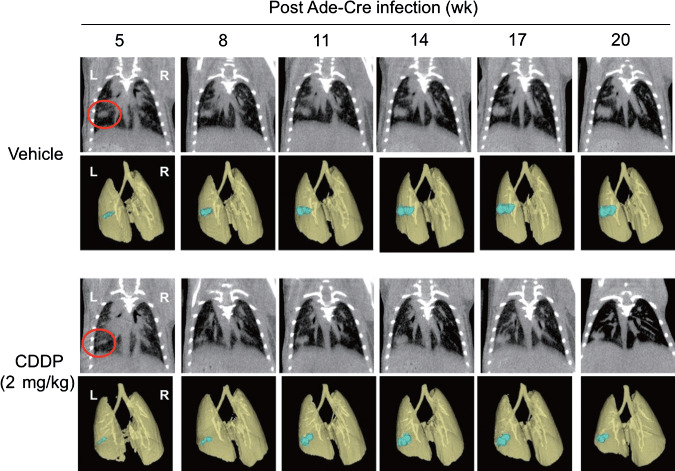
Microcomputed tomography (micro‐CT) images of solitary lung tumor growth in K‐rasLSL–G12D/p53LSL–R270H mice. K‐ras/p53 mice were intrapulmonary infected with recombinant adenovirus expressing Cre recombinase (Ade‐Cre) (108 pfu in 2 µL volume), and then lung solitary tumor development and growth was monitored by micro‐CT. Images of the 3D‐reconstituted tumor colony are shown in blue. Eleven weeks after post Ade‐Cre infection, mice were prescanned by micro‐CT, then randomly assigned into two study groups. The group of mice were treated with saline (i.p., 100 µL) or CDDP (cisplantin) (i.p., 2 mg/kg, twice a week). Micro‐CT images were taken on indicated weeks after Ade‐Cre infection. Representative images of five mice for each group are shown. *P < 0.05.
Figure 6.
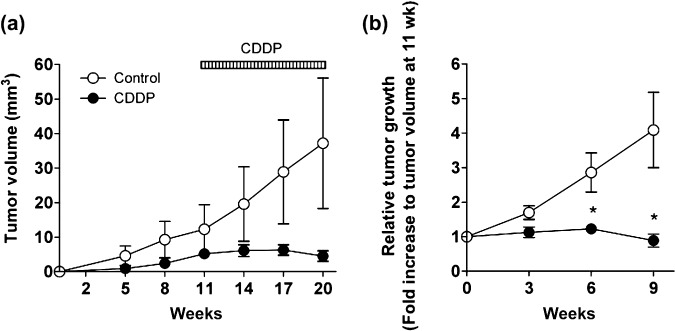
Effect of chemotherapy on solitary lung tumor growth in K‐rasLSL–G12D/p53LSL–R270H mice quantified by microcomputed tomography (micro‐CT). Summary of quantitative analysis of micro‐CT imaging, presented in Figure 5, is shown. (a) The growth curve of lung tumor in K‐ras/p53 mice. (b) Relative tumor size to prescanned tumor (at 11 weeks post recombinant adenovirus expressing Cre recombinase [Ade‐Cre] infection) in K‐ras/p53 mice. Data represent mean ± SEM.
Discussion
Although human tumor xenograft models in immuno‐deficient mice have been considered as standard preclinical animal models by the pharmaceutical industry, more clinically relevant animal models that might mimic the mechanisms of human malignancies are expected to improve the probability of success in the drug discovery process. While orthotopic tumor implantation models that have been considered as implantation models involve more relevant tumor microenvironments in the clinic, GEMMs have been proposed as alternative models to mimic human cancer development and progression in several respects other than implantation models of in vitro cultured cells.( 3 , 7 , 8 ) Although the importance of those more clinically relevant tumor models have been appreciated, the complexity and the difficulties of tumor detection/measurement have often been major issues for their practical application. In the present study, we have utilized in vivo imaging modalities in both the orthotopic lung tumor model and K‐ras/p53‐driven lung cancer GEMM to monitor lung cancer initiation and progression. In addition, we have successfully demonstrated the efficacy of standard chemotherapy in both mouse pulmonary tumor models by using micro‐CT imaging. These results clearly highlight the advantage of imaging guided analysis that makes it possible to prescreen tumor development, select animals with a certain range of tumor size, and follow response to drug treatment. Moreover, such real‐time/non‐invasive imaging of lung cancer would be useful for monitoring the molecular process of tumor initiation and/or progression in whole animal models which mimic the complex tumor microenvironment. In contrast, the micro‐CT application we employed in this study does not distinguish tumor cells and other surrounding tumor stroma tissues such as tumor‐associated vasculature or tumor‐infiltrated immune cells. Particularly, it has been known that K‐rasG12D mutation in the bronchiolar epithelium is associated with a robust inflammatory response characterized by an abundant infiltration of alveolar macrophages and neutrophils,( 25 ) and indeed we observed minor tumor‐associated inflammation in our intrapulmonary infection model compared to the original intranasal infection model (data not shown). The tumor vasculature volume also likely increased along with tumor progression, and non‐contrast‐enhanced CT imaging cannot distinguish between vascular and tumor tissue. Even though we observed neither any significant immune cell infiltration nor tumor angiogenesis in our two distinct lung tumor models in this study, we should carefully interpret micro‐CT imaging data, especially when we test unknown compounds/biologicals that may have an anti‐inflammatory or direct effect on tumor vasculature other than a direct antitumor effect. In conclusion, we have demonstrated a quantitative analysis of two distinct mouse pulmonary tumor models to measure the tumor burden in a real‐time/non‐invasive manner by micro‐CT imaging. We have also developed an oncogenic K‐ras and tumor suppressor p53‐driven lung solitary tumor development model. Together with previous efforts,( 9 , 10 , 11 , 12 , 15 , 16 , 17 , 18 , 20 , 26 ) our current results should enable us to establish more clinically relevant preclinical animal studies to evaluate new therapeutic targets that tackle lung cancer disease.
Acknowledgments
We are grateful to Hisashi Ohta, Satoshi Ozaki, and Hiroharu Arakawa for their discussion. We would like to thank Miyuki Fukushima, Satomi Yoshinaga, Gentaroh Suzuki, and Hiroko Bando for their technical assistance.
References
- 1. Herbst RS, Heymach JV, Lippman SM. Lung cancer. N Engl J Med 2008; 359(13): 1367–80. [DOI] [PMC free article] [PubMed] [Google Scholar]
- 2. Frese KK. Tuveson DA. Maximizing mouse cancer models. Nat Rev Cancer 2007; 7(9): 645–58. [DOI] [PubMed] [Google Scholar]
- 3. Sharpless NE, Depinho RA. The mighty mouse: genetically engineered mouse models in cancer drug development. Nat Rev Drug Discov 2006; 5(9): 741–54. [DOI] [PubMed] [Google Scholar]
- 4. Doki Y, Murakami K, Yamaura T, Sugiyama S, Misaki T, Saiki I. Mediastinal lymph node metastasis model by orthotopic intrapulmonary implantation of Lewis lung carcinoma cells in mice. Br J Cancer 1999; 79(7–8): 1121–6. [DOI] [PMC free article] [PubMed] [Google Scholar]
- 5. Jackson EL, Willis N, Mercer K, et al . Analysis of lung tumor initiation and progression using conditional expression of oncogenic K‐ras. Genes Dev 2001; 15(24): 3243–8. [DOI] [PMC free article] [PubMed] [Google Scholar]
- 6. Jackson EL, Olive KP, Tuveson DA, et al . The differential effects of mutant p53 alleles on advanced murine lung cancer. Cancer Res 2005; 65(22): 10280–8. [DOI] [PubMed] [Google Scholar]
- 7. Olive KP. Tuveson DA. The use of targeted mouse models for preclinical testing of novel cancer therapeutics. Clin Cancer Res 2006; 12(18): 5277–87. [DOI] [PubMed] [Google Scholar]
- 8. Hollingshead MG. Antitumor efficacy testing in rodents. J Natl Cancer Inst 2008; 100(21): 1500–10. [DOI] [PMC free article] [PubMed] [Google Scholar]
- 9. Wessels JT, Busse AC, Mahrt J, Dullin C, Grabbe E, Mueller GA. In vivo imaging in experimental preclinical tumor research – a review. Cytometry A 2007; 71(8): 542–9. [DOI] [PubMed] [Google Scholar]
- 10. Angelucci A, Gravina GL, Rucci N, et al . Evaluation of metastatic potential in prostate carcinoma: an in vivo model. Int J Oncol 2004; 25(6): 1713–20. [PubMed] [Google Scholar]
- 11. Contag CH, Spilman SD, Contag PR, et al . Visualizing gene expression in living mammals using a bioluminescent reporter. Photochem Photobiol 1997; 66(4): 523–31. [DOI] [PubMed] [Google Scholar]
- 12. Edinger M, Sweeney TJ, Tucker AA, Olomu AB, Negrin RS, Contag CH. Noninvasive assessment of tumor cell proliferation in animal models. Neoplasia 1999; 1(4): 303–10. [DOI] [PMC free article] [PubMed] [Google Scholar]
- 13. Jenkins DE, Yu SF, Hornig YS, Purchio T, Contag PR. In vivo monitoring of tumor relapse and metastasis using bioluminescent PC‐3M‐luc‐C6 cells in murine models of human prostate cancer. Clin Exp Metastasis 2003; 20(8): 745–56. [DOI] [PubMed] [Google Scholar]
- 14. Sweeney TJ, Mailander V, Tucker AA, et al . Visualizing the kinetics of tumor‐cell clearance in living animals. Proc Natl Acad Sci U S A 1999; 96(21): 12044–9. [DOI] [PMC free article] [PubMed] [Google Scholar]
- 15. Cavanaugh D, Johnson E, Price RE, Kurie J, Travis EL, Cody DD. In vivo respiratory‐gated micro‐CT imaging in small‐animal oncology models. Mol Imaging 2004; 3(1): 55–62. [DOI] [PubMed] [Google Scholar]
- 16. Cody DD, Nelson CL, Bradley WM, et al . Murine lung tumor measurement using respiratory‐gated micro‐computed tomography. Invest Radiol 2005; 40(5): 263–9. [DOI] [PubMed] [Google Scholar]
- 17. De Clerck NM, Meurrens K, Weiler H, et al . High‐resolution X‐ray microtomography for the detection of lung tumors in living mice. Neoplasia 2004; 6(4): 374–9. [DOI] [PMC free article] [PubMed] [Google Scholar]
- 18. Greschus S, Savai R, Wolf JC, et al . Non‐invasive screening of lung nodules in mice comparing a novel volume tric computed tomography with a clinical multislice CT. Oncol Rep 2007; 17(4): 707–12. [PubMed] [Google Scholar]
- 19. Li XF, Zanzonico P, Ling CC, O'Donoghue J. Visualization of experimental lung and bone metastases in live nude mice by X‐ray micro‐computed tomography. Technol Cancer Res Treat 2006; 5(2): 147–55. [PubMed] [Google Scholar]
- 20. Paulus MJ, Gleason SS, Kennel SJ, Hunsicker PR, Johnson DK. High resolution X‐ray computed tomography: an emerging tool for small animal cancer research. Neoplasia 2000; 2(1–2): 62–70. [DOI] [PMC free article] [PubMed] [Google Scholar]
- 21. Winkelmann CT, Figueroa SD, Rold TL, Volkert WA, Hoffman TJ. Microimaging characterization of a B16–F10 melanoma metastasis mouse model. Mol Imaging 2006; 5(2): 105–14. [PubMed] [Google Scholar]
- 22. Yamaura T, Murakami K, Doki Y, et al . Solitary lung tumors and their spontaneous metastasis in athymic nude mice orthotopically implanted with human non‐small cell lung cancer. Neoplasia 2000; 2(4): 315–24. [DOI] [PMC free article] [PubMed] [Google Scholar]
- 23. Hoess RH, Abremski K. Interaction of the bacteriophage P1 recombinase Cre with the recombining site loxP. Proc Natl Acad Sci U S A 1984; 81(4): 1026–9. [DOI] [PMC free article] [PubMed] [Google Scholar]
- 24. Lakso M, Sauer B, Mosinger B Jr, et al . Targeted oncogene activation by site‐specific recombination in transgenic mice. Proc Natl Acad Sci U S A 1992; 89(14): 6232–6. [DOI] [PMC free article] [PubMed] [Google Scholar]
- 25. Ji H, Houghton AM, Mariani TJ, et al . K‐ras activation generates an inflammatory response in lung tumors. Oncogene 2006; 25(14): 2105–12. [DOI] [PubMed] [Google Scholar]
- 26. Wetterwald APG, Que I, Sijmons B, et al . Optical imaging of cancer metastasis to bone marrow: a mouse model of minimal residual disease. Am J Pathol 2002; 160(3): 1143–53. [DOI] [PMC free article] [PubMed] [Google Scholar]