

Abstract
Pharmacokinetic (PK) factors have been suggested to be involved in the unfavorable clinical responses of chronic myeloid leukemia (CML) patients treated with imatinib. The purpose of this study was to clarify prognostic implications of PK factors in CML patients treated with imatinib. The plasma trough (Cmin) level of imatinib and serum α1‐acid glycoprotein (AGP) level were measured on two different days in 65 CML patients treated with imatinib for more than 12 months. We further examined whether the Cmin level of imatinib actually reflects inhibitory activity against BCR–ABL kinase using the plasma inhibitory activity (PIA) assay. Since the differences of five patients were statistically rejected by the Smirnov–Grubbs’ test, we excluded them for further analysis. The Cmin level was strongly associated with the achievement of MMR at the 12th month, and ROC analysis demonstrated Cmin levels and their discrimination potential for major molecular response (MMR) with the best sensitivity (63.2%) and specificity (68.2%) at a Cmin threshold of 974 ng/mL. The α1‐Acid glycoprotein (AGP) level was within the normal range in 57 of 60 patients, indicating little impact of AGP on our study. There was a weak correlation between PIA against phospho (P)‐BCR–ABL and the Cmin level of imatinib (r 2 = 0.2501, P = 0.0007), and patient plasma containing >974 ng/mL imatinib sufficiently inhibited P‐BCR‐ABL. These results collectively indicated that maintaining ∼1000 ng/mL of Cmin was clinically and biologically important for the optimal response in CML patients treated with imatinib. A prospective intervention study is required to establish PK‐based management in CML patients treated with imatinib. (Cancer Sci 2010)
Imatinib mesylate is a selective BCR–ABL kinase inhibitor, and has demonstrated excellent efficacy in the treatment of chronic myeloid leukemia (CML), particularly in the chronic phase (CP).( 1 ) The international randomized study of interferon and STI571 (IRIS) trial and several subsequent clinical studies have confirmed that imatinib is the first‐line agent for the treatment of newly diagnosed CML patients.( 2 , 3 , 4 , 5 ) Although imatinib reveals a high complete cytogenetic response (CCyR) and major molecular response (MMR) rates in CML patients, a variable time to achieve CCyR and MMR in individual patients has been observed. Furthermore, the accumulation of clinical information in imatinib‐treated patients has disclosed patients with treatment failure or suboptimal response.( 6 , 7 , 8 ) Previous studies demonstrated several mechanisms of imatinib resistance, such as mutation or amplification of the BCR–ABL gene, up‐regulation of P‐glycoprotein, activation of SRC family kinases, and pharmacokinetic (PK) variability.( 5 , 9 , 10 , 11 )
Pharmacokinetic (PK) studies of imatinib in healthy volunteers and CML patients have demonstrated that orally administered imatinib is well absorbed, and has 98% bioavailability, irrespective of the dosage.( 12 , 13 ) However, recent studies revealed that the trough plasma concentration level (Cmin) of imatinib varied in individual patients even at the steady state, and that the Cmin was associated with the clinical response and adverse effects.( 14 , 15 , 16 ) Therefore, the measurement of Cmin is thought to be useful for deciding on a dose escalation to improve the response or a dose reduction to prevent adverse effects during treatment with imatinib.
On the other hand, in vitro studies indicate that imatinib is approximately 95% bound to plasma proteins, mainly albumin and α1‐acid glycoprotein (AGP).( 13 )α1‐Acid glycoprotein (AGP) is a serum acute phase reactant, and is elevated in a variety of physiological and pathological conditions as well as CML, especially in the advanced phase.( 17 )α1‐Acid glycoprotein (AGP) is predominantly synthesized in the liver, and is negatively charged at physiological pH. Although human serum albumin is largely responsible for the binding of acidic acids, AGP mainly binds to basic and neutral drugs. Notably, AGP tightly binds imatinib, resulting in a decreased free and active plasma fraction of imatinib. It has been reported that AGP exerts a significant effect on the intracellular distribution of imatinib in CML patients, resulting in the resistance;( 18 , 19 ) however, another study revealed that AGP purified from the plasma of CML patients did not mediate significant in vitro resistance to imatinib.( 17 ) Since it currently requires great efforts to measure a free or active plasma fraction and an intracellular concentration of kinase inhibitors, the plasma inhibitory activity (PIA), which is determined by the inhibitory activity of plasma obtained from a patient treated with a kinase inhibitor against the target kinase, is reportedly an alternative surrogate marker for evaluating the active fraction level of kinase inhibitors.( 20 )
In this study, we measured the plasma Cmin level of imatinib and serum AGP level on two different days in 65 CML patients who continued to be in CP and were treated with only imatinib for more than 12 months; the correlation among the Cmin level of imatinib, AGP level, and clinical response; and the stability of the Cmin level of imatinib was examined in individual patients. We further examined whether the Cmin level of imatinib actually reflects the inhibitory activity against BCR–ABL kinase by means of the PIA assay.
Materials and Methods
Patients. Sixty‐five CML patients were registered for the blood level testing of imatinib in the Nagoya (BINGO) study. The registration criteria was being in CP, no history of an accelerated phase or blast crisis, administration of imatinib for more than 12 months, and no history of treatment with anti‐CML drugs other than imatinib. We confirmed that no patients took drugs or dietary supplements, or grapefruit juice, which may affect the metabolism of imatinib, within 14 days before peripheral blood (PB) sampling. We also confirmed that no patients had a history of infection and external injury, which may increase the serum AGP level, within 14 days before PB sampling.
Informed consent was obtained from all patients, and this study was approved by the Ethics Committees of the participating hospitals.
Evaluations of clinical response and adverse effects. Cytogenetic response to imatinib was examined by conventional cytogenetic analysis of the bone marrow (BM) metaphase. In some patients, fluorescent in situ hybridization (FISH) analysis for the BCR–ABL fusion gene was performed. To assess the molecular response, the BCR–ABL transcript level was quantitated by real‐time reverse transcriptase‐mediated PCR as previously described.( 21 ) Briefly, total RNA was extracted from the BM or PB sample, and a cDNA was synthesized from each RNA using a random primer. The BCR–ABL transcript level was quantitated using a real‐time fluorescence detection method. The expression level of the GAPDH gene was used for the internal control.
Complete cytogenetic response (CCyR) was defined as no Philadelphia chromosome‐positive cells in BM. Major molecular response (MMR) was defined as a more than 3‐log reduction in the BCR–ABL transcript level or <100 copy/μg RNA of the BCR–ABL transcript.
Adverse effects of imatinib were evaluated according to the National Cancer Institute Common Terminology Criteria for Adverse Events (CTCAE, Bethesda, MD, USA) version 3.0.
Measurement of the trough plasma imatinib concentration and serum AGP level. Peripheral blood (PB) was obtained from the patients within 24 ± 2 h from the last imatinib administration twice on different days. The daily dose of imatinib and the dosing schedule were not changed within 14 days before PB sampling. Plasma and serum were immediately separated at 4°C by centrifugation and preserved at −80°C until measurements. The plasma imatinib concentration was measured at the Toray research Center (Tokyo, Japan) using liquid chromatograpy‐tandem mass spectrometry (API 4000; PE‐Sciex, Toronto, Canada) as previously reported.( 22 ) The internal standard, imatinib mesylate, was provided by Novartis Pharma (Basel, Switzerland), and the assay system was approved by Novartis Pharma.
The serum AGP level was measured at BML (Tokyo, Japan) by nephelometry. Normal plasma and serum were obtained from PB of the authors, and used as a control.
Plasma inhibitory activity (PIA). The BCR–ABL (p210)‐expressing the Ba/F3 (BCR/ABL‐Ba/F3) cell line was a kind gift from Professor Martin Ruthardt, and was maintained in RPMI‐1640 medium (Invitrogen, Carlsbad, CA, USA) supplemented with 10% fetal calf serum (Invitrogen). Imatinib was a kind gift from Novartis Pharma. BCR/ABL‐Ba/F3 cells (2 × 10⁶) were incubated with 1 mL plasma obtained from patients at 37°C for 3 h. At this condition, we confirmed that the viability of BCR/ABL‐Ba/F3 cells was not affected by the incubation with human plasma from healthy donors. The cells were washed twice with ice‐cold PBS and then cell pellets were suspended with lysis buffer. An equal amount of whole cell lysates was separated by SDS‐PAGE, and electroblotted onto Immobilon PVDF membranes (Millipore, Bedford, MA, USA). Immunoblotting was performed with anti‐phospho (P)‐ABL and anti‐P‐STAT5 antibodies (Cell Signaling, Danvers, MA, USA). Signals were developed using an ECL system (GE Healthcare, Uppsala, Sweden). The membranes were incubated with stripping buffer, and then reprobed with anti‐ABL (BD Pharmingen, Franklin Lakes, NJ, USA) and anti‐STAT5 antibodies (Santa Cruz Biotechnology, Santa Cruz, CA, USA). Each band density corresponding to P‐BCR–ABL and total BCR–ABL protein was determined by using ImageJ software (National Cancer Institute, Bethesda, MD, USA). The band density corresponding to P‐BCR–ABL obtained from cells incubated with normal plasma was used as each baseline. The band density of P‐BCR–ABL in each sample was adjusted by the band density of total BCR–ABL. The PIA for a given patient’s plasma was calculated by expressing the density of the P‐BCR–ABL band as a percent decrease from the density of the baseline.
Statistical analysis. Differences in continuous variables were analyzed with Student’s t‐test or the Mann–Whitney U‐test for the distribution between two groups. Frequencies were analyzed using Fisher’s exact test for 2 × 2 tables or Pearson’s chi‐squared test for larger tables. Linear regression was used for the analysis of correlation between two continuous variables. Receiver–operator curve (ROC) analysis was performed to assess the discrimination potential of Cmin of imatinib for MMR. The Smirnov–Grubbs’ test was used for evaluating the outlier. These statistical analyses were performed with the STATA9 software (Stata, College Station, TX, USA). For all analyses, P‐values were two‐tailed, and a P‐value of <0.05 was considered significant.
Results
Individual differences of trough imatinib concentration. We measured the Cmin of imatinib twice on different days in 65 patients. The median duration of two sampling points was 28 days (range, 12–90 days). The mean difference of the Cmin level between two points was 183 ± 176 ng/mL, while five patients showed >400 ng/mL of difference between two points (Fig. 1a). We could not find any factors which would have affected the imatinib Cmin level, such as the last administration time and the administration of other drugs, in any patients; however, we excluded these five patients for further analysis, because their differences were statistically rejected by the Smirnov–Grubbs’ test.
Figure 1.
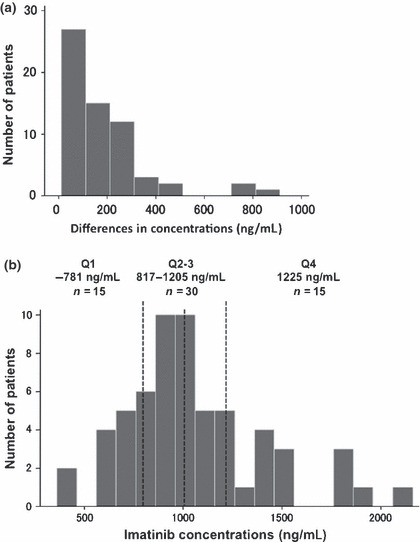
Trough plasma imatinib level in steady‐state chronic myeloid leukemia (CML) patients. (a) Individual differences in Cmin level between two sampling points. Five patients showed >400 ng/mL of difference between two points, and their differences were statistically rejected by the Smirnov–Grubbs’ test. (b) Distribution of Cmin level in 60 CML patients treated with imatinib for more than 12 months. Vertical dashed lines represent the 25th, 50th, and 75th percentile.
Characteristics of patients. Characteristics and clinical response to imatinib of 60 patients are shown in Table 1. The median age was 56 years (range, 26–82 years). The median duration of imatinib administration was 1025 days (range, 370–2434 days). The daily imatinib dose at the sample collection was 200 mg in four patients, 300 mg in nine, 400 mg in 46, and 600 mg in one. In all patients, complete hematological response was achieved before the 12th month and persisted until registration for this study. Major molecular response (MMR), CCyR without MMR, and partial cytogenetic response (PCyR) at the 12th month were observed in 38 (63.3%), 21 (35.0%), and one (1.7%) patients, respectively. The distribution of clinical response according to the daily imatinib dose was not statistically different. Complete cytogenetic response (CCyR) without MMR and MMR as the best response during imatinib treatment were observed in eight (13.3%) and 52 (86.7%) patients, respectively. The distribution of the best response according to the daily imatinib dose was also not statistically different. There were no ≥Grade 3 adverse effects in any patients.
Table 1.
Clinical characteristics of patients
| Total | Daily dose of imatinib | ||||
|---|---|---|---|---|---|
| 200 mg | 300 mg | 400 mg | 600 mg | ||
| Number | 60 | 4 | 9 | 46 | 1 |
| Male/female | 35/25 | 1/3 | 4/5 | 29/17 | 1/0 |
| Age, years (median) | 26–82 (56) | 58–82 (71) | 42–81 (69) | 26–76 (50) | 31 (31) |
| Duration of imatinib, days (median) | 328–2434 (1025) | 701–1726 (1251) | 384–1959 (1366) | 328–2434 (901) | 1626 (1626) |
| Cmin of imatinib, ng/mL (median) | 361–2150 (1003) | 361–1020 (747) | 781–1395 (954) | 450–1875 (1005) | 2150 (2150) |
| AGP, mg/dL (median) | 44–106 (72) | 68–93 (70) | 58–104 (72) | 44–106 (72) | 105 (105) |
| Response at 12 months (%) | |||||
| PCyR | 1 (1.7) | 0 (0) | 0 (0) | 1 (2.2) | 0 (0) |
| CCyR without MMR | 21 (35.0) | 3 (75.0) | 6 (66.7) | 12 (26.1) | 0 (0) |
| MMR | 38 (63.3) | 1 (25.0) | 3 (33.3) | 33 (71.7) | 1 (100) |
| Best response during imatinib treatment (%) | |||||
| CCyR without MMR | 8 (13.3) | 1 (25.0) | 2 (22.2) | 5 (10.9) | 0 (0) |
| MMR | 52 (86.7) | 3 (75.0) | 7 (77.8) | 41 (89.1) | 1 (100) |
Clinical characteristics of chronic myeloid leukemia (CML) patients treated with imatinib for more than 12 months are shown. There was no significant difference in the clinical response among the daily doses of imatinib. AGP, α1‐acid glycoprotein; CCyR, complete cytogenetic response; MMR, major molecular response; PCyR, partial cytogenetic response.
Trough imatinib concentration. The average Cmin of two measurements in each patient was used for further analysis. The median Cmin of imatinib was 1003 ng/mL (range, 361–2150 ng/mL). When patients were divided into quartile groups (Q1–4) based on their Cmin levels, the average of Cmin level of the lowest quartile (Q1) was 718 ng/mL and the highest quartile (Q4) was 1495 ng/mL (Fig. 1b). The Cmin of imatinib was not associated with the age (r 2 = 0.0227, P = 0.0547), the body weight of patients (r 2 = 0.0217, P = 0.4431), the body surface area (BSA) (r 2 < 0.0001, P = 0.8765), and the daily imatinib dose and Cmin (r 2 = 0.1348, P = 0.1011) (Fig. 2). No significant correlation between the Cmin level of imatinib and adverse effects was observed.
Figure 2.
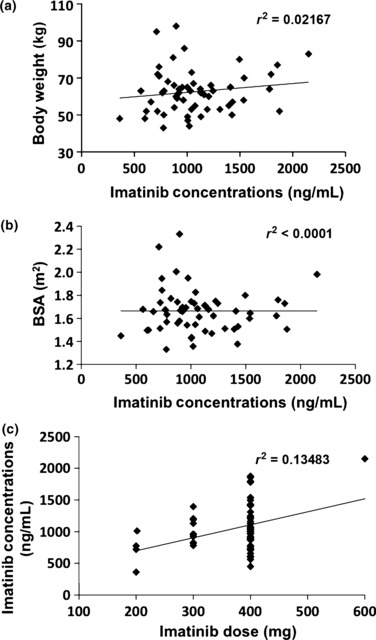
Cmin levels by body weight, body surface area (BSA), and imatinib daily dose. Cmin levels were not correlated with body weight (a), BSA (b), or imatinib daily dose (c).
Correlation of trough imatinib concentration with clinical responses. Thirty‐eight patients achieved MMR at the 12th month (63.3%): six (40.0%) in Q1, 17 (56.7%) in Q2–3, and 15 (100%) in Q4 (P = 0.002) (Table 2). The Cmin levels of imatinib among patients who achieved MMR at the 12th month (n = 38) were significantly higher than those for patients who did not achieve MMR (n = 22): the median values were 1092.5 ng/mL (range, 562–2150 ng/mL) and 853 ng/mL (range, 361–1205 ng/mL), respectively (P = 0.0022, Mann–Whitney U‐test) (Fig. 3a). Concentration‐effect ROC analysis showed the discrimination potential of imatinib Cmin levels for MMR (Fig. 3b). The area under the ROC (AUC) was 0.7386 with the best sensitivity (63.2%) and specificity (68.2%) at a Cmin threshold of 974 ng/mL. As shown in Table 3, when patients were divided into two groups based on the Cmin threshold of 974 ng/mL, MMR at the 12th month was highly achieved in the patients whose Cmin was >974 ng/mL compared to those ≤974 ng/mL: 24 of 31 patients (77.4%) and 14 of 29 patients (48.3%) achieved MMR, respectively (P = 0.019).
Table 2.
Clinical response according to the trough imatinib concentration level
| Quartile 1 | Quartiles 2 and 3 | Quartile 4 | |
|---|---|---|---|
| Number | 15 | 30 | 15 |
| Cmin of imatinib, ng/mL (median) | 361–781 (718) | 817–1205 (1003) | 1225–2150 (1495) |
| Response at 12 months (%) | |||
| PCyR | 1 (6.7) | 0 (0) | 0 (0) |
| CCyR without MMR | 8 (53.3) | 13 (43.3) | 0 (0) |
| MMR | 6 (40.0) | 17 (56.7) | 15 (100) |
| Best response during imatinib treatment (%) | |||
| CCyR without MMR | 5 (33.3) | 3 (10.0) | 0 (0) |
| MMR | 10 (66.7) | 27 (90.0) | 15 (100) |
Clinical response according to the quartile of Cmin level is shown. In the lowest quartile (Q1), the MMR achievement rate was significantly lower than in other quartiles. CCyR, complete cytogenetic response; MMR, major molecular response; PCyR, partial cytogenetic response.
Figure 3.
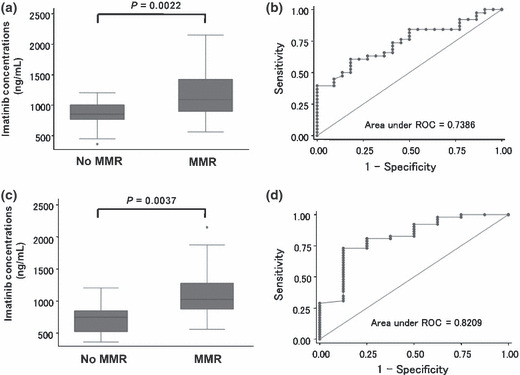
Cmin threshold for major molecular response (MMR). (a) Cmin levels of imatinib among patients who achieved MMR at the 12th month (n = 38) were significantly higher than in patients who did not achieve MMR (n = 22); the median values were 1092.5 ng/mL and 853 ng/mL, respectively (P = 0.0022, Mann–Whitney U‐test). (b) Concentration‐effect ROC analysis of the discrimination potential of imatinib Cmin levels for MMR at the 12th month. The area under the ROC (AUC) was 0.7386 with the best sensitivity (63.2%) and specificity (68.2%) at a Cmin threshold of 974 ng/mL. (c) Cmin levels of imatinib among patients who achieved MMR during treatment (n = 52) were higher than in patients who did not achieve MMR (n = 8); the median values were 1025 ng/mL and 748.5 ng/mL, respectively (P = 0.0037, Mann–Whitney U‐test). (d) Concentration‐effect ROC analysis of the discrimination potential of imatinib Cmin levels for MMR during treatment. The AUC was 0.8209 with the best sensitivity (80.8%) and specificity (75.0%) at a Cmin threshold of 817 ng/mL.
Table 3.
MMR achievement according to the imatinib trough level threshold
| At the 12th month (P = 0.019) | |||
|---|---|---|---|
| Cmin of imatinib (ng/mL) | Total (%) | ||
| ≤974 | >974 | ||
| MMR (%) | 14 (48.3) | 24 (77.4) | 38 (63.3) |
| No MMR (%) | 15 (51.7) | 7 (22.6) | 22 (26.7) |
| Best response during treatment (P = 0.001) | |||
|---|---|---|---|
| Cmin of imatinib (ng/mL) | Total (%) | ||
| ≤817 | >817 | ||
| MMR (%) | 10 (62.5) | 42 (95.5) | 52 (86.7) |
| No MMR (%) | 6 (37.5) | 2 (4.5) | 8 (13.3) |
MMR, major molecular response.
We also examined the correlation of the imatinib Cmin level with MMR as the best response during imatinib treatment. The Cmin levels of imatinib among patients who achieved MMR during treatment (n = 52) were higher than those for patients who did not achieve MMR (n = 8): the median values were 1025 ng/mL (range, 562–2150 ng/mL) and 748.5 ng/mL (range, 361–1205 ng/mL), respectively (P = 0.0037, Mann–Whitney U‐test) (Fig. 3c). Concentration‐effect ROC analysis showed the discrimination potential of imatinib Cmin levels for MMR during treatment (Fig. 3d). The AUC was 0.8209 with the best sensitivity (80.8%) and specificity (75.0%) at a Cmin threshold of 817 ng/mL. As shown in Table 3, when patients were divided into two groups based on the Cmin threshold of 817 ng/mL, MMR during treatment was highly achieved in patients whose Cmin was >817 ng/mL compared to those ≤817 ng/mL: 44 of 42 patients (95.5%) and 10 of 16 patients (62.5%) achieved MMR, respectively (P = 0.001).
Serum AGP level in CML patients treated with imatinib. The serum AGP level was measured twice at the same time when PB was collected for the measurement of plasma imatinib concentration. Since there was no significant difference of serum AGP level in each patient between two sampling points, the average of the two sampling points was used for the AGP level in each patient. The normal range of serum AGP was confirmed to be 42–93 mg/dL in the healthy Japanese population by BML. Although the AGP levels in CML patients treated with imatinib varied from 44 to 106 mg/dL (median, 72 mg/dL), they were within normal limit in 57 of 60 patients (95.0%). There was no significant difference in serum AGP levels among the daily imatinib doses (Table 1).
Plasma inhibitory activity (PIA). Plasma inhibitory activity (PIA) was examined in 51 patients using plasma obtained at the time of sampling for the measurement of imatinib Cmin levels. We first validated our PIA assay system by evaluating dephosphorylation levels of P‐BCR–ABL and P‐STAT5 using six patients’ plasma. As shown in Figure 4(a), 1000 ng/mL imatinib apparently reduced the phosphorylation levels of BCR–ABL and STAT5 in the liquid culture system without human plasma, while the inhibitory activity of patient’s plasma, even that which contained an equivalent concentration of imatinib, was lower than in the liquid culture system. This result indicated that the binding of imatinib to plasma proteins reduced the free or active fraction of imatinib, resulting in lower inhibitory activity than in the conventional in vitro assay.
Figure 4.
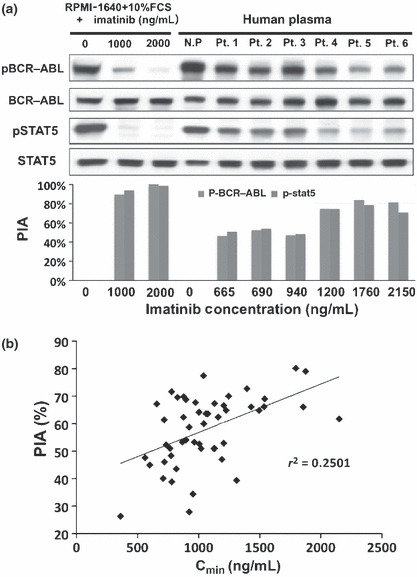
Plasma inhibitory activity (PIA). (a) In the conventional in vitro inhibitory assay without human plasma, 1000 ng/mL imatinib sufficiently reduced the phosphorylation levels of BCR–ABL and STAT5, although the inhibitory activity of patients’ plasma was lower than that of the conventional assay at an equivalent concentration of imatinib. However, PIA apparently increased when the plasma contained >1000 ng/mL imatinib. N.P. indicates normal health donor plasma. Pt. 1 to Pt. 6 were plasma from CML patients treated with imatinib. (b) There was a weak correlation between PIA against P‐BCR–ABL and the Cmin level of imatinib (r 2 = 0.2501, P = 0.0007).
Since PIA against P‐BCR–ABL and P‐STAT5 were observed as the same level in each patient, we examined the correlation between Cmin level of imatinib and PIA against P‐BCR–ABL in all patients. The median PIA against P‐BCR–ABL was 62% (range, 26–80%). There was a weak correlation between PIA against P‐BCR–ABL and the Cmin level of imatinib (r 2 = 0.2501, P = 0.0007) (Fig. 4b); however, western blot analysis showed that PIA activities apparently increased when the plasma contained >1000 ng/mL imatinib (Fig. 4a). Since ROC analysis showed that the efficient Cmin threshold for achieving MMR at the 12th month was 974 ng/mL, we divided patients into two groups based on the threshold. In 27 patients whose Cmin of imatinib was >974 ng/mL, 19 patients (70.4%) showed >62% PIA against P‐BCR–ABL, which was the median PIA. In contrast, seven of 24 patients (29.2%), whose Cmin of imatinib was ≤974 ng/mL, showed more than 62% of PIA (P = 0.003) (Table 4). These results indicated that patient plasma containing imatinib over the efficient threshold for the optimal response could actually inhibit the BCR–ABL activity.
Table 4.
Correlation of plasma imatinib level with PIA
| Cmin of imatinib | Total | PIA against P‐BCR–ABL | |
|---|---|---|---|
| <62% | ≥62% | ||
| ≤974 ng/mL | 24 | 17 (70.8%) | 7 (29.2%) |
| >974 ng/mL | 27 | 8 (29.6%) | 19 (70.4%) |
| Total | 51 | 25 | 26 |
Patient plasma containing >974 ng/mL imatinib revealed higher plasma inhibitory activity (PIA) than those containing ≤974 ng/mL (P = 0.003).
Discussion
Although the excellent efficacy of imatinib against CML has been well established, a suboptimal response or treatment failure is observed in some CML patients. Several factors have been suggested to be involved in these unfavorable clinical responses. Among them, PK‐related factors, which affect exposure to imatinib, are the most important as a host‐dependent factors for treatment with imatinib, because several studies have demonstrated that the steady‐state Cmin level of imatinib correlated with both cytogenetic and molecular responses.( 23 ) Previous reports demonstrated that the Cmin level of imatinib varied greatly even in patients administrated with the same daily dose. For example, Larson et al. ( 14 ) reported that the Cmin level of imatinib for the 400 mg/day dose ranged from 153 to 3910 ng/mL in the International Randomized Study of Interferon and STI571 (IRIS) study; Picard et al. ( 15 ) reported that it ranged from 184 to 2947 ng/mL in the French study; and Sakai et al. ( 16 ) reported that it ranged from 582 to 2420 ng/mL in Japanese patients in the Nagasaki CML study. Several reasons, such as incomplete adherence to imatinib therapy, the demographic factors of patients, differential absorption from the gastrointestinal tract, variability of metabolizing enzyme activity, and differential binding of imatinib to AGP, have been suggested to affect the large variation in the Cmin level.( 13 , 19 , 24 , 25 , 26 , 27 )
Adherence to imatinib therapy should be the first concern when evaluating the clinical significance of the Cmin level, because it has been reported that only 41% of patients were >90% compliant with imatinib over 14 months of treatment.( 23 ) In addition, it is also important whether blood sampling was accurately performed in the trough state. To avoid the effects of adherence factors on the Cmin level, we confirmed that all patients continued to take imatinib as prescribed, and that neither the daily dose nor the dosing‐schedule had been changed within 14 days before blood sampling; however, the Cmin level of imatinib for the 400 mg/day dose varied from 328 to 2463 ng/mL in our study. Since previous studies measured the Cmin level of imatinib only once in each patient, individual variation during treatment was not considered. For the first time, we report individual variation of the Cmin level by measuring twice on different days. It was notable that five of 65 patients revealed >400 ng/mL difference between the two points. Since the differences of these five patients were statistically rejected, we excluded them for further analysis. However, we could not completely determine these individual differences as outliers, because we could not find any factors which may have affected the Cmin level of imatinib, such as the last administration time and the administration of other drugs, in any patients. When these five patients were included in the analysis, the Cmin levels of imatinib among patients who achieved MMR at the 12th month (n = 40) were also significantly higher than those for patients who did not achieve MMR (n = 25): the median values were 1092.5 ng/mL (range, 562–2150 ng/mL) and 896 ng/mL (range, 361–1475 ng/mL), respectively (P = 0.0119, Mann–Whitney U‐test), and ROC analysis demonstrated Cmin levels and their discrimination potential for MMR with the best sensitivity (62.5%) and specificity (64.0%) at a Cmin threshold of 1002 ng/mL. These results collectively indicated that the Cmin level is actually associated with the clinical response in CML patients treated with imatinib; however, repeated measurements are required to amend the daily dose based on the Cmin level.
In this study, we measured the Cmin level of imatinib in the steady‐state after at least 12 months of treatment with imatinib, irrespective of the daily dose, and evaluated its clinical significance retrospectively. Therefore, our results should be carefully interpreted for the clinical application of PK‐based dosage optimization. In our analysis, the Cmin level of imatinib was not significantly correlated with age, sex, body weight, and BSA; and this was anticipated because all patients were being prescribed the optimal dose of imatinib according to their tolerability. In addition, the administration of the optimal dose of imatinib might result in no relationship between the adverse effects and Cmin level. However, the median age of the patient group treated with 200 mg or 300 mg imatinib was older than that of the 400 mg or 600 mg group, indicating the lower tolerability of older patients to standard‐dose imatinib. Since ≥Grade 3 adverse effects were not found in all patients at the registration to this study, we should further compare the Cmin levels in individual patients with or without ≥Grade 3 adverse effects to evaluate the relationship between the adverse effects and Cmin level.
Since our study was retrospectively conducted in patients who were in CP without a history of an accelerated phase or blast crisis, and administrated only imatinib for more than 12 months, most patients who could not achieve optimal response before the 12th month or who were imatinib therapy intolerant, were avoided during study registration, resulting in a higher MMR rate at the 12th month in this study than previous reports.( 3 , 28 , 29 ) However, the Cmin threshold of 974 ng/mL for achieving MMR at the 12th month was almost the same as that of 1002 ng/mL in a previous report.( 15 ) Furthermore, subanalysis of the IRIS study also demonstrated that the mean Cmin of imatinib in patients who achieved CCyR was 1009 ng/mL.( 14 ) These results collectively suggest that maintaining the Cmin of imatinib above ∼1000 ng/mL may be important for achieving the optimal response in CML patients; however, it is difficult to identify the definitive threshold of the Cmin level for clinical use, because the Cmin threshold for achieving MMR as the best response was 817 ng/mL in our analysis. The first analysis of the IRIS study indicated that achieving MMR at the 12th month predicted a better progression‐free survival,( 30 ) while the recent updated analysis showed that MMR predicted for a better 6‐year event‐free survival at the 18th month but not at the 12th month.( 31 ) Unfortunately, we could not determine the Cmin threshold for achieving MMR at the 18th month, because all patients were not evaluated the molecular response at the 18th month. However, since some studies demonstrated the value of MMR at an earlier period of imatinib therapy,( 32 ) we believe that maintaining the Cmin of imatinib ∼1000 ng/mL is a target point for the patients with CML‐CP.
It has been suggested that plasma concentration does not necessarily reflect the free or active form fraction of imatinib, leading to the discrepancy in evaluating clinical response based on the Cmin level. Since a high AGP level reportedly reduces the free or active form fraction of imatinib, the AGP level should be considered when evaluating the correlation between the Cmin level and clinical response. However, in our study, the AGP level in most patients in the steady‐state of imatinib therapy was within the normal range, indicating little impact of AGP on our analysis. In addition to AGP, it has been reported that imatinib binds several plasma proteins, such as albumin, γ‐globulin, high density lipoprotein, and low density lipoprotein, while it has not been fully clarified how this binding affects the free or active fraction of imatinib. Plasma inhibitory activity (PIA) is reported to be an alternative surrogate marker reflecting the actual inhibitory effect in vivo.( 20 ) Notably, our study demonstrated that patient plasma containing >974 ng/mL concentration of imatinib sufficiently inhibited P‐BCR–ABL and P‐STAT5, indicating that the Cmin threshold determined by clinical analysis had been proved biologically.
In conclusion, we confirmed that maintaining ∼1000 ng/mL of Cmin level was clinically and biologically important for the optimal response in CML patients treated with imatinib. On the other hand, we also demonstrated individual variation of the Cmin level even in the steady‐state of imatinib therapy, indicating the importance of repeated measurement of the Cmin level. Although the Cmin level of imatinib reflects the clinical response, it remains unclear whether dose adjustment based on the Cmin level would provide clinical benefits to CML patients, such as increasing the optimal response and decreasing adverse effects. A prospective intervention study is necessary to establish PK‐based management in CML patients treated with imatinib.
Disclosure Statement
Hitoshi Kiyoi received research grants from Novartis Pharma and Kyowa Hakko Kirin Co., Ltd. Tomoki Naoe received research grants from Chugai Pharmaceutical Co., Ltd. and Kyowa Hakko Kirin Co., Ltd. The other authors have no relevant conflicts to disclose.
Acknowledgments
This study was supported by Grants‐in‐Aid from the National Institute of Biomedical Innovation, the Ministry of Health, Labor and Welfare of Japan, Scientific Research of the Ministry of Education, Culture, Sports, Science and Technology of Japan, and Novartis Pharma. We would like to thank Ms Manami Kira for secretarial assistance.
References
- 1. Druker BJ, Talpaz M, Resta DJ et al. Efficacy and safety of a specific inhibitor of the BCR‐ABL tyrosine kinase in chronic myeloid leukemia. N Engl J Med 2001; 344: 1031–7. [DOI] [PubMed] [Google Scholar]
- 2. O’Brien SG, Guilhot F, Larson RA et al. Imatinib compared with interferon and low‐dose cytarabine for newly diagnosed chronic‐phase chronic myeloid leukemia. N Engl J Med 2003; 348: 994–1004. [DOI] [PubMed] [Google Scholar]
- 3. Druker BJ, Guilhot F, O’Brien SG et al. Five‐year follow‐up of patients receiving imatinib for chronic myeloid leukemia. N Engl J Med 2006; 355: 2408–17. [DOI] [PubMed] [Google Scholar]
- 4. Baccarani M, Saglio G, Goldman J et al. Evolving concepts in the management of chronic myeloid leukemia: recommendations from an expert panel on behalf of the European LeukemiaNet. Blood 2006; 108: 1809–20. [DOI] [PubMed] [Google Scholar]
- 5. Goldman JM. How I treat chronic myeloid leukemia in the imatinib era. Blood 2007; 110: 2828–37. [DOI] [PubMed] [Google Scholar]
- 6. Apperley JF. Part II: management of resistance to imatinib in chronic myeloid leukaemia. Lancet Oncol 2007; 8: 1116–28. [DOI] [PubMed] [Google Scholar]
- 7. Baccarani M, Pane F, Saglio G. Monitoring treatment of chronic myeloid leukemia. Haematologica 2008; 93: 161–9. [DOI] [PubMed] [Google Scholar]
- 8. Jabbour E, Hochhaus A, Cortes J, La Rosee P, Kantarjian HM. Choosing the best treatment strategy for chronic myeloid leukemia patients resistant to imatinib: weighing the efficacy and safety of individual drugs with BCR‐ABL mutations and patient history. Leukemia 2010; 24: 6–12. [DOI] [PubMed] [Google Scholar]
- 9. Gorre ME, Mohammed M, Ellwood K et al. Clinical resistance to STI‐571 cancer therapy caused by BCR‐ABL gene mutation or amplification. Science 2001; 293: 876–80. [DOI] [PubMed] [Google Scholar]
- 10. Radich JP, Dai H, Mao M et al. Gene expression changes associated with progression and response in chronic myeloid leukemia. Proc Natl Acad Sci U S A 2006; 103: 2794–9. [DOI] [PMC free article] [PubMed] [Google Scholar]
- 11. Apperley JF. Part I: mechanisms of resistance to imatinib in chronic myeloid leukaemia. Lancet Oncol 2007; 8: 1018–29. [DOI] [PubMed] [Google Scholar]
- 12. Peng B, Hayes M, Resta D et al. Pharmacokinetics and pharmacodynamics of imatinib in a phase I trial with chronic myeloid leukemia patients. J Clin Oncol 2004; 22: 935–42. [DOI] [PubMed] [Google Scholar]
- 13. Peng B, Lloyd P, Schran H. Clinical pharmacokinetics of imatinib. Clin Pharmacokinet 2005; 44: 879–94. [DOI] [PubMed] [Google Scholar]
- 14. Larson RA, Druker BJ, Guilhot F et al. Imatinib pharmacokinetics and its correlation with response and safety in chronic‐phase chronic myeloid leukemia: a subanalysis of the IRIS study. Blood 2008; 111: 4022–8. [DOI] [PubMed] [Google Scholar]
- 15. Picard S, Titier K, Etienne G et al. Trough imatinib plasma levels are associated with both cytogenetic and molecular responses to standard‐dose imatinib in chronic myeloid leukemia. Blood 2007; 109: 3496–9. [DOI] [PubMed] [Google Scholar]
- 16. Sakai M, Miyazaki Y, Matsuo E et al. Long‐term efficacy of imatinib in a practical setting is correlated with imatinib trough concentration that is influenced by body size: a report by the Nagasaki CML Study Group. Int J Hematol 2009; 89: 319–25. [DOI] [PubMed] [Google Scholar]
- 17. Jorgensen HG, Elliott MA, Allan EK, Carr CE, Holyoake TL, Smith KD. Alpha1‐acid glycoprotein expressed in the plasma of chronic myeloid leukemia patients does not mediate significant in vitro resistance to STI571. Blood 2002; 99: 713–15. [DOI] [PubMed] [Google Scholar]
- 18. Gambacorti‐Passerini C, Barni R, Le Coutre P et al. Role of alpha1 acid glycoprotein in the in vivo resistance of human BCR‐ABL(+) leukemic cells to the abl inhibitor STI571. J Natl Cancer Inst 2000; 92: 1641–50. [DOI] [PubMed] [Google Scholar]
- 19. Gambacorti‐Passerini C, Zucchetti M, Russo D et al. Alpha1 acid glycoprotein binds to imatinib (STI571) and substantially alters its pharmacokinetics in chronic myeloid leukemia patients. Clin Cancer Res 2003; 9: 625–32. [PubMed] [Google Scholar]
- 20. Levis M, Brown P, Smith BD et al. Plasma inhibitory activity (PIA): a pharmacodynamic assay reveals insights into the basis for cytotoxic response to FLT3 inhibitors. Blood 2006; 108: 3477–83. [DOI] [PMC free article] [PubMed] [Google Scholar]
- 21. Osumi K, Fukui T, Kiyoi H et al. Rapid screening of leukemia fusion transcripts in acute leukemia by real‐time PCR. Leuk Lymphoma 2002; 43: 2291–9. [DOI] [PubMed] [Google Scholar]
- 22. Bakhtiar R, Lohne J, Ramos L, Khemani L, Hayes M, Tse F. High‐throughput quantification of the anti‐leukemia drug STI571 (Gleevec) and its main metabolite (CGP 74588) in human plasma using liquid chromatography‐tandem mass spectrometry. J Chromatogr B Analyt Technol Biomed Life Sci 2002; 768: 325–40. [DOI] [PubMed] [Google Scholar]
- 23. Cortes JE, Egorin MJ, Guilhot F, Molimard M, Mahon FX. Pharmacokinetic/pharmacodynamic correlation and blood‐level testing in imatinib therapy for chronic myeloid leukemia. Leukemia 2009; 23: 1537–44. [DOI] [PubMed] [Google Scholar]
- 24. O’Brien SG, Meinhardt P, Bond E et al. Effects of imatinib mesylate (STI571, Glivec) on the pharmacokinetics of simvastatin, a cytochrome p450 3A4 substrate, in patients with chronic myeloid leukaemia. Br J Cancer 2003; 89: 1855–9. [DOI] [PMC free article] [PubMed] [Google Scholar]
- 25. Bolton AE, Peng B, Hubert M et al. Effect of rifampicin on the pharmacokinetics of imatinib mesylate (Gleevec, STI571) in healthy subjects. Cancer Chemother Pharmacol 2004; 53: 102–6. [DOI] [PubMed] [Google Scholar]
- 26. Dutreix C, Peng B, Mehring G et al. Pharmacokinetic interaction between ketoconazole and imatinib mesylate (Glivec) in healthy subjects. Cancer Chemother Pharmacol 2004; 54: 290–4. [DOI] [PubMed] [Google Scholar]
- 27. Beumer JH, Natale JJ, Lagattuta TF, Raptis A, Egorin MJ. Disposition of imatinib and its metabolite CGP74588 in a patient with chronic myelogenous leukemia and short‐bowel syndrome. Pharmacotherapy 2006; 26: 903–7. [DOI] [PubMed] [Google Scholar]
- 28. De Lavallade H, Apperley JF, Khorashad JS et al. Imatinib for newly diagnosed patients with chronic myeloid leukemia: incidence of sustained responses in an intention‐to‐treat analysis. J Clin Oncol 2008; 26: 3358–63. [DOI] [PubMed] [Google Scholar]
- 29. Baccarani M, Cortes J, Pane F et al. Chronic myeloid leukemia: an update of concepts and management recommendations of European LeukemiaNet. J Clin Oncol 2009; 27: 6041–51. [DOI] [PMC free article] [PubMed] [Google Scholar]
- 30. Hughes TP, Kaeda J, Branford S et al. Frequency of major molecular responses to imatinib or interferon alfa plus cytarabine in newly diagnosed chronic myeloid leukemia. N Engl J Med 2003; 349: 1423–32. [DOI] [PubMed] [Google Scholar]
- 31. Hughes T, Hochhaus A, Branford S et al. Reduction of BCR‐ABL Transcript Levels at 6, 12, and 18 Months (mo) Correlates with Long‐Term Outcomes on Imatinib (IM) at 72 Mo: an Analysis from the International Randomized Study of Interferon versus STI571 (IRIS) in Patients (pts) with Chronic Phase Chronic Myeloid Leukemia (CML‐CP). Blood 2008; 112: 129–30. [Google Scholar]
- 32. Hughes TP, Branford S, White DL et al. Impact of early dose intensity on cytogenetic and molecular responses in chronic‐ phase CML patients receiving 600 mg/day of imatinib as initial therapy. Blood 2008; 112: 3965–73. [DOI] [PubMed] [Google Scholar]