

Abstract
The objective of the current study was to investigate the expression pattern and clinicopathological significance of SCC‐S2 in patients with non‐small‐cell lung cancer (NSCLC). The expression profile of SCC‐S2 in NSCLC tissues and adjacent noncancerous lung tissues was detected by real‐time RT‐PCR, western blot analysis, and immunohistochemistry. In 25 lung cancer tissues examined, 18 (72%) of them exhibited stronger levels of SCC‐S2 mRNA compared with their corresponding normal tissues. SCC‐S2 protein level was up‐regulated in cancerous lung tissues compared to adjacent normal tissue. Moreover, the expression level of SCC‐S2 in 93 archived NSCLC tissues was measured by immunohistochemical staining. SCC‐S2 was found to be overexpressed in 71 of 93 (76.3%) human lung cancer samples and correlated with lymph node metastasis (P = 0.0181), p‐TNM stage (P = 0.0042), Ki‐67 expression (P = 0.0028), and poor survival (P = 0.012). In addition, depleting SCC‐S2 expression by small‐interfering RNA inhibited growth and invasion in lung cell lines. These results indicate that SCC‐S2 plays an important role in NSCLC and might be a useful therapeutic target of NSCLC. (Cancer Sci 2010)
Lung cancer is the leading cause of death among the malignant tumors worldwide, and the incidence of lung cancer is increasing. Non‐small‐cell lung cancer (NSCLC) is the primary histological classification of lung cancer, and the prognosis of patients with NSCLC principally correlates with tumor metastasis.( 1 , 2 , 3 ) Recent molecular biology studies have revealed that many molecules affect the various biological behaviors of malignant tumors.( 4 , 5 , 6 ) It is therefore considered important to clarify these pro‐metastatic genes in order to improve the clinical outcome of NSCLC patients.
SCC‐S2 (gene symbol TNFAIP8), was originally identified in human metastatic head and neck squamous cell carcinoma (HNSCC) cell lines.( 7 ) Its expression can be induced by tumor necrosis factor‐α (TNF‐α) and by activation of the transcription factor nuclear factor‐kappa B (NF‐κB) in various cells.( 8 , 9 ) Overexpression of SCC‐S2 is associated with enhanced cell survival and inhibition of activities of the apoptotic enzymes caspase‐8 and caspase‐3.( 10 )
SCC‐S2 also functions as an oncogene in human cancers. Human breast cancer cells transfected with SCC‐S2 exhibited increased proliferation, cell migration, and tumor growth rate.( 11 ) In addition, expression of SCC‐S2 cDNA in MDA‐MB 435 human breast cancer cells is associated with enhanced invasion in vitro and increased frequency of pulmonary colonization of tumor cells in athymic mice.( 12 ) The examination of a limited number of breast tumor specimens revealed higher expression levels of SCC‐S2 protein in cancer tissues as compared to the matched normal adjacent tissues.( 11 )
However, despite the increasing emphasis on SCC‐S2 in human tumors, whether it positively participates in primary human NSCLC has not yet been determined. The aim of this study was to investigate the expression and clinical significance of SCC‐S2 in NSCLCs and its correlation to clinicopathological features. In addition, we examined the association of SCC‐S2 expression with the proliferation and metastatic potential of NSCLC cell lines.
Materials and Methods
Patients and specimens. This study was conducted with the approval of the local institutional review board at China Medical University. Primary tumor specimens were obtained from 93 patients (67 males and 25 females) diagnosed with lung squamous cell carcinoma (SCC) and adenocarcinoma who underwent complete resection in the First Affiliated Hospital of China Medical University between 2001 and 2004. Large cell carcinoma, adenosquamous carcinoma, or other NSCLC subtypes were not included in this study. Follow‐up information was obtained from review of the patients’ medical records. None of the patients had received radiotherapy or chemotherapy before surgical resection, and all the patients were treated with routine chemotherapy after the operation. The mean age of the patients was 66 years (range, 36–87 years). The histological diagnosis and grade of differentiation were evaluated using hematoxylin–eosin‐stained sections according to the World Health Organization guidelines of classification. All 93 specimens were re‐evaluated with respect to histological subtype, differentiation, and tumor stage. Squamous cell carcinoma was identified in 45 of the cases, and adenocarcinoma in 48 of the samples. Lymph node metastases were identified in 44 of the 93 patients. The p‐TNM staging system of the International Union Against Cancer (7th edition) was used to classify specimens as stages I (n = 36), II (n = 24), III (n = 26), and IV (n = 7). Twenty‐five fresh specimens including both tumor tissue and corresponding normal tissue were stored at −70°C immediately after resection for extraction of RNA and protein.
Cell lines. A549 and H1299 cell lines were from American Type Culture Collection (Manassas, VA, USA). The cells were cultured in RPMI‐1640 (Invitrogen, Carlsbad, CA, USA) containing 10% fetal calf serum (Invitrogen), 100 IU/mL penicillin (Sigma, St. Louis, MO, USA), and 100 μg/mL streptomycin (Sigma). Cells were grown on sterilized culture dishes and were passaged every 2 days with 0.25% trypsin (Invitrogen).
Immunohistochemistry. Surgically excised tumor specimens were fixed with 10% neutral formalin, embedded in paraffin, and 4‐μm‐thick sections were prepared. Normal bronchial epithelium present in the tumor slides was used as control. Immunostaining was performed using the avidin–biotin–peroxidase complex method (Ultrasensitive; MaiXin, Fuzhou, China). The sections were deparaffinized in xylene, rehydrated with graded alcohol, and then boiled in 0.01M citrate buffer (pH 6.0) for 2 min with an autoclave. Hydrogen peroxide (0.3%) was applied to block endogenous peroxide activity and the sections were incubated with normal goat serum to reduce non‐specific binding. Tissue sections were incubated with SCC‐S2 rabbit polyclonal antibody (1:150 dilution; Abcam, Cambridge, MA, USA) and Ki‐67/MIB‐1 antibody (MaiXin). Mouse immunoglobulin (at the same concentration of the antigen specific antibody) was used as a negative control. Staining for both antibodies was performed at room temperature for 2 h. Biotinylated goat antimouse serum IgG was used as a secondary antibody. After washing, the sections were incubated with streptavidin–biotin conjugated with horseradish peroxidase, and the peroxidase reaction was developed with 3,3′‐diaminobenzidine tetrahydrochloride. Counterstaining with hematoxylin was performed and the sections were dehydrated in ethanol before mounting.
Two independent, blinded investigators (Y.Z. and Y.L.) examined all tumor slides randomly. Five views were examined per slide, and 100 cells were observed per view at ×400 magnification. Immunostaining of SCC‐S2 was scored following a semiquantitative scale (− to ++) by evaluating in representative tumor areas the intensity and percentage of cells showing significantly higher immunostaining than control cells in normal lung tissues. Cytoplasmic immunostaining in tumor cells was considered positive staining. The intensity of SCC‐S2 staining was scored as 0, no signal; 1, weak; 2, moderate; 3, marked. Percentage scores were assigned as 1, 1–25%; 2, 26–50%; 3, 51–75%; and 4, 76–100%. The scores of each tumor sample were multiplied to give a final score of 0 to 12, and the tumors were finally determined as negative expression (−), score ≤4; weak expression (+), score 5–8; high expression (++), score ≥9. Tumor samples scored (+) to (++) were considered positive (overexpression).
The immunohistochemical staining for Ki‐67 was evaluated as the percentage of cancer cells with nuclear immunoreactivity counting at least 1000 tumor cells per slide. The median value of this series (41% of positive cells) was used as the cut‐off value to distinguish tumors with low (<41%) from tumors with high (≥41%) index of cell proliferation.
RNA extraction and real‐time RT‐PCR (Taqman method). Total RNA was extracted from tissue and cells using the RNeasy plus Mini kit from (Qiagen, Hilden, Germany). Reverse transcription of 1 μg of RNA was done using the high capacity cDNA RT kit (Applied Biosystems, Foster City, CA, USA) following the manufacturer’s instructions. Real‐time quantitative PCR (RT‐QPCR) was carried out in an ABI 7900 sequence detector (Applied Biosystems) using Pre‐made Gene Expression Assay (Applied Biosystems) primers and probes for SCC‐S2 (Hs02621508_s1). Levels of SCC‐S2 mRNA are expressed as the ratio versus human β‐actin (Hs99999903_m1) based on the CT (Threshold Cycle) values.
Quantitative real‐time PCR (SYBR Green method). Quantitative real‐time PCR was done using SYBR Green PCR master mix (Applied Biosystems) in a total volume of 20 μL on a 7900HT fast Real‐time PCR system (Applied Biosystems) as follows: 50°C for 2 min, 95°C for 10 min, 40 cycles of 95°C for 15 s, and 60°C for 60 s. The sequences of the primer pairs were as follows: matrix metalloproteinase 1 (MMP‐1) forward, 5′‐ACGAATTTGCCGACAGAGATG‐3′, MMP‐1 reverse, 5′‐GGGT‐ATCCGTGTAGCACATTCT‐3′; vascular endothelial growth factor receptor 2 (VEGFR‐2) forward, 5′‐TTGCAGGACCAAGGAGACTATGT‐3′, VEGFR‐2 reverse, 5′‐TGCCACACGCTCTAGGACTGT‐3′; β‐actin forward, 5′‐ATAGCACAGCCTGG‐ATAGCAACGTAC‐3′, β‐actin reverse, 5′‐CACCTTCTACAA‐TGAGCTGCGTGTG‐3′.
A dissociation procedure was performed to generate a melting curve for confirmation of amplification specificity. β‐Actin was used as the reference gene. The relative levels of gene expression were represented as ΔCt = Ctgene− Ct reference, and the fold change of gene expression was calculated by the 2–ΔΔCt method. Experiments were repeated in triplicate.
Western blot analysis. Total protein from tissue and cells were extracted in lysis buffer (Pierce, Rockford, IL, USA) and quantified using the Bradford method. Fifty micrograms of protein were separated by SDS‐PAGE (12%). After transferring to polyvinylidene fluoride membranes (Millipore, Billerica, MA, USA), the membranes were incubated overnight at 4°C with antibody against SCC‐S2 (1:1000; Abcam), mouse monoclonal antibody against VEGFR‐2 (1:500; Santa Cruz Biotechnology, Santa Cruz, CA, USA), mouse monoclonal antibody against MMP‐1 (1:250; Santa Cruz Biotechnology), rabbit polyclonal antibodies against MMP‐9 (1:500; Abcam), and mouse monoclonal antibody against β‐actin (1:500; Santa Cruz Biotechnology). After incubation with peroxidase‐coupled antimouse IgG (Santa Cruz Biotechnology) at 37°C for 2 h, bound proteins were visualized using ECL (Pierce) and detected using BioImaging Systems (UVP, Upland, CA, USA). The relative protein levels were calculated based on β‐actin protein as a loading control.
Small‐interfering RNA treatment. On‐TargetPlus SMARTpool siRNA for SCC‐S2 (L‐020589‐00) and ON‐TARGETplus Non‐targeting siRNA #1 (D‐001810‐01‐20) were purchased from Dharmacon (Lafayette, CO, USA). For transfections, cells were seeded in a 24‐well plate 24 h before the experiment. The cells were transfected with siRNA using the DharmaFECT 1 (0.20 μL/well; ThermoFisher Scientific, Lafayette, CO, USA) according to the manufacturer’s protocol. Following transfection, the mRNA and protein levels were assessed 48 h later.
Colony formation assay. The A549 and H1299 cells were transfected with negative control or SCC‐S2 siRNA for 48 h. Thereafter, cells were planted into three 6‐cm cell culture dishes (1000 per dish for A549 and H1299 cell lines) and incubated for 12 days. Plates were washed with PBS and stained with Giemsa. The number of colonies with more than 50 cells was counted. The colonies were manually counted by Q.Z.D. using a microscope.
MTT. Cells were plated in 96‐well plates in medium containing 10% FBS at about 3000 cells per well 24 h after transfection. For quantitation of cell viability, cultures were stained after 4 days by using the MTT assay. Briefly, 20 μL of 5 mg/mL MTT (Thiazolyl blue) solution was added to each well and incubated for 4 h at 37°C, then the media was removed from each well, and the resultant MTT formazan was solubilized in 150 μL of DMSO. The results were quantitated spectrophotometrically by using a test wavelength of 490 nm.
Matrigel invasion assay. Cell invasion assay was performed using a 24‐well Transwell chamber with a pore size of 8 μm (Costar, Corning, NY, USA) and the inserts were coated with 20 μL Matrigel (1:3 dilution; BD Bioscience, Bedford, MA, USA). Forty‐eight hours after transfection, A549 or H1299 cells were trypsinized and transferred to the upper Matrigel chamber in 100 μL of serum‐free medium containing 3 × 10⁵ cells and incubated for 16 h. Medium supplemented with 10% FBS was added to the lower chamber as the chemoattractant. Then the non‐invading cells on the upper membrane surface were removed with a cotton tip, and the cells passed through the filter were fixed with 4% paraformaldehyde and stained with hematoxylin. The numbers of invaded cells were counted in 10 randomly selected high power fields under microscope. The experiments were performed in triplicate.
Statistical analysis. SPSS version 11.5 for Windows was used for all analyses (SPSS, Chicago, IL, USA). The χ2‐test was used to examine possible correlations between SCC‐S2 expression and clinicopathologic factors. The Student’s t‐test was used to compare data from the densitometry analysis of foci numbers between control and SCC‐S2‐depleted cells. The Kaplan–Meier method was used to estimate the probability of patient survival, and differences in the survival of subgroups of patients were compared by using Mantel’s log‐rank test. A multivariate analysis was performed using the Cox regression model to study the effects of different variables on survival. All P‐values were based on the two‐sided statistical analysis, and P < 0.05 was considered to indicate statistical significance.
Results
Expression of SCC‐S2 mRNA in clinical tissue specimens. We first quantitatively determined the SCC‐S2 mRNA expression in clinical samples using RT‐QPCR. Eighteen of the 25 patients (72%) showed a higher expression level of SCC‐S2 mRNA in lung cancer tissue specimens than in noncancerous tissue specimens (Fig. 1a). The mean expression value of SCC‐S2 mRNA in cancer tissues (17.11 ± 13.53; mean ± SD, normalized by β‐actin gene expression), was significantly higher than the value (8.90 ± 2.94) in the corresponding noncancerous tissues (P < 0.001, Student’s t‐test).
Figure 1.
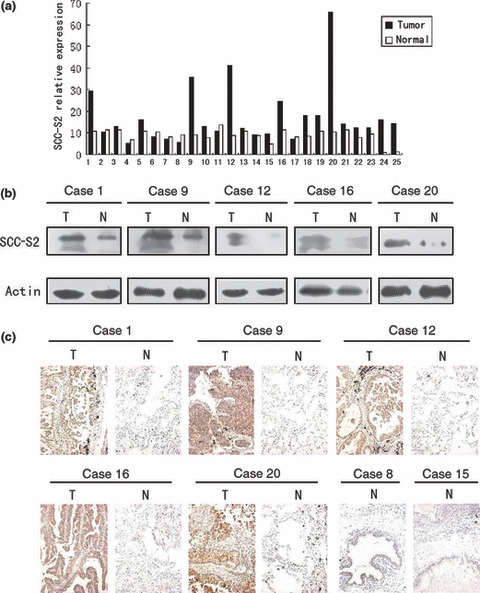
The expression of SCC‐S2 in primary non‐small‐cell lung cancer tissues (T) and in adjacent noncancerous lung tissues (N) from the same patient. (a) Real‐time PCR analyses of SCC‐S2 mRNA in primary lung cancers and their adjacent normal tissues. Squamous cell carcinoma included cases 2, 3, 5, 7, 8, 9, 11, 13, 14, 15, 19, 22. Adenocarcinoma included cases 1, 4, 6, 10, 12, 16, 17, 18, 20, 21, 23, 24, 25. (b) Expression of SCC‐S2 protein in each of the primary lung tumors (T) and normal lung tissues (N) paired from the same patient by western blotting. (c) SCC‐S2 expression levels were up‐regulated in primary lung cancers (T) in comparison to the paired normal lung tissue (N) from the same patient as examined by immunohistochemistry. SCC‐S2 immunostaining was negative or was detected weakly in adjacent normal bronchial epithelia.
To investigate whether the difference in SCC‐S2 expression between tumorous and non‐tumorous samples was reflected at the protein level, we analysed five representative paired samples (tumor tissue and adjacent normal tissue from the same patient) by western blotting and immunohistochemistry. As shown in Figure 1(b,c), the SCC‐S2 protein level was up‐regulated in cancerous lung tissues compared to adjacent normal tissue. Taken together, these results obtained from clinical samples confirmed that higher levels of SCC‐S2 were expressed in cancer lesions than in surrounding tumor adjacent regions.
Clinical significance of SCC‐S2 protein expression in NSCLCs. We further performed immunohistochemistry in 93 NSCLC specimens and their corresponding normal tissues and found that SCC‐S2 was overexpressed in 71 tumor samples. The SCC‐S2 protein appeared to be expressed cytoplasmic components of tumor cells (Fig. 2), while the adjacent normal bronchial epithelia exhibited negative or weak SCC‐S2 staining.
Figure 2.
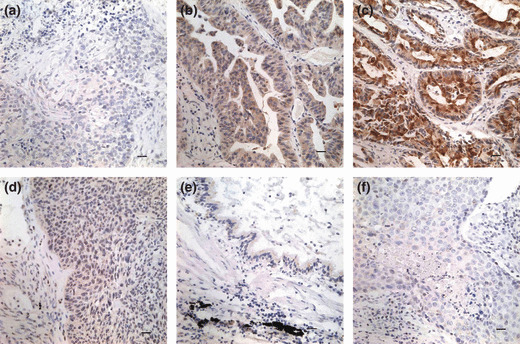
Immunohistochemical staining of SCC‐S2 in lung cancer tissue sections. (a) Negative staining in lung squamous cell carcinoma (−). (b) Positive immunostaining in lung adenocarcinoma (+), SCC‐S2 was localized mainly in the cytoplasm of cancer cells. (c) Strong SCC‐S2 staining in adenocarcinoma (++). (d) Weak SCC‐S2 immunostaining in lung squamous cell carcinoma. (e) SCC‐S2 was negative or was detected weakly in adjacent normal bronchial epithelia. (f) Negative controls were prepared by non‐immune rabbit IgG at the same dilution as for the primary antibody in tumor sample.
As shown in Table 1, no statistical difference was found between positive SCC‐S2 expression and the characteristics of tumor status (T1 vs T2–T4, P = 0.519), as well as differentiation (well vs moderate and poor, P = 0.2820). A significant difference of SCC‐S2 positive rate was found between the two histological types of lung cancer (P = 0.0172). Patients with positive SCC‐S2 expression had advanced stage NSCLC (I + II vs III + IV, P = 0.0042). In addition to promotion of cell proliferation, SCC‐S2 can also increase the invasiveness and migration of tumor cells. Therefore, the association between SCC‐S2 expression revealed by immunohistochemistry and the presence of lymph node metastasis at the time of resection was analyzed. SCC‐S2 immunoreactivity was higher in the NSCLCs with lymph node metastasis compared with the node‐negative cases. Immunohistochemistry showed a statistically significant correlation between higher protein expression and positive nodal status (P = 0.0181). We also investigated the relation between SCC‐S2 expression and proliferating activity of NSCLC by examining the expression of Ki‐67/MIB‐1 by immunohistochemistry. Cases that had high levels of SCC‐S2 expression also had strong Ki‐67 signals (P = 0.0028) (Fig. 3, Table 1).
Table 1.
Distribution of SCC‐S2 status in NSCLC according to clinicopathological characteristics
| Characteristics | No. patients | SCC‐S2 negative (%) | SCC‐S2 positive (%) | P‐value |
|---|---|---|---|---|
| Age (years) | ||||
| <60 | 40 | 10 (25) | 30 (75) | 0.791 |
| ≥60 | 53 | 12 (22.64) | 41 (77.36) | |
| Gender | ||||
| Male | 65 | 19 (29.23) | 46 (70.77) | 0.053 |
| Female | 28 | 3 (10.71) | 25 (89.29) | |
| Histology | ||||
| Adenocarcinoma | 46 | 6 (13.04) | 40 (86.96) | 0.0172 |
| Squamous cell carcinoma | 47 | 16 (34.04) | 31 (65.96) | |
| Differentiation | ||||
| Well | 18 | 6 (33.33) | 12 (66.67) | 0.2820 |
| Moderate – poor | 75 | 16 (21.33) | 59 (78.67) | |
| TNM stage | ||||
| I + II | 61 | 20 (32.79) | 41 (67.21) | 0.0042 |
| III + IV | 32 | 2 (6.25) | 30 (93.75) | |
| Tumor status | ||||
| T1 | 17 | 3 (17.65) | 14 (82.35) | 0.5190 |
| T2 T3 T4 | 76 | 19 (25) | 57 (75) | |
| Nodal status | ||||
| N0 | 43 | 15 (34.88) | 28 (65.12) | 0.0181 |
| N1, N2, N3 | 50 | 7 (14) | 43 (86) | |
| Ki‐67/MIB‐1 | ||||
| Low expression | 46 | 29 (63.04) | 17 (36.96) | 0.0028 |
| High expression | 47 | 42 (89.36) | 5 (10.64) | |
NSCLC, non‐small‐cell lung cancer.
Figure 3.
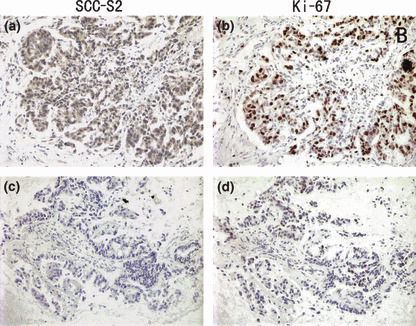
SCC‐S2 expression in non‐small‐cell lung cancer (NSCLC) tissues was associated positively with the expression of Ki‐67. Immunohistochemical staining for SCC‐S2 and Ki‐67 in two representative NSCLCs. One showed both strong expressions of SCC‐S2 (a) and Ki‐67 (b). The other showed both weak expressions of SCC‐S2 (c) and Ki‐67 (d).
Regarding survival, overall survival was significantly lower in patients with SCC‐S2‐positive NSCLCs than in patients with SCC‐S2‐negative NSCLCs (P = 0.012; Fig. 4). In addition, multivariate analysis using the Cox regression model indicated that p‐TNM stage was an independent, unfavorable prognostic factor (risk ratio, 1.892; P < 0.0001) (Table 2).
Figure 4.

Overall survival of non‐small‐cell lung cancer (NSCLC) patients in relation to SCC‐S2 status. The overall survival of patients who had NSCLC with low SCC‐S2 expression versus high SCC‐S2 expression.
Table 2.
Multivariate analysis for predictive factors in patients with NSCLC (Cox regression model)
| Factors | P‐value | Risk ratio | 95% CI | |
|---|---|---|---|---|
| Lower | Upper | |||
| Gender | 0.4899 | 0.801 | 0.428 | 1.502 |
| Age | 0.0779 | 0.579 | 0.316 | 1.063 |
| Histology | 0.7917 | 1.069 | 0.653 | 1.749 |
| Differentiation | 0.1082 | 0.718 | 0.479 | 1.076 |
| Stage | <0.0001 | 1.892 | 1.392 | 2.573 |
| SCC‐S2 expression | 0.1717 | 1.636 | 0.808 | 3.315 |
CI, confidence interval; NSCLC, non‐small‐cell lung cancer.
Depletion of SCC‐S2 expression inhibits tumor cell growth and invasion in lung cancer cell lines. To determine whether higher levels of SCC‐S2 contributed to the proliferation and invasion of NSCLC cells, we employed siRNA to knock down SCC‐S2 expression in the A549 and H1299 cancer cell lines. The SCC‐S2 expression was unaffected by transient transfection of non‐silencing control siRNA, whereas SCC‐S2‐specific siRNA considerably reduced the mRNA and protein expression levels 48 h after siRNA treatment (Fig. 5). The proliferation rate was determined by the MTT. A significant reduction was observed in the proliferation rate of A549 and H1299 cells transfected with SCC‐S2 siRNA compared with the proliferation rate of the cells transfected with the negative control siRNA. Consistent with MTT assay, the depletion of SCC‐S2 in A549 (control vs SCC‐S2 siRNA: 217 ± 11 vs 138 ± 22, P < 0.05) and H1299 (control vs SCC‐S2 siRNA: 182 ± 20 vs 116 ± 7, P < 0.05) cells led to a significant reduction in foci numbers as well as sizes (Fig. 6). We further examined whether cell invasion capacity was altered in SCC‐S2‐depleted cells. As shown in Figure 7, SCC‐S2 knockdown blocked lung cancer cell invasion using Matrigel invasion assay. To further explore the mechanisms by which SCC‐S2 promoted NSCLC cell invasion, we explored the expression of VEGFR‐2, MMP‐1, and MMP‐9 before and after transfection of siRNA. As shown in Figure 8, the mRNA levels of VEGFR‐2, MMP‐1, MMP‐9 were examined by quantitative real‐time RT‐PCR. Meanwhile the changes of protein levels were evaluated by western blot analysis. However, we did not observe remarkable changes in their expression (Fig. 8).
Figure 5.
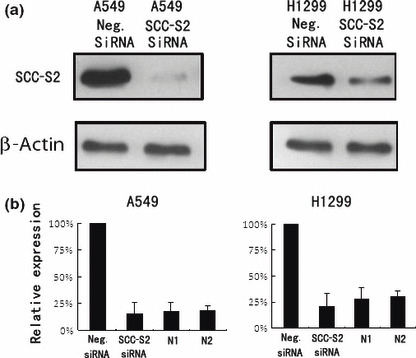
SCC‐S2 depletion in A549 and H1299 cell lines. (a) Western blot analyses of SCC‐S2 expression in lung cancer cells transfected with the siRNA. (b) Real‐time PCR analyses of SCC‐S2 depletion efficiency in cancer cells. Two cases of adjacent normal lung tissue were included. The level of SCC‐S2 mRNA in siRNA treated cells was comparable with normal lung tissues. Columns, mean; bars, SD.
Figure 6.
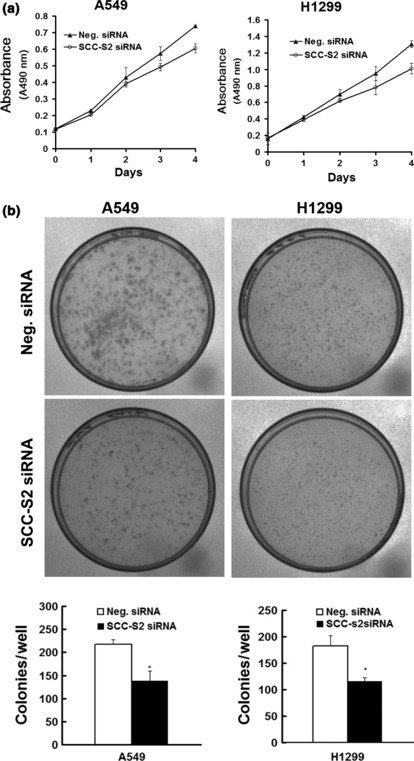
SCC‐S2 depletion impaired cancer cell proliferation. (a) MTT assay was performed after SCC‐S2 siRNA treatment. A reduction of absorbance was observed (P < 0.05). (b) Assessment of clonogenic potentials of the SCC‐S2‐depleted cancer cells. Numbers of colonies were counted. The number of colonies formed by cells treated with SCC‐S2 siRNA was far less than that of control cells (P < 0.05). Columns, mean; bars, SD.
Figure 7.
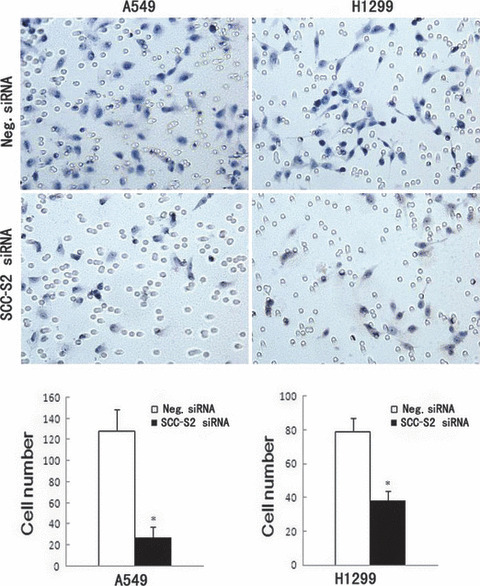
Invasion assays of A549 and H1299 cells transfected with control and SCC‐S2 ‐specific siRNA. SCC‐S2 siRNA treatment had a measurable blocking effect on cell invasion in both cell lines. Numbers of cells invading onto the lower surface of the filter were counted, a significant difference was observed (P < 0.05). Columns, mean; bars, SD.
Figure 8.
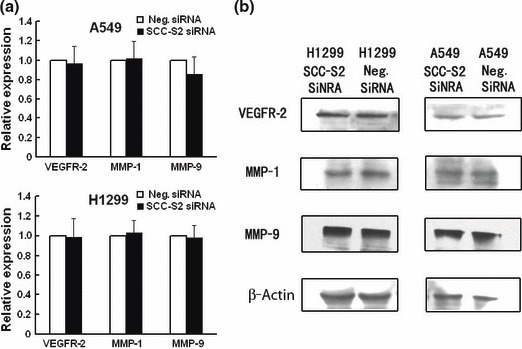
Expression of vascular endothelial growth factor receptor 2 (VEGFR‐2), matrix metalloproteinase 1 (MMP‐1), and MMP‐9 in SCC‐S2 ‐depleted H1299 and A549 cells. (a) Real‐time PCR and (b) western blot analysis showed the expression changes after silencing SCC‐S2 in H1299 and A549 cells. The expression of VEGFR‐2, MMP‐1, and MMP‐9 was explored. Columns, mean; bars, SD.
Discussion
Overexpression of SCC‐S2 has been implicated in a limited number of human breast cancer tissues and its expression enhanced cancer cell proliferation and invasion.( 8 , 11 , 12 ) However, the expression of SCC‐S2 as well as its correlation with clinical and pathological factors has not been defined in lung cancers. In this study, we demonstrated that the level of SCC‐S2 in lung cancer tissues as significantly higher that of normal lung tissues at both protein and mRNA levels. There was a close correlation between overexpression of SCC‐S2 and tumor stage and nodal status. Furthermore, SCC‐S2 overexpression correlated with the poor prognosis of lung cancer patients. In addition, we revealed that depletion of SCC‐S2 in lung cancer cells using siRNA led to inhibition of cancer cell growth and invasion.
SCC‐S2 was discovered by a comparison of the expression profile of a primary HNSCC cell line with its matched metastatic HNSCC‐derived cell line from the same patient. Previous study showed that SCC‐S2 mRNA was detectable in most human normal tissues.( 8 ) It was also expressed in various cancer cell lines, with relatively higher levels in K562 chronic myelogenous leukemia cells, MOLT4 lymphoblastic leukemia cells, and A549 lung carcinoma cells, and with lower levels in SW480 colorectal adenocarcinoma cells.( 8 ) SCC‐S2 protein expression, examined by western blot analysis, was found to be higher in several human breast carcinomas (10 cases) and renal cell carcinomas (nine cases) compared to matched normal adjacent tissues.( 11 ) These data suggest that SCC‐S2 may function as an oncoprotein in human lung malignancies. To address this issue, we first examined its mRNA levels in 29 paired NSCLC tissues by real‐time PCR, and we further examined SCC‐S2 protein in 93 tumors by immunohistochemistry. We found that SCC‐S2 expression was significantly higher in neoplastic than in non‐neoplastic tissues at both mRNA and protein levels, which was consistent with previous studies of SCC‐S2 overexpression in human malignant tumors. Moreover, SCC‐S2 positivity significantly correlated with lymph node metastasis and TNM stage in lung cancer patients, which was in accord with the fact that expression of SCC‐S2 in breast cancer cells is associated with enhanced invasion in vitro and increased frequency of pulmonary colonization in athymic mice. Importantly, this clinical study demonstrated that intratumoral SCC‐S2 expression was associated with patient survival. Taken together, these findings suggest that SCC‐S2 is up‐regulated in NSCLC tissues and stimulates lung cancer progression.
Previous study has confirmed that overexpression of SCC‐S2 is associated with enhanced survival and inhibition of the activities of the apoptotic enzymes caspase‐8 and caspase‐3.( 10 ) MDA‐MB 435 human cancer cells stably transfected with SCC‐S2 cDNA exhibited increased growth rate.( 11 ) Accordingly, we reasoned that SCC‐S2 may play a role in the regulation of cell growth in lung cancer cell lines. We examined the colony formation potential and cell growth rate in A549 and H1299 after siRNA treatment. We found that SCC‐S2 knockdown caused a significant reduction in the proliferation rate and colony formation ability in both A549 and H1299 cell lines. So it is acceptable that SCC‐S2 overexpression stimulated malignant cell proliferation. Moreover, Transwell cell migration assays showed that SCC‐S2 knockdown blocked cancer cell invasion. These data together demonstrate that SCC‐S2 had a measurable effect on lung cancer cell proliferation and invasion.
How might SCC‐S2 promote lung cancer progression? Previous study has reported that SCC‐S2 knockdown decreased VEGFR‐2, MMP‐1, and MMP‐9 expression. Vascular endothelial growth factor receptor 2 is the major regulator of endothelial cell mitogenesis, survival, and angiogenesis.( 13 , 14 , 15 ) Survival of endothelial cells is essential to growth of tumor‐associated vasculature at primary and distant sites. Matrix metalloproteinases are well known to play an important role in degradation of the ECM and tumor cell invasion and metastasis.( 16 , 17 , 18 ) Matrix metalloproteinase 1 (MMP‐1) and MMP‐9 have been reported to promote invasion and tumorigenesis in different cancer cells and correlate with metastasis and poor patient prognosis in breast cancer, colorectal cancer, and lung cancer.( 19 , 20 , 21 , 22 , 23 , 24 ) So it is possible that SCC‐S2 expression affects lung cancer progression through its effect on MMPs. We examined VEGFR‐2, MMP‐1, and MMP‐9 expression before and after transfection of siRNA. However, we did not observe remarkable changes in these molecules, but SCC‐S2 still significantly affected the invasiveness. It could be argued that SCC‐S2 may function differently in different cell lines. We believe there are other functional aspects of SCC‐S2 contributing to the regulation of invasion besides MMPs in lung cancer cell lines.
In conclusion, this study identifies SCC‐S2 as an oncoprotein overexpressed in NSCLC which is important for the maintenance of malignant phenotype, making SCC‐S2 a candidate target protein for future cancer therapeutics.
Disclosure Statement
The authors have no conflict of interest.
Acknowledgment
This work was supported by grants from the National Natural Science Foundation of China (nos. 30470764 and 30670917 to En‐Hua Wang, no. 30900562 to Yang Liu).
References
- 1. Jemal A, Siegel R, Ward E et al. Cancer statistics, 2007. CA Cancer J Clin 2007; 57 (1): 43–66. [DOI] [PubMed] [Google Scholar]
- 2. Minna JD, Roth JA, Gazdar AF. Focus on lung cancer. Cancer Cell 2002; 1 (1): 49–52. [DOI] [PubMed] [Google Scholar]
- 3. Schiller JH, Harrington D, Belani CP et al. Comparison of four chemotherapy regimens for advanced non‐small‐cell lung cancer. N Engl J Med 2002; 346 (2): 92–8. [DOI] [PubMed] [Google Scholar]
- 4. Chen HY, Yu SL, Chen CH et al. A five‐gene signature and clinical outcome in non‐small‐cell lung cancer. N Engl J Med 2007; 356 (1): 11–20. [DOI] [PubMed] [Google Scholar]
- 5. Liotta LA, Steeg PS, Stetler‐Stevenson WG. Cancer metastasis and angiogenesis: an imbalance of positive and negative regulation. Cell 1991; 64 (2): 327–36. [DOI] [PubMed] [Google Scholar]
- 6. O’Mahony D, Kummar S, Gutierrez ME. Non‐small‐cell lung cancer vaccine therapy: a concise review. J Clin Oncol 2005; 23 (35): 9022–8. [DOI] [PubMed] [Google Scholar]
- 7. Patel S, Wang FH, Whiteside TL et al. Identification of seven differentially displayed transcripts in human primary and matched metastatic head and neck squamous cell carcinoma cell lines: implications in metastasis and/or radiation response. Oral Oncol 1997; 33 (3): 197–203. [DOI] [PubMed] [Google Scholar]
- 8. Kumar D, Whiteside TL, Kasid U. Identification of a novel tumor necrosis factor‐alpha‐inducible gene, SCC‐S2, containing the consensus sequence of a death effector domain of fas‐associated death domain‐like interleukin‐ 1beta‐converting enzyme‐inhibitory protein. J Biol Chem 2000; 275 (4): 2973–8. [DOI] [PubMed] [Google Scholar]
- 9. Horrevoets AJ, Fontijn RD, Van Zonneveld AJ et al. Vascular endothelial genes that are responsive to tumor necrosis factor‐alpha in vitro are expressed in atherosclerotic lesions, including inhibitor of apoptosis protein‐1, stannin, and two novel genes. Blood 1999; 93 (10): 3418–31. [PubMed] [Google Scholar]
- 10. You Z, Ouyang H, Lopatin D et al. Nuclear factor‐kappa B‐inducible death effector domain‐containing protein suppresses tumor necrosis factor‐mediated apoptosis by inhibiting caspase‐8 activity. J Biol Chem 2001; 276 (28): 26398–404. [DOI] [PubMed] [Google Scholar]
- 11. Kumar D, Gokhale P, Broustas C et al. Expression of SCC‐S2, an antiapoptotic molecule, correlates with enhanced proliferation and tumorigenicity of MDA‐MB 435 cells. Oncogene 2004; 23 (2): 612–6. [DOI] [PubMed] [Google Scholar]
- 12. Zhang C, Chakravarty D, Sakabe I et al. Role of SCC‐S2 in experimental metastasis and modulation of VEGFR‐2, MMP‐1, and MMP‐9 expression. Mol Ther 2006; 13 (5): 947–55. [DOI] [PubMed] [Google Scholar]
- 13. Ferrara N, Gerber HP, LeCouter J. The biology of VEGF and its receptors. Nat Med 2003; 9 (6): 669–76. [DOI] [PubMed] [Google Scholar]
- 14. Shalaby F, Rossant J, Yamaguchi TP et al. Failure of blood‐island formation and vasculogenesis in Flk‐1‐deficient mice. Nature 1995; 376 (6535): 62–6. [DOI] [PubMed] [Google Scholar]
- 15. Veikkola T, Karkkainen M, Claesson‐Welsh L et al. Regulation of angiogenesis via vascular endothelial growth factor receptors. Cancer Res 2000; 60 (2): 203–12. [PubMed] [Google Scholar]
- 16. Mott JD, Werb Z. Regulation of matrix biology by matrix metalloproteinases. Curr Opin Cell Biol 2004; 16 (5): 558–64. [DOI] [PMC free article] [PubMed] [Google Scholar]
- 17. Rydlova M, Holubec L Jr, Ludvikova M Jr et al. Biological activity and clinical implications of the matrix metalloproteinases. Anticancer Res 2008; 28 (2B): 1389–97. [PubMed] [Google Scholar]
- 18. Sternlicht MD, Werb Z. How matrix metalloproteinases regulate cell behavior. Annu Rev Cell Dev Biol 2001; 17: 463–516. [DOI] [PMC free article] [PubMed] [Google Scholar]
- 19. Davidson B, Konstantinovsky S, Nielsen S et al. Altered expression of metastasis‐associated and regulatory molecules in effusions from breast cancer patients: a novel model for tumor progression. Clin Cancer Res 2004; 10 (21): 7335–46. [DOI] [PubMed] [Google Scholar]
- 20. Rolli M, Fransvea E, Pilch J et al. Activated integrin alphavbeta3 cooperates with metalloproteinase MMP‐9 in regulating migration of metastatic breast cancer cells. Proc Natl Acad Sci U S A 2003; 100 (16): 9482–7. [DOI] [PMC free article] [PubMed] [Google Scholar]
- 21. Tutton MG, George ML, Eccles SA et al. Use of plasma MMP‐2 and MMP‐9 levels as a surrogate for tumour expression in colorectal cancer patients. Int J Cancer 2003; 107 (4): 541–50. [DOI] [PubMed] [Google Scholar]
- 22. Takeuchi T, Hisanaga M, Nagao M et al. The membrane‐anchored matrix metalloproteinase (MMP) regulator RECK in combination with MMP‐9 serves as an informative prognostic indicator for colorectal cancer. Clin Cancer Res 2004; 10 (16): 5572–9. [DOI] [PubMed] [Google Scholar]
- 23. Rollin J, Regina S, Vourc’h P et al. Influence of MMP‐2 and MMP‐9 promoter polymorphisms on gene expression and clinical outcome of non‐small cell lung cancer. Lung Cancer 2007; 56 (2): 273–80. [DOI] [PubMed] [Google Scholar]
- 24. Laack E, Scheffler A, Burkholder I et al. Pretreatment vascular endothelial growth factor (VEGF) and matrix metalloproteinase‐9 (MMP‐9) serum levels in patients with metastatic non‐small cell lung cancer (NSCLC). Lung Cancer 2005; 50 (1): 51–8. [DOI] [PubMed] [Google Scholar]