

Abstract
The relationship between overexpression of glypican (GPC)‐3 that is specific for hepatocellular carcinoma (HCC) and the prognosis has not yet been clarified. We attempted to determine the expression profile of GPC3 in association with the clinicopathological factors by immunohistochemical analysis in HCC patients and investigated the potential prognostic value of GPC3 by comparing the survival rate between the GPC3‐positive and GPC3‐negative HCC patients. Primary HCC tissue samples (n = 107) obtained from patients who had undergone hepatectomy between 2000 and 2001 were analyzed. GPC3 expression was less frequently observed in well‐differentiated HCC than in moderately and poorly differentiated HCC, the difference in the frequency being statistically significant. GPC3‐positive HCC patients had a significantly lower 5‐year survival rate than the GPC3‐negative HCC patients (54.5 vs 87.7%, P = 0.031). Among 80 of the 107 (74.6%) patients with initial treatment who underwent hepatectomy, none of GPC3‐negative HCC patients (n = 16, 20.0%) died during the follow‐up period. No deaths were noted in the GPC3‐negative HCC patients among the 71 (88.7%) patients with moderately and poorly differentiated HCC. Multivariate analysis identified GPC3 expression (P = 0.034) as an independent prognostic factor for the overall survival. We showed that GPC3 expression is correlated with a poor prognosis in HCC patients. (Cancer Sci 2009)
Hepatocellular carcinoma (HCC) is one of the most common malignancies and is ranked as the third most common cause of cancer‐related death worldwide. HCC is generally associated with a poor prognosis, the 5‐year survival rate after surgery has been reported to be as low as 25–39%, and systemic therapy with cytotoxic agents provides only marginal benefit.( 1 ) Even in those patients in whom the tumor has been successfully removed, the 2‐year recurrence rate can be as high as 50%.( 2 , 3 ) Several clinicopathological factors including poor levels of differentiation of the cancer cells, large size of the tumor, portal venous invasion, and intrahepatic metastasis have been shown to contribute to the poor prognosis in patients of HCC. Despite the critical need for better methods for the diagnosis and treatment of HCC, the mechanisms underlying the development of HCC remain unclear.
Glypican (GPC)‐3 was discovered as a potential serological and histochemical marker that is specific for HCC. GPC3 is a member of the glypican family and belongs to a group of heparan sulfate proteoglycans bound to the outer surface of the cell membrane through a glycosylphosphatidylinositol anchor.( 4 ) In mammals, this family comprises six members, GPC1 to GPC6. GPC are released from the cell surface by a lipase called Notum to regulate the signaling of Wnts, Hedgehogs, fibroblast growth factors, and bone morphogenetic proteins.( 5 , 6 , 7 , 8 , 9 ) Depending on the context, their functions exerted may either be stimulatory or inhibitory through these pathways. GPC3 has been detected in the placenta and fetal liver, but not in other adult organs. During hepatic carcinogenesis, GPC3 appears in the HCC tissue and is released into the serum.( 10 , 11 , 12 ) In addition, its expression has also been reported in melanoma.( 13 , 14 , 15 )
A dramatic elevation of GPC3 expression has been reported in a large proportion of HCC, as determined by cDNA microarray analysis, whereas its expression has been shown to be less frequent in preneoplastic or entirely absent in non‐neoplastic liver tissue.( 16 , 17 , 18 ) This has led to the notion that GPC3 may have diagnostic usefulness as a marker of differentiation or a specific tumor marker in the case of HCC. However, until now, the relationship between GPC3 overexpression and the prognosis of HCC has not been clarified.
In the present study, we attempted to determine the tumor expression profile of GPC3 in association with clinicopathological factors in HCC patients by immunohistochemical analysis. We also investigated the potential prognostic value of GPC3 by analyzing the survival rate of GPC3‐positive and GPC3‐negative HCC patients. By elucidating the association between the GPC3 expression level in HCC tumors and the survival rate of the patients, we concluded that the GPC3 expression level is correlated with a poor prognosis in HCC patients.
Materials and Methods
Patients and tumor tissue samples. Primary HCC tissue samples (n = 107) were obtained from patients who underwent hepatectomy at the National Cancer Center Hospital East between 2000 and 2001. The histological types were assigned according to the criteria of the World Health Organization classification. Liver tissue sections prepared from the surgically resected tumors and adjacent parenchyma fixed in 10% formalin and embedded in paraffin were retrieved from the files of the Department of Pathology at our institution.
Immunohistochemical staining. Sections 6 µm thick were prepared from the paraffin‐embedded blocks. The sections were deparaffinized in xylene and rehydrated through ethanol to water. Endogenous peroxidase activity was blocked using 3% H2O2 in methanol for 20 min. For antigen retrieval, sections were heated in 10 mM citrate buffer (pH 6.0) with microwave at 95°C for 15 min. The slides were then allowed to cool down, and the prediluted primary monoclonal anti‐GPC3 antibody (dilution 1 : 300; Biomosaics, Burlington, VT, USA) was added to cover each slide, and the slides were incubated for 2 h at room temperature. Thereafter, the slides were washed three times in TBS–Tween 20 for 5 min each. Mouse Envision Polymer‐horseradish peroxidase (DakoCytomation, Carpenteria, CA, USA), was used as the secondary antibody for 30 min at room temperature followed by three washes in TBS–Tween 20 for 5 min each. Finally, the visualization signal was developed by the addition of 3,3‐diaminobenzidine tetrahydrochloride (DakoCytomation) to each slide, followed by incubation for 2 min. Slides were then washed in distilled water, counterstained with hematoxylin, and dehydrated.
For the immunohistochemical analysis of GPC3, we evaluated only the area of GPC3‐positive staining in one slide in each patient, including the HCC lesion and adjacent non‐cancerous lesion. At first, to analyze GPC3 expression, the results of immunohistochemical staining were classified according to the area of GPC3‐positive staining cells as follows: −, negative (<10%); +/–, weakly positive (10–30%); and +, positive (>30%). Finally, in this study, we classified two groups between GPC3‐negative (<10%) and GPC3‐positive (>10%). The expression of GPC3 was judged to be positive when the percentage of immunoreactive cells was semiquantitatively assessed as being ≥10% in focal lesions. The slides were examined independently by two observers (H. Shirakawa and T. Nakatsura) and then collectively by a pathologist (M. Kojima).
Analysis of the correlation of GPC3 expression with various clinicopathological factors. The correlation of GPC3 expression with various clinicopathological factors was analyzed. Overall survival was calculated from the date of surgery to the date of death.
Statistical analysis. The differences in the level of GPC3 expression were tested by the χ2‐test and the means of each subgroup were compared using Student's t‐test. Survival analyses were carried out according to the Kaplan–Meier method and the differences were assessed using the log‐rank test. Follow‐up time was censored if the patient was lost to follow up. Cox proportional‐hazards analysis was used for univariate and multivariate analyses to explore the effects of the variables on survival. P‐values of less than 0.05 were considered to be significant.
Results
Glypican‐3 expression in HCC. In order to characterize the expression of GPC3 in HCC, 107 surgical specimens were analyzed immunohistochemically. The mean and median follow‐up period were 3.4 ± 2.0 years and 3.5 years respectively. GPC3 expression was detected in 87 of the surgically resected tumor specimens (81.3%) (Fig. 1a,b), but not in the remaining 20 specimens (18.7%) (Fig. 1c,d). In most of the GPC3‐positive cases, the protein expression was localized mainly in the cellular cytoplasm (Fig. 1e) with some amount detected on the cell membrane (Fig. 1f). The results of the immunohistochemical analysis were evaluated in relation to the pathological findings and follow‐up data. There was no correlation between GPC3 expression and any of the clinicopathological features, except that the GPC3 expression increased with increasing degree of dedifferentiation of the cancer cells (Table 1). GPC3 expression was less frequently observed in well‐differentiated HCC than in moderately or poorly differentiated HCC; the difference in frequency was statistically significant. Thus, an increase in GPC3 expression was correlated with increasing aggressiveness of the cancer cells, which was accompanied by dedifferentiation of the cells.
Figure 1.
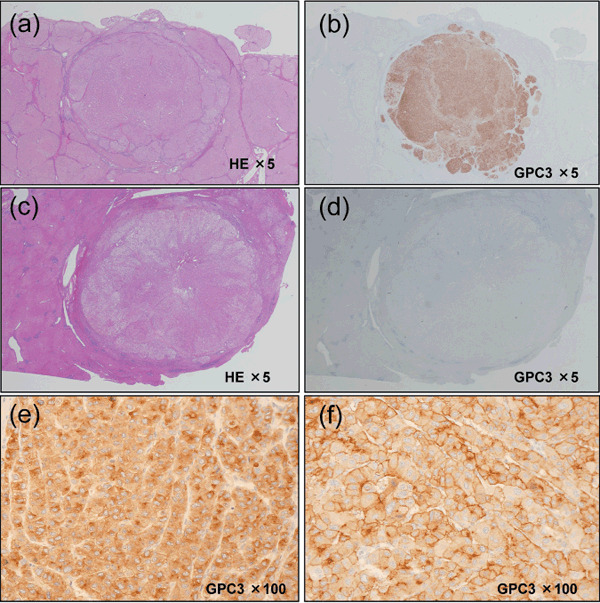
Glypican (GPC)‐3 expression and localization is hepatocellular carcinoma (HCC)‐specific. (a,c) Microscopic view of a HE‐stained sections of resected HCC. (b,d) HCC sections were stained for GPC3 expression with anti‐GPC3 monoclonal antibody. (e) HCC displays prominent bile‐canalicular immunostaining. (f) Membranous and cytoplasmic staining of liver tumor cells are shown.
Table 1.
Correlation between glypican (GPC)‐3 expression and clinicopathological features of patients with hepatocellular carcinoma
| Variable | GPC3 expression | P‐value | |
|---|---|---|---|
| Positive (n = 87) | Negative (n = 20) | ||
| Age (years) (mean ± SD) | 63.6 ± 9.7 | 60.2 ± 11.8 | 0.169 |
| Sex (male/female) | 67/20 | 18/2 | 0.321 |
| HBsAg status (positive/negative) | 26/61 | 3/17 | 0.283 |
| HCV status (positive/negative) | 50/37 | 12/8 | 0.999 |
| ICG R15 (%) (mean ± SD) | 15.9 ± 8.1 | 15.5 ± 7.6 | 0.823 |
| AFP (ng/mL) (mean) | 6710 | 463 | 0.198 |
| PIVKA‐II (mAU/mL) (mean) | 7370 | 5900 | 0.823 |
| Tumor occurring (primary/recurrence) | 64/23 | 16/4 | 0.753 |
| Number of tumor (solitary/multiple) | 64/23 | 11/9 | 0.172 |
| Resection procedure (trisegmentectomy, lobectomy, or segmentectomy/subsegmentectomy or partial resection) | 22/65 | 7/13 | 0.378 |
| Operation time (min.) (mean ± SD) | 310 ± 165 | 263 ± 119 | 0.248 |
| Intraperative blood loss (mL) (mean) | 2910 | 1500 | 0.356 |
| Perioperative transfusion (present/absent) | 45/42 | 9/11 | 0.767 |
| Tumor size (mm) (mean ± SD) | 54.7 ± 41.9 | 53.0 ± 31.2 | 0.861 |
| Histological tumor differentiation (well/moderately and poorly) | 6/81 | 6/14 | 0.032 |
| pStage (UICC) (I/II/III) | 35/41/11 | 6/10/4 | 0.577 |
| Portal vein involvement (present/absent) | 39/48 | 8/12 | 0.885 |
| Hepatic vein involvement (present/absent) | 9/78 | 1/19 | 0.750 |
| Bile duct involvement (present/absent) | 11/76 | 1/19 | 0.557 |
| Intrahepatic metastasis (present/absent) | 18/69 | 6/14 | 0.545 |
| Non cancerous tissue (cirrhosis/non‐cirrhosis) | 36/51 | 4/16 | 0.075 |
| Postoperative recurrence (present/absent) | 70/17 | 16/4 | 0.963 |
AFP, alpha‐fetoprotein; HBsAg, hepatitis B s antigen; HCV, hepatitis C virus; ICG‐R15, indocyanine green‐retention at 15 min; PIVKA‐II, protein induced by vitamin K absence II; UICC, International Union against Cancer.
Correlation between GPC3 expression and patient survival. In order to determine the prognostic value of GPC3, the overall survival was compared between GPC3‐positive and GPC3‐negative HCC patients. The GPC3‐positive HCC patients had a significantly lower 5‐year survival rate than the GPC3‐negative HCC patients (54.5 vs 87.7%, P = 0.031; Fig. 2a). After surgery, HCC recurrence was observed in 86 (80.4%) of the 107 patients. In the majority (97.7%) of patients with recurrence, the recurrence was observed in the residual liver. Among these 86 patients, 43 (50%) and seven (8.1%) developed multinodular and extrahepatic recurrence respectively. Although no correlations were observed between these recurrence patterns and GPC3 expression, GPC3 can only be used as an indicator of poor overall survival in HCC patients.
Figure 2.
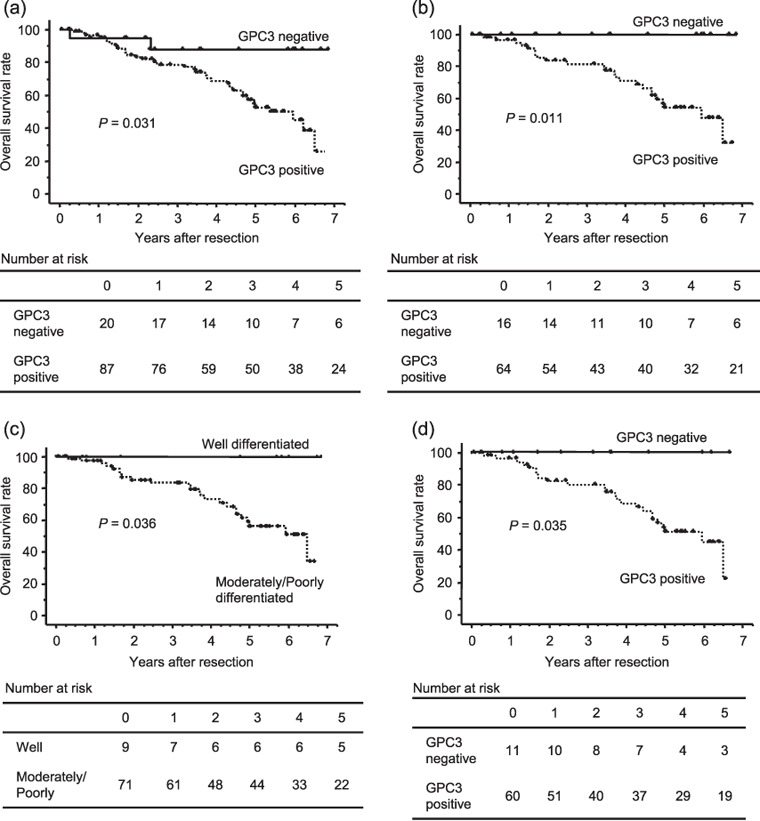
Overall survival curves for the 107 hepatocellular carcinoma (HCC) patients stratified into those with glypican (GPC)‐3‐positive and GPC3‐negative HCC. (a) Overall survival of patients with GPC3‐positive HCC was shorter than those with GPC3‐negative HCC (P = 0.031). (b) Overall survival curves in 80 of 107 HCC patients with initial treatment who underwent hepatectomy with positive and negative GPC3 expression. Patients with GPC3‐positive HCC had a lower 5‐year survival than those with GPC3‐negative HCC (P = 0.011). (c) Overall survival curves in the 71 HCC patients with initial hepatectomy who exhibited well‐ and moderately and poorly differentiated HCC on histopathological examination. The 5‐year survival rate was lower in the moderately and poorly differentiated GPC3‐positive HCC than in the corresponding GPC3‐negative HCC (P = 0.036). (d) Overall survival curves in the 71 initial treatment patients who underwent hepatectomy and exhibited moderately and poorly differentiated HCC on pathological examination with positive and negative GPC3 expression. The 5‐year survival rate was lower in the GPC3‐positive HCC patients than in the GPC3‐negative HCC patients (P = 0.035).
Among 80 of the 107 (74.6%) patients with initial treatment who underwent hepatectomy, none of the GPC3‐negative HCC patients (n = 16, 20.0%) died during the follow‐up period (Fig. 2b). The mean and median follow‐up periods were 3.7 ± 2.1 and 3.7 years respectively. The 1‐, 3‐, and 5‐year survival rates of the GPC3‐positive HCC group were 84.4, 62.5, and 32.8% respectively. With regard to the tumor grade of HCC, 9 (11.3%) of the 80 patients with well‐differentiated tumors showed significantly better prognosis without any record of deaths, compared with 71 (88.7%) patients with moderately and poorly differentiated HCC (Fig. 2c).
Further, among the 71 initial treatment patients who underwent hepatectomy and were found on histopathological examination to have moderately and poorly differentiated HCC, there were no deaths during the follow‐up period in the GPC3‐negative HCC group (Fig. 2d). The mean and median follow‐up periods were 3.6 ± 2.0 and 3.6 years respectively.
Univariate and multivariate analyses to identify the prognostic variables in HCC patients. To identify the variables of potential prognostic significance in all the patients with HCC, univariate analysis of each variable was carried out in relation to the survival time. The difference in the prognosis was assessed by examining the relative hazard and P‐value for each variable. The relative importance of each variable was then determined by multivariate Cox proportional hazards model analysis. Univariate analysis with stepwise inclusion of variables in the model revealed that the significant prognostic factors were GPC3 expression status, hepatitis B virus (HBV) or hepatitis C virus (HCV) infection, indocyanine green‐retention at 15 min (ICG‐R15), serum protein induced by vitamin K absence II (PIVKA‐II), tumor occurence, number of tumors, resection volume, pathological bile duct involvement, and pathological intrahepatic metastasis (Table 2). However, the multivariate analysis identified only GPC3 expression (P = 0.034), intrahepatic metastasis (P = 0.027), and multiple tumors (P = 0.006) as the independent prognostic factors related to overall survival (Table 2).
Table 2.
Prognostic factors for overall survival by univariate and multivariate analyses
| Variable | No. patients | Univariate analysis | Multivariate analysis | |||
|---|---|---|---|---|---|---|
| 5‐year survival rate (%) | P‐value | RR | 95% CI | P‐value | ||
| Age (years) (≥65/<65) | 51/56 | 65.8/53.4 | 0.531 | |||
| Sex (male vs female) | 85/22 | 56.1/72.7 | 0.403 | |||
| HBsAg (positive vs negative) | 29/78 | 51.0/62.3 | 0.011 | 1.14 | 0.31–4.16 | 0.844 |
| HCV (positive vs negative) | 62/45 | 66.7/46.4 | 0.004 | 2.41 | 0.75–7.69 | 0.138 |
| ICG R15 (%) (≥15 vs <15) | 50/57 | 70.3/46.8 | 0.047 | 0.69 | 0.31–1.54 | 0.362 |
| AFP (ng/mL) (≥50 vs <50) | 45/62 | 49.1/65.1 | 0.132 | |||
| PIVKA‐II (mAU/mL) (≥700 vs <700) | 30/77 | 35.0/65.6 | 0.016 | 1.91 | 0.730–5.02 | 0.188 |
| Tumor occurring (first vs recurrence) | 80/27 | 62.8/50.2 | 0.019 | 1.83 | 0.78–4.31 | 0.167 |
| No. tumors (solitary vs multiple) | 75/32 | 65.7/42.7 | 0.009 | 3.53 | 1.41–8.00 | 0.006 |
| Resection (trisegmentectomy, lobectomy, or segmentectomy/subsegmentectomy or partial resection) | 29/78 | 36.5/67.1 | 0.005 | 1.71 | 0.52–5.60 | 0.374 |
| Operation time (min) (>300 vs ≤300) | 49/58 | 43.9/72.3 | 0.053 | |||
| Intraoperative blood loss (mL) (≥1300 vs <1300) | 42/65 | 42.3/68.8 | 0.097 | |||
| Perioperative transfusion (present vs absent) | 54/53 | 49.6/66.5 | 0.599 | |||
| Tumor size (mm) (>50 vs ≤50) | 38/69 | 51.5/62.5 | 0.154 | |||
| Histological differentiation (well vs moderately and poorly) | 12/95 | 77.8/56.4 | 0.102 | |||
| pStage (I vs II/III) | 41/66 | 64.2/56.5 | 0.071 | |||
| Portal vein involvement (present vs absent) | 47/60 | 64.9/58.5 | 0.369 | |||
| Hepatic vein involvement (present vs absent) | 10/97 | 44.4/60.5 | 0.060 | |||
| Bile duct involvement (present vs absent) | 12/95 | 20.0/62.7 | 0.004 | 0.94 | 0.31–2.85 | 0.912 |
| Intrahepatic metastasis (present vs absent) | 24/83 | 29.0/66.6 | 0.001 | 3.57 | 1.13–10.50 | 0.027 |
| Non‐cancerous lesion (cirrhosis vs non‐cirrhosis) | 40/67 | 53.6/61.9 | 0.232 | |||
| GPC3 staining (positive vs negative) | 87/20 | 54.5/87.7 | 0.025 | 5.26 | 1.13–24.39 | 0.034 |
AFP, alpha‐fetoprotein; CI, confidence interval; HBsAg, hepatitis B s antigen; HCV, hepatitis C virus; ICG‐R15, indocyanine green‐retention at 15 min; PIVKA‐II, protein induced by vitamin K absence II; RR, relative risk; UICC, International Union against Cancer.
Discussion
In this study, we characterized the association between the expression level of GPC3 and the malignancy grade, and the prognostic value of GPC3 in HCC. Higher levels of GPC3 expression were observed in moderately or poorly differentiated tumor cells, which was in agreement with previous reports.( 19 ) Our contingency table analysis showed that the GPC3 expression level was correlated with the tumor differentiation level. In addition, Kaplan–Meier survival analysis revealed that GPC3 expression was significantly linked to a poor prognosis after surgical resection in HCC patients. Moreover, univariate analysis indicated that GPC3 expression is associated with an increased risk of death from HCC, and this risk factor could still be extracted in a multivariate setting. On the other hand, multivariate analysis did not identify the tumor differentiation level as an independent predictive factor of the prognosis. Among the 80 HCC patients who underwent initial surgical treatment, the GPC3‐negative patients showed better prognosis than the GPC3‐positive patients. Patients with well‐differentiated HCC also showed a better prognosis than those with moderately and poorly differentiated HCC. Furthermore, we confirmed that among the previously treated subjects, the GPC3‐negative group had a better prognosis than the GPC3‐positive group with moderately and poorly differentiated HCC tumors.
In this study, the patients who were HCV positive, had higher ICG‐R15 values, or portal vein involvement showed longer survival times, especially the patients who were HCV‐positive or had higher ICG‐R15 values, showed statistical significance in the univariate analysis. However, there was no statistical significance in these variables in the multivariate analysis. The reasons for these contradictive results in the univariate analysis are unclear.
In contrast, subgroup analysis did not reveal any significant difference in the disease‐free survival rate between the GPC3‐positive and GPC3‐negative HCC patients (data not shown). The rate of recurrence in patients after surgery was 63.8% within the first 2 years after surgery among the previously treated patients in this study. Tumor recurrence in the GPC3‐positive HCC patients occurred earlier than that in the GPC3‐negative HCC patients until 9.7 months after the surgery among the patients who had received previous treatment. Two mechanisms of postoperative recurrence of HCC have been suggested: one is intrahepatic metastasis in the residual liver in a metachronous manner, and the other is multicentric hepatocarcinogenesis based on chronic hepatitis.( 20 , 21 , 22 , 23 ) Some authors have suggested that early recurrence arises most often from intrahepatic metastases, whereas late recurrence is more likely to be multicentric in origin. Poon et al. and Portolani et al. reported that tumor factors like neoplastic vascular infiltration, but not host factors, were linked to early recurrence, whereas the risk of late recurrence was dependent on the underlying liver status.( 21 , 22 ) These results indicate that GPC3 expression may indicate a high risk of intrahepatic recurrence.
Most of the GPC3 expression patterns in HCC cells showed the cytoplasmic pattern. There was no case that showed only the membrane pattern. Almost half of the HCC cases showed the mixed pattern (cytoplasm and membrane) and the other half showed only the cytoplasmic pattern.
There was no statistical significance between the mixed pattern (cytoplasm and membrane) and cytoplasmic pattern (P = 0.297) in Kaplan–Meier survival analysis. The functional difference between cytoplasmic GPC3 and membrane GPC3 is unknown, so further investigations are needed to clarify whether the different localization of staining has a different significance.
In addition to the investigation of its role as a prognostic indicator, a phase I clinical trial of a GPC3‐derived peptide vaccine for advanced HCC is now underway; GPC3 is an ideal target for this therapy because it is more effective in patients with increased expression of GPC3, which is frequently observed in the later stages of HCC, as shown in the present study. The poor prognosis of patients with GPC3‐positive HCC also prompted us to develop a strategy of anticancer immunotherapy,( 24 , 25 ) that is, we may expect the effect of hepatocarcinogenesis prevention after surgery in patients with GPC3‐positive HCC.
In summary, our study evaluated the prognostic significance of GPC3 expression at the protein level in clinical tissue specimens of HCC. The overall survival rate was significantly poorer in patients with elevated GPC3 expression in the tumor than in those with lower levels of GPC3 expression. Further functional characterization of GPC3 may be expected to lead to a better understanding of the molecular mechanisms underlying the development and progression of HCC.
Acknowledgments
This work was supported in part by Health and Labor Sciences Research Grants for Research on Hepatitis from the Ministry of Health, Labor, and Welfare, Japan, a Grant‐in‐Aid for the Third‐Term Comprehensive 10‐Year Strategy for Cancer Control from the Ministry of Health, Labour, and Welfare, Japan, and awardee of research Resident Fellowship from the Foundation for Promotion of Cancer Research (Japan) for the Third‐Term Comprehensive 10‐Year Strategy for Cancer Control (H.S.).
References
- 1. Thomas MB, Zhu AX. Hepatocellular carcinoma: the need for progress. J Clin Oncol 2005; 23: 2892–9. [DOI] [PubMed] [Google Scholar]
- 2. Ibrahim S, Roychowdhury A, Hean TK. Risk factors for intrahepatic recurrence after hepatectomy for hepatocellular carcinoma. Am J Surg 2007; 194: 17–22. [DOI] [PubMed] [Google Scholar]
- 3. Mann CD, Neal CP, Garcea G, Manson MM, Dennison AR, Berry DP. Prognostic molecular markers in hepatocellular carcinoma: a systematic review. Eur J Cancer 2007; 43: 979–92. [DOI] [PubMed] [Google Scholar]
- 4. Filmus J. The contribution of in vivo manipulation of gene expression to the understanding of the function of glypicans. Glycoconj J 2002; 19: 319–23. [DOI] [PubMed] [Google Scholar]
- 5. Filmus J, Capurro M, Rast J. Glypicans. Genome Biol 2008; 9: 224. [DOI] [PMC free article] [PubMed] [Google Scholar]
- 6. Capurro MI, Xiang YY, Lobe C, Filmus J. Glypican‐3 promotes the growth of hepatocellular carcinoma by stimulating canonical Wnt signaling. Cancer Res 2005; 65: 6245–54. [DOI] [PubMed] [Google Scholar]
- 7. Song HH, Shi W, Xiang YY, Filmus J. The loss of glypican‐3 induces alterations in Wnt signaling. J Biol Chem 2005; 280: 2116–25. [DOI] [PubMed] [Google Scholar]
- 8. Stigliano I, Puricelli L, Filmus J, Sogayar MC, Bal de Kier Joffe E, Peters MG. Glypican‐3 regulates migration, adhesion and actin cytoskeleton organization in mammary tumor cells through Wnt signaling modulation. Breast Cancer Res Treat 2009; 114: 251–62. [DOI] [PubMed] [Google Scholar]
- 9. Torisu Y, Watanabe A, Nonaka A et al . Human homolog of NOTUM, overexpressed in hepatocellular carcinoma, is regulated transcriptionally by beta‐catenin/TCF. Cancer Sci 2008; 99: 1139–46. [DOI] [PMC free article] [PubMed] [Google Scholar]
- 10. Hippo Y, Watanabe K, Watanabe A et al . Identification of soluble NH2‐terminal fragment of glypican‐3 as a serological marker for early‐stage hepatocellular carcinoma. Cancer Res 2004; 64: 2418–23. [DOI] [PubMed] [Google Scholar]
- 11. Capurro M, Wanless IR, Sherman M et al . Glypican‐3: a novel serum and histochemical marker for hepatocellular carcinoma. Gastroenterology 2003; 125: 89–97. [DOI] [PubMed] [Google Scholar]
- 12. Nakatsura T, Yoshitake Y, Senju S et al . Glypican‐3, overexpressed specifically in human hepatocellular carcinoma, is a novel tumor marker. Biochem Biophys Res Commun 2003; 306: 16–25. [DOI] [PubMed] [Google Scholar]
- 13. Nakatsura T, Nishimura Y. Usefulness of the novel oncofetal antigen glypican‐3 for diagnosis of hepatocellular carcinoma and melanoma. Biodrugs 2005; 19: 71–7. [DOI] [PubMed] [Google Scholar]
- 14. Ikuta Y, Nakatsura T, Kageshita T et al . Highly sensitive detection of melanoma at an early stage based on the increased serum secreted protein acidic and rich in cysteine and glypican‐3 levels. Clin Cancer Res 2005; 11: 8079–88. [DOI] [PubMed] [Google Scholar]
- 15. Nakatsura T, Kageshita T, Ito S et al . Identification of glypican‐3 as a novel tumor marker for melanoma. Clin Cancer Res 2004; 10: 6612–21. [DOI] [PubMed] [Google Scholar]
- 16. Wang XY, Degos F, Dubois S et al . Glypican‐3 expression in hepatocellular tumors: diagnostic value for preneoplastic lesions and hepatocellular carcinomas. Hum Pathol 2006; 37: 1435–41. [DOI] [PubMed] [Google Scholar]
- 17. Libbrecht L, Severi T, Cassiman D et al . Glypican‐3 expression distinguishes small hepatocellular carcinomas from cirrhosis, dysplastic nodules, and focal nodular hyperplasia‐like nodules. Am J Surg Pathol 2006; 30: 1405–11. [DOI] [PubMed] [Google Scholar]
- 18. Di Tommaso L, Franchi G, Park YN et al . Diagnostic value of HSP70, glypican 3, and glutamine synthetase in hepatocellular nodules in cirrhosis. Hepatology 2007; 45: 725–34. [DOI] [PubMed] [Google Scholar]
- 19. Yamauchi N, Watanabe A, Hishinuma M et al . The glypican 3 oncofetal protein is a promising diagnostic marker for hepatocellular carcinoma. Mod Pathol 2005; 18: 1591–8. [DOI] [PubMed] [Google Scholar]
- 20. Yamamoto J, Kosuge T, Takayama T et al . Recurrence of hepatocellular carcinoma after surgery. Br J Surg 1996; 83: 1219–22. [PubMed] [Google Scholar]
- 21. Portolani N, Coniglio A, Ghidoni S et al . Early and late recurrence after liver resection for hepatocellular carcinoma: prognostic and therapeutic implications. Ann Surg 2006; 243: 229–35. [DOI] [PMC free article] [PubMed] [Google Scholar]
- 22. Poon RT, Fan ST, Ng IO, Lo CM, Liu CL, Wong J. Different risk factors and prognosis for early and late intrahepatic recurrence after resection of hepatocellular carcinoma. Cancer 2000; 89: 500–7. [PubMed] [Google Scholar]
- 23. Sakon M, Umeshita K, Nagano H et al . Clinical significance of hepatic resection in hepatocellular carcinoma: analysis by disease‐free survival curves. Arch Surg 2000; 135: 1456–9. [DOI] [PubMed] [Google Scholar]
- 24. Motomura Y, Ikuta Y, Kuronuma T et al . HLA‐A2 and ‐A24‐restricted glypican‐3‐derived peptide vaccine induces specific CTLs: preclinical study using mice. Int J Oncol 2008; 32: 985–90. [PubMed] [Google Scholar]
- 25. Komori H, Nakatsura T, Senju S et al . Identification of HLA‐A2‐ or HLA‐A24‐restricted CTL epitopes possibly useful for glypican‐3‐specific immunotherapy of hepatocellular carcinoma. Clin Cancer Res 2006; 12: 2689–97. [DOI] [PubMed] [Google Scholar]