

Abstract
Most tumor cell membranes overexpress l‐type amino acid transporter 1, while normal cell membranes contain l‐type amino acid transporter 2; both are Na+‐independent amino acid transporters. Therefore, compounds that selectively inhibit l‐type amino acid transporter 1 offer researchers with a novel cancer molecular target. Synthetic chemistry efforts and in vitro screening have produced a variety of novel compounds possessing high in vitro l‐type amino acid transporter 1 selectivity; KYT‐0353 was one such compound. The present studies illustrate that KYT‐0353 inhibited 14C‐leucine uptake and cell growth in human colon cancer‐derived HT‐29 cells; IC50s were 0.06 μm and 4.1 μm, respectively. KYT‐0353 also inhibited 14C‐leucine uptake in mouse renal proximal tubule cells expressing l‐type amino acid transporter 1, and inhibited cell growth; IC50s were 0.14 μm and 16.4 μm, respectively. Compared to control animals, intravenously administered KYT‐0353 (12.5 mg/kg and 25.0 mg/kg) showed statistically significant growth inhibition against HT‐29 tumors transplanted to nude mice with maximal inhibition ratios of 65.9% and 77.2%, respectively. Body weight increase with time – a safety indicator – was slightly depressed at 12.5 mg/kg and 25.0 mg/kg with maximal ratios of 3.7% (day 2) and 6.3% (day 11), respectively. Thus, KYT‐0353 showed significant growth inhibitory effects on HT‐29 cells both in vitro and in vivo, whereas it only caused a slight body weight depression. Therefore, KYT‐0353 appears to have potential as a novel anti‐tumor agent, presumably via selective in vivo l‐type amino acid transporter 1 inhibition. (Cancer Sci 2009)
When an oncogene or anti‐oncogene mutates, the gene may remain activated and cellular proliferation may continue. However, the proteins coded by these mutated genes may create conformational changes – compared to those via the unmutated gene(s) – and may ultimately produce cellular oncogenesis.( 1 ) Tumor cells require an ample supply of oxygen and nutrients to grow,( 2 ) and like normal cells, glucose and amino acids (AAs) are key nutrients. There are a variety of known AAs; consequently, there are corresponding AA transporters. System L transporters transport AAs into the cell in a Na+‐independent manner;( 3 ) they transport branched‐chain AAs (i.e. valine, isoleucine, and leucine) and neutral AAs with a relatively bulky aromatic side chain (i.e. phenylalanine and tyrosine). l‐type amino acid transporter 1 (LAT1),( 4 ) LAT2,( 5 ) LAT3,( 6 ) and LAT4( 7 ) have been identified as system L transporters, among which LAT1 and LAT3 are selectively expressed in tumor cells.( 6 , 8 )
Consisting of 512 AAs, LAT1 contains 12 trans‐membrane‐spanning non‐glyco‐proteins. It combines with 4F2hc, a glycoprotein, to form a heterodimer which transports large neutral essential AAs.( 4 , 9 ) LAT1’s mRNA becomes expressed in various tumor cells with high frequency, but appears restricted in normal cells of certain organs such as the brain, spleen, placenta, and bone marrow.( 4 , 8 ) Immunostaining, using anti‐LAT1 protein monoclonal antibody, revealed its occurrence in the cell membranes of various established tumor cell lines (e.g. colon cancer, stomach cancer, larynx cancer, lung cancer, brain tumors, and in blood vessel endothelial cell membranes constituting the blood–brain barrier).( 4 , 10 ) LAT2 consists of 533 AAs and also a 12 trans‐membrane‐spanning non‐glyco‐protein. LAT2 also combines with 4F2hc to form a heterodimer; LAT2‐4F2hc transports neutral AAs (i.e. small and large). LAT2’s mRNA has low, if any, expression in tumor cells but is expressed with high frequency in normal tissues.( 5 )
In cancer therapy, many cytotoxic anticancer drugs exhibit their antitumor activities by interfering with nucleic acid biosynthesis and function (i.e. alkylating agents).( 11 , 12 , 13 , 14 ) However, these anticancer agents cause cytotoxicity in cancer and normal cells and thereby afford untoward effects such as myelosuppression, digestive tract disturbances, and kidney dysfunction; that is, they have low selectivity between cancer and normal cells.
Recent advancements in human cell research have fostered molecularly targeted drug development – drugs selectively interacting with genes or gene products involved in various diseases. In fact, trastuzumab,( 15 ) acting against mammary cancer highly expressing growth factor receptor ErbB2, and gefitinib,( 16 ) acting against lung cancer highly expressing epidermal growth factor receptor, have been reported to be clinically useful. Molecular‐targeted compounds, under development to interfere with cellular oxygen and nutrient supply, include angiogenesis inhibitors such as bevacizumab.( 17 ) Bevacizumab, a chimera‐type human IgG 1 monoclonal antibody, selectively binds with the vascular endothelial growth factor (VEGF) expressed in many cancers and tumors such as colorectal cancer, stomach cancer, lung cancer, pancreas cancer, and mammary cancer. Bevacizuma inhibits VEGF activity by inhibiting its binding to the receptor.( 17 ) Its efficacy against progressing colon cancer has been demonstrated when used in combination with other chemotherapeutic agents.( 18 )
Most cancer cell membranes contain LAT1 which functions to supply essential AAs.( 8 ) Therefore, we selected LAT1 as our molecular target for cancer therapy. Compounds 2‐aminobicyclo‐(2,2,1)‐heptane‐2‐carboxylic acid (BCH) and 3,3′,5‐triiodo‐l‐thyronine (T3) are two representative LAT1 inhibitors.( 7 , 19 ) BCH acts as a classical system L inhibitor and inhibits both LAT1 and LAT2. Thus, BCH lacks selectivity toward LAT1.( 7 ) T3, a thyroid hormone possessing the tyrosine AA backbone, has the highest reported affinity toward LAT1.( 19 ) T3 has extremely low transportability and has low selectivity toward LAT1.( 19 ) The present report describes KYT‐0353, a novel tyrosine analog with high LAT1 selectivity which possesses potent in vitro and in vivo inhibitory activity.
Materials and Methods
Compounds. Following previously reported methods,( 20 ) KYT‐0353 – (S)‐2‐amino‐3‐(4‐((5‐amino‐2‐phenylbenzo[d]oxazol‐7‐yl)methoxy)‐3,5‐dichlorophenyl) propanoic acid – and KYT‐0284 – (S)‐2‐amino‐3‐(3‐(biphenyl‐4‐yloxy)phenyl)propanoic acid – were synthesized by Tanabe R&D Service (Saitama, Japan). The chemical structures are presented in Figure 1. [14C]Leucine (9.657 GBq/mmol) was purchased from Moravek Biochemicals (Brea, CA, USA). 5‐Fluorouracil (5‐FU), Cis‐platinum (II) diamine dichloride, melphalan, camptothecin, etoposide, and BCH were purchased from Sigma‐Aldrich Chemical (St. Louis, MO, USA). Doxorubicin hydrochloride, cytosine‐1‐β‐D(+)‐arabinofuranoside, methotrexate, paclitaxel, vincristine sulfate, and mitomycin‐C were purchased from Wako Pure Chemical Industries (Osaka, Japan). In the experiments, KYT‐0353 HCl salt and BCH were dissolved in physiological saline. Other compounds were dissolved in dimethylsulfoxide (DMSO ≤0.1%; Kanto Chemical, Tokyo, Japan).
Figure 1.
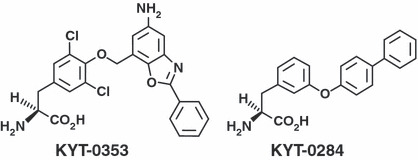
KYT‐0353 and KYT‐0284 chemical structures.
Cells. HT‐29 cells were purchased from American Type Culture Collection (ATCC; Manassas, VA, USA). S2‐hLAT1 and S2‐hLAT2 cells were prepared in the Department of Pharmacology and Toxicology, Kyorin University School of Medicine (Tokyo, Japan), by introducing human LAT1 (hLAT1) cDNA and human LAT2 cDNA into S2 cells derived from mouse renal proximal tubules.( 21 )
HT‐29 cells were cultured in McCoy’s 5A modified medium in the presence of 10% fetal bovine serum (FBS; JRH Biosciences, KS, USA) and penicillin/streptomycin (Invitrogen Life Technologies, hereafter abbreviated as Invitrogen; CA, USA). S2‐hLAT1 and S2‐hLAT2 cells were cultured in RITC80‐7 medium (AGC Techno Glass, Chiba, Japan) in the presence of 10% FBS, transferrin (Sigma), insulin (Shimizu Pharmaceutical, Shizuoka, Japan), human epidermal growth factor (Wakunaga Pharmaceutical, Osaka, Japan), penicillin/streptomycin (Invitrogen), geneticin (Invitrogen), and HEPES (Invitrogen).( 22 )
Experimental animals. Five‐week‐old male BALB/c nude mice and 8‐week‐old male BALB/c mice were purchased from Japan SLC (Shizuoka, Japan). Animals were maintained under the barrier system environment with free access to food (CE2; Nihon CLEA, Tokyo, Japan) and tap water.
Measurement of amino acid uptake by human colon cancer HT‐29 cells. 14C‐l‐Leucine was used as the prototypical LAT1 substrate; KYT‐0353 inhibitory activity was determined via radioactivity uptake experiments. Using a 24‐well plate format, cells (8.0 × 10⁴ cells/well) were seeded and incubated at 37°C (2 days). To initiate the experiments, Hanks’ solution (500 μL; pH 7.4, 37°C) was added to the adherent cells and incubated (7.0 min). The supernatant was then replaced with sodium‐free Hanks’ solution (37°C) containing 14C‐l‐leucine (1.0 μm) and test compound (100 μm). Uptake was conducted for 1.0 min. Cells were then washed three times with cold Hanks solution (500 μL; 4°C) and solubilized with 0.1 N NaOH (500 μL; 20 min). After mixing, cell lysate was mixed with scintillator (3.0 mL) and substrate accumulation measured by counting radioactivity via liquid scintillation counting (LSC; LSC6100; Aloka, Tokyo, Japan).( 21 )
LAT1 selectivity tests using S2 cells. Inhibitory activities of KYT‐0284, KYT‐0353, and melphalan on 14C‐l‐leucine uptake by S2‐hLAT1 and S2‐hLAT2 cells were determined by the same methods used with HT‐29 cells.( 21 )
Growth inhibitory effects of KYT compounds on HT29, S2‐hLAT1, and S2‐hLAT2 cells: Studies by cell counting. Cell suspensions (5 × 10³ cells/mL) in a volume of 1350 μL were placed into the wells of a flat‐bottom 24‐well microtiter plate (Falcon; Becton Dickinson Labware, NJ, USA) and incubated in an atmosphere of 5% CO2 (37°C for HT‐29 cells, and 33°C for S2‐hLAT1 and S2‐hLAT2 cells) for 24 h. Test compounds (150 μL) were then added at various concentrations and incubated (96 h). The cells were detached by treatment with EDTA‐trypsin, diluted with PBS, and counted with a Coulter counter. Using the least squares method, concentrations required for 50% growth inhibition (IC50) were obtained from the cell number and test compound concentration.
Comparison of the growth inhibitory activity between KYT‐0353 and various anticancer agents in HT‐29 cells: Studies by the MTT assay. Growth inhibition was evaluated by the MTT (3,4,5‐dimethylthiazol‐2yl‐2,5‐diphenyl tetrazolium bromide) assay method according to Carmichael et al. ( 23 ) Namely, cell suspensions (1 × 10⁴ cells/mL) in a volume of 135 μL were placed into the wells of a flat‐bottom 96‐well microtiter plate, and incubated in the atmosphere of 5% CO2 at 37 ° C (24 h). Drug solutions (15 μL) at various concentrations were added and incubated (96 h) under the same conditions. Next, MTT (15 μL; 5 mg/mL) dissolved in PBS was added and incubated (4.0 h). The incubation medium containing MTT was aspirated off. Cells were mixed (5 min) with DMSO (200 μL) and optical density read (540 nm) using a microtiter plate reader Emax (Molecular Devices, CA, USA); subsequently, IC50 values were determined.
Confirmation of LAT1 expression in nude mouse‐transplantable HT‐29 tumors and cultured HT‐29 cells: Immunohistochemical staining. From an HT‐29 tumor‐carrying nude mouse, the tumor was excised 22 days after transplantation and immersed in 10% formaldehyde overnight. After treatment with ethanol and chloroform, the tissue was imbedded in a paraffin block. The cultured cells were suspended in 10% formaldehyde and left standing (1.0 h, 4°C) for fixation. The fixed cells were suspended in PBS, imbedded in 2% agarose gel, and solidified. The solidified gel was fixed overnight in 10% formaldehyde, treated with ethanol/chloroform, and made into a paraffin‐imbedded block.
Each paraffin‐imbedded block was sliced into thin paraffin slices and treated with xylene/ethanol to remove paraffin. As the primary antibody, the preparations were first treated with mouse anti‐LAT1 monoclonal antibody.( 24 ) To complete the immunohistochemical staining, peroxydase‐labeled antimouse IgG polyclonal antibody (Histofine Simplestain MAX‐PO [Multi]) was used as the secondary antibody.
Growth inhibition effects of KYT‐0353 on HT‐29 tumor growth. Human‐derived nude mouse HT‐29 tumor growth inhibition was evaluated according to previously described methods.( 25 , 26 ) For transplantation, HT‐29 tumor blocks were injected subcutaneously to the right flank of male nude mice through a transplantation needle (ϕ 3.5 mm; Natsume Seisakusho, Tokyo, Japan). After transplantation, the longer and shorter diameters of the tumor were measured with a slide gauge, and tumor volume calculated using the following formula:
After tumor volumes had reached 100 to 300 mm3, the mice were divided into groups (n = 6). On the day of grouping (day 0), test compounds were administered intravenously daily for 14 days. Tumor volumes and body weights were measured two or three times a week for 42 days. Tumor volumes are expressed relative to initial tumor volume (day 0). Growth inhibition ratios for each treatment group was obtained from the mean tumor volume of the treated group compared to that of the control group.
Antitumor activity was evaluated according to the methods by Houchens et al. ( 27 ). Effects showing a maximal tumor growth inhibition of 58% or higher with a one‐sided risk ratio of 1% in the Mann–Whitney test were judged as effective. Treatment groups where drug‐caused death or body weight decreased more than 20% from the start of administration are judged as exhibiting toxicity, and excluded from the evaluation study; however, no animals were excluded and no animals died due to toxicity.
Plasma drug concentration time course after KYT‐0353 intravenous administration. Nine‐week old male BALB/c mice were divided into groups, and KYT‐0353 was intravenously administered (25.0 mg/kg). At 1.0, 5.0, 15, and 30 min, and at 1.0, 2.0, and 4.0 h post dose, blood samples (500 μL via abdominal vein) were withdrawn in the presence of heparin and centrifuged to yield plasma. Plasma samples (50 μL) were de‐proteinized with acetonitrile and dried under a stream of nitrogen. The residues were dissolved in initial HPLC mobile phase (100 μL) and analyzed. The HPLC conditions were as follows: TSK GEL ODS 80Ts column at 40 ± 1°C. A binary solvent gradient was used: solvent A was 10 mm ammonium formate (pH 3.0) and solvent B was methanol. Using a flow‐rate of 1.0 mL/min, the following gradient was used for HPLC separations: 50% B for 5 min; brought to 70% B at 9 min and held for 0.5 min; and then brought to 90% B over 10.5 min; the gradient was then returned to 50% B. Sample detection was via fluorescence using excitation wavelengths 340 nm and emission 510 nm. KYT‐0353 concentrations were determined using the absolute standard curve (10–1280 ng/mL) method.
Results
Immunohistochemical staining of cultured HT‐29 cells and transplanted HT‐29 tumors. Immunohistochemical staining results for hLAT1, hLAT2, and 4F2hc proteins in cultured HT‐29 cells and transplanted HT‐29 tumors are presented in Figure 2. HT‐29 cell membrane staining was intense via anti‐hLAT1 antibody and anti‐4F2hc antibody, but the cytoplasm and nuclei were not stained. On the other hand, the membranes, cytoplasm, and nuclei were not stained by anti‐hLAT2 antibody (Fig. 2a). Similarly, cell membranes of the HT‐29 tumors transplanted into nude mice were stained by anti‐hLAT1 antibody and anti‐4F2hc antibody, but the cytoplasm and cellular nuclei were not. The cell membranes, cytoplasm, and nuclei of the HT‐29 tumor cells were not stained by anti‐hLAT2 antibody (Fig. 2b).
Figure 2.

Immunohistochemical staining of human LAT1 (hLAT1), 4F2hc, and hLAT2 in human colon cancer‐derived HT‐29 tumors and cultured cells. (a) Staining cultured cells. Immunohistochemical staining and nuclear staining procedures were performed with paraffin‐imbedded blocks of cultured cells prepared from a nude mouse‐transplantable human colon cancer–derived HT‐29 tumor excised 22 days after transplantation. The figure shows, from the left, the results of immunostaining hLAT1 protein, 4F2hc protein, and hLAT2 protein at magnifications of ×100 (top) and ×400 (bottom). (b) Staining a HT‐29 tumor subcutaneously transplanted into a nude mouse. The figure shows, from the left, the results of immunohistochemical staining hLAT1 protein, 4F2hc protein, and hLAT2 protein at magnifications of ×100 (top) and ×400 (bottom).
KYT‐0353 in vitro efficacy.
Inhibitory effects of KYT‐0353 on 14C‐leucine uptake by S2‐hLAT1, S2‐hLAT2, and HT‐29 cells. Inhibitory effects of KYT‐0353 on 14C‐leucine uptake by S2‐hLAT1, S2‐hLAT2, and human colon adenocarcinoma HT‐29 cells are summarized in Figure 3(a) and Table 1. KYT‐0353 inhibited 14C‐leucine uptake by S2‐hLAT1 cells in a concentration‐dependent manner (Fig. 3a) over 0.01 to 10 μm to afford an IC50 of 0.14 μm. KYT‐0353 hardly inhibited 14C‐leucine uptake by S2‐hLAT2 cells and therefore had high hLAT1 in vitro inhibition selectivity. On the other hand, KYT‐0284 inhibited 14C‐leucine uptake in both S2‐hLAT1 and S2‐hLAT2 cells, and thus did not demonstrate hLAT1 selectivity. Consequently, KYT‐0284 was not tested in HT‐29 cells.
Figure 3.
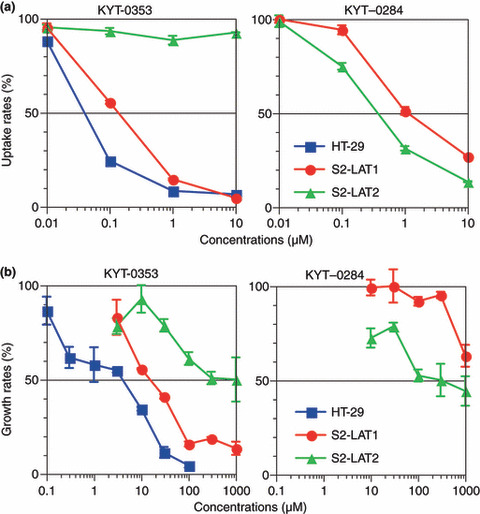
Effects of l‐type amino acid transporter 1 (LAT1) inhibitors on HT‐29 cells. (a) Effects on 14C‐leucine uptake. HT‐29 cells, S2‐LAT1 cells, and S2‐LAT2 cells were seeded to a 24‐well microtiter plate and incubated in the presence of 5% CO2 at 37°C or 33°C for 2 days. Then, the incubation medium was replaced with a Hanks’ solution (37°C) containing 14C‐leucine and a test compound, and the mixture was incubated for 1.0 min to allow radioactivity uptake. The cells were solubilized and the cell lysate counted for radioactivity with a scintillation counter. The figure shows the effects of KYT‐0353 (left) and KYT‐0284 (right) on the cellular 14C‐leucine uptake by various cells with uptake rates (%) on the ordinate and test compound concentrations (μm) on the abscissa. The symbols , •, and , show HT‐29, S2‐hLAT1, and S2‐hLAT2, respectively, with perpendicular bars of SD. (b) Growth inhibitory effects. HT‐29 cells, S2‐hLAT1 cells, and S2‐hLAT2 cells were seeded to a 24‐well microtiter plate and incubated in the presence of 5% CO2 at 37°C or 33°C for 24 h. Then, test compounds at various concentrations were added and further incubated for 96 h. After incubation, the cells were counted with a Coulter cell counter. The symbols , •, and show HT‐29, S2‐hLAT1, and S2‐hLAT2, respectively, with perpendicular bars of SD.
Table 1.
Comparison of inhibitory effects of KYT‐0353, KYT‐0284, and melphalan on leucine uptake and cell growth in S2‐hLAT, S2‐LAT2, and HT‐29 cells (IC 50 μm)
| Inhibition of 14C‐leucine uptake | Growth inhibition | ||||||
|---|---|---|---|---|---|---|---|
| KYT‐0353 | Melphalan | KYT‐0284 | KYT‐0353 | Melphalan | KYT‐0284 | ||
| S2 cells | S2‐hLAT1 | 0.14 | ND | 2.0 | 16.4 | 3.0 | >1000 |
| S2‐hLAT2 | >10 | ND | 0.45 | >1000 | 4.0 | 352.7 | |
| Ratio | >500 | ND | 0.23 | >61 | 1.3 | <0.4 | |
| HT‐29 | 0.06 | 590 | ND | 4.1 | 0.4 | ND | |
ND, no data, experiment not conducted.
To compare and contrast LAT1 inhibition selectivity and potency, the influence of KYT‐0353 and melphalan, a known alkylating agent, on 14C‐leucine uptake in HT‐29 cells was studied. KYT‐0353 and melphalan IC50 values were 0.06 μm and 590 μm, respectively (Table 1).
Growth inhibitory effects of KYT‐0353 on S2‐hLAT1, S2‐hLAT2, and HT‐29 cells. S2‐hLAT1, S2‐hLAT2, and HT‐29 cell growth inhibition by KYT‐0353 are summarized in Figure 3(b) and Table 1. KYT‐0353 exhibited concentration‐dependent (3–1000 μm) inhibitory effects on S2‐hLAT1 cell growth affording an IC50 of 16.4 μm. In contrast, KYT‐0284 barely illustrated any S2‐hLAT1 growth inhibitory effect. KYT‐0353 and KYT‐0284 displayed concentration‐dependent inhibitory effects on S2‐LAT2 cell growth (>30 μm), but their IC50 values were >1000 μm and 353 μm, respectively. The selectivity ratios of KYT‐0353 and KYT‐0284 (Table 1) toward hLAT1 over hLAT2 were >61 and 0.4, respectively. Thus, unlike KYT‐0282, KYT‐0353 inhibited S2‐hLAT1 and HT‐29 cell growth; presumably via selective interaction with hLAT1 AA transport. KYT‐0353 and melphalan inhibited HT‐29 cell growth in a concentration‐dependent fashion affording IC50 values of 4.1 and 0.4 μm, respectively; because KYT‐0282 was not selective, it was not tested in the HT‐29 growth inhibition experiment. Melphalan inhibited HT‐29 cell growth. Melphalan effects appeared to be a combination of hLAT1 inhibition( 19 ) and via its nitrogen mustard alkylating properties. As summarized in Table 2, the HT‐29 IC50 growth inhibition data for a variety of known anticancer agents illustrated that KYT‐0353 had comparable activity to cisplatin.
Table 2.
Comparison of concentrations required for 50% growth inhibition (IC 50 ) among known anticancer agents against cultured HT‐29 cells
| Compound | IC50 | (μm) |
|---|---|---|
| Mean | ±SD | |
| KYT‐0353 | 13.9 | 4.3 |
| Doxorubicin | 0.114 | 0.003 |
| Mitomycin C | 0.113 | 0.019 |
| Paclitaxel | 0.0000268 | 0.0000077 |
| Cytosine arabinoside | 0.418 | 0.111 |
| 5‐Fluorouracil | 6.03 | 1.12 |
| Etoposide | 1.60 | 0.41 |
| Cisplatin | 19.1 | 10.2 |
| Methotrexate | 445 | 123 |
KYT‐0353 mouse in vivo experiments.
The time course of plasma drug concentrations in mice. KYT‐0353 was intravenously administered to male BALB/c mice, and plasma concentration versus time monitored (Fig. 4). KYT‐0353’s plasma concentration rapidly dropped during the first 15 min; the concentration at 1.0, 5.0, and 15 min post dose were 98.0 μg/mL, 10.8 μg/mL, and 2.2 μg/mL, respectively. Hence, KYT‐0353 has a very fast distribution phase. Thereafter, plasma concentration plateaued; at 0.5, 1.0, 2.0 and 4.0 h post dose, the concentrations were 1.8 μg/mL, 2.4 μg/mL, 1.7 μg/mL, and 0.6 μg/mL, respectively. From these data, the plasma half‐lives – via the α and β phases using a two‐compartment model – after a 25.0 mg/kg intravenous administration were 0.02 h and 2.0 h, respectively. Using the trapezoidal method, the AUC0‐4h was calculated to be 14.3 μg h/mL.
Figure 4.
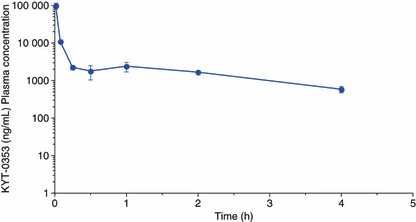
The time course of plasma concentrations of unchanged KYT‐0353 in mice after intravenous administration (25.0 mg/kg). KYT‐0353 was intravenously administered to BALB/c mice at the dose of 25.0 mg/kg in a volume of 0.1 mL/10 g body weight. After administration, blood samples were withdrawn at 1.0, 5.0, 15, 30 min, and 1.0, 2.0, and 4.0 h, and centrifuged to afford plasma samples. The plasma samples, after de‐proteinization, were subjected to HPLC analysis and KYT‐0353 was quantified. The ordinate and abscissa axes indicate plasma concentrations ± SD and times after administration, respectively.
Inhibitory effects of KYT‐0353 on the growth of HT‐29 tumors transplanted to nude mice. As summarized in Figure 5, KYT‐0353 inhibited HT‐29 tumor growth in nude mice. KYT‐0353 was intravenously administered daily for 14 days at three different doses (6.3, 12.5, and 25.0 mg/kg). KYT‐0353 was dissolved in a volume of 0.1 mL/10 g body weight. KYT‐0353 showed dose‐dependent inhibition on tumor growth. The maximal inhibition ratios at 6.3, 12.5, and 25.0 mg/kg were 58.2% (day 42), 65.9% (day 30), and 77.2% (day 38), respectively. As early as 7 days, and thereafter at the risk ratio of 1%, KYT‐0353 growth inhibitory effects at 12.5 mg/kg and 25.0 mg/kg were statistically significant compared to the control group. On days 30, 32, 38, and 42, the inhibitory effects at 6.3 mg/kg were statistically significant. Relative to control animals, body weight changes could be regarded as a toxicity indicator. At 25.0 mg/kg, KYT‐0353 administered body weight decreased during days 2–17 with a maximum of 6.3% on day 11.
Figure 5.
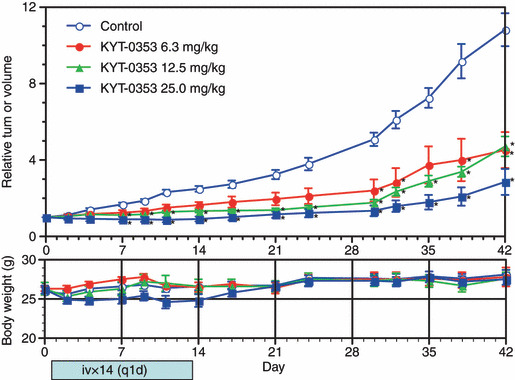
Effects of KYT‐0353 on the growth of transplanted HT‐29 tumors and body weights in nude mice. Blocks were prepared from HT‐29 tumors and transplanted through a transplantation needle to the right flank of male nude mice. The mice were divided into one control group (n = 10) and treatment groups (n = 6). Test compound was intravenously administered from the day of grouping (day 0) once daily for 14 days. The tumor volume and body weight were measured two or three times a week for 42 days. The tumor volume was expressed as relative to the initial tumor volume. The growth inhibition ratio was obtained from the mean relative tumor volume of each treatment group to the mean relative tumor volume of the control group. The upper graph shows tumor volume changes with relative tumor volumes on the ordinate and days after the initiation of treatment on the abscissa. The lower graph shows body weight changes with body weights on the ordinate and days after the initiation of treatment on the abscissa. The symbols indicate relative tumor volumes of ○ the control, • 6.3 mg/kg, 12.5 mg/kg, 25.0 mg/kg treatment groups with perpendicular bars of SEM. The symbol * signifies points of a statistical significance of difference with one‐sided risk of 1% in the Mann–Whitney U‐test.
Discussion
In 1971, Folkman suggested that tumor growth could be hampered by inhibiting angiogenesis and thereby depriving cancer cells of adequate nutrition and oxygen required for growth.( 28 ) Angiogenesis inhibitor studies became active in the 1990s, and clinical trials have been undertaken.( 29 ) Although bevacizumab alone was not effective in clinical trials,( 30 ) a combination with cytotoxic antitumor agents (i.e. Irinotecan, 5‐FU, and leucovorin) was effective.( 18 ) Although adverse effects such as digestive tract perforation, wound healing complications, hemorrhage, and thromboembolism have been reported,( 31 ) cancer cell starvation strategy remains to be the utility of angiogenesis inhibitors.
Other starvation strategies include specific cellular nutrient uptake inhibitors such as glucose and AAs. Thus far, no compounds have been reported to inhibit tumor growth by selectively blocking cancer cell glucose uptake. However, versipelo statin (VST), kigamicin, and pyrvinium have been reported to exert tumor growth inhibition under the conditions of glucose deprivation.( 32 , 33 ) Glucose is certainly an important source of cellular energy; but so are AAs and lipids. Hence, selective glucose uptake inhibition may not be an adequate molecular target for starvation anticancer therapy.
Animals must obtain essential AAs from the diet and these are transported into cells mainly through the l‐system. When Kaira et al. compared the 5‐year survival rate between non‐small‐cell lung cancer patients who expressed LAT1 on the cell membranes and those who did not, prognosis for the former group was apparently worse than the latter.( 34 ) These data support the notion that strong LAT1 expression on the membranes of non‐small‐lung cancer cells might be related to poorer patient prognosis; hence, LAT1 may be a molecular target for starvation therapy of solid tumors such as non‐small‐cell lung cancer. However, with the exception of BCH and melphalan, limited antitumor drug research focusing on system L has thus far been reported.( 9 , 19 , 35 )
Unlike LAT2, it has been reported( 4 , 5 , 19 ) that LAT1 and 4F2hc are expressed on the membranes of many cultured cancer cells. Staining cancer cells with a fluorescent dye, Kim et al. confirmed that LAT1 and 4F2hc are co‐expressed on the membranes of T24 human bladder carcinoma cells, but LAT2 is not.( 35 ) In the present study, immunohistochemical staining illustrates that HT29 cells also express LAT1 and 4F2hc, but do not express LAT2 (Fig. 2a). The co‐existence of LAT1 and 4F2hc on the membranes of excised human cancer tissues has previously been confirmed,( 9 , 10 , 24 , 34 ) but the present study describes the first report where human tumor cells were transplanted and maintained in nude mice. For example, BCH, T3, and melphalan have been reported to inhibit AA uptake in tumor cells.( 9 , 19 , 35 ) but their growth inhibitory effects on transplanted tumors in nude mice has not been reported; Kim et al. have reported data in a cultured cell system.( 36 ) Using HT29 cells, we have established that KYT‐0353 can inhibit tumor cell growth in both cultured and nude mouse‐transplanted tumor cell systems (Fig. 5). In particular, the nude mouse system for efficacy evaluation has a similar micro‐environment to that of human tumors, thereby suggesting that KYT‐0353 may be clinically effective in humans.
Thus far, the most successful clinical cancer chemotherapy method appears to be via ‘combination therapy’; that is, using multiple cytotoxic antitumor agents with different mechanisms of action. In the current study, many cytotoxic anticancer agents showed in vitro cell growth‐inhibitory effects with IC50 values lower than KYT‐0353 (Table 2). Since these agents exert cytotoxicity toward normal and cancer cells (i.e. not specific), untoward effects are unavoidable. In contrast, KYT‐0353, in spite of its higher IC50, would be expected to exert weaker adverse effects on normal cells because of its higher cancer cell selectivity.
Tannock( 37 ) has suggested that growth‐targeted anticancer agents show dramatic efficacy against cultured cancer cells, but exhibit less efficacy in clinical practice; cancer cells respond to low oxygen and thereby become less active.( 38 )Tomida and Turuo have reported that cancer cells, by acquiring tolerance to adverse environments such as low oxygen, might also acquired resistance to many anticancer drugs.( 39 )‘Target of Rapamycin’ (mTOR), which regulates cell division, growth, and subsistence, has been found to play an important role in the control of cellular responses to stress. mTOR has also been shown to play a central role in responding to AA deprivation, one of the cellular stressful states.( 40 ) Whenever AA deficiency occurs in the cell, this information gets transmitted from the AA sensor to mTOR and inhibits cell growth.( 41 ) Growth inhibitory effects via mTOR inhibitors, such as rapamycin and CCI‐779, in various cultured cells have been reported.( 41 , 43 ) These reports are in line with our hypothesis that LAT1 selective inhibitors may deprive tumor cells of essential AA and inhibit the action of mTOR, ultimately resulting in growth inhibition.
KYT‐0353 inhibited HT‐29 cell growth in a concentration‐dependent manner (0.3 to 100 μm) generating an apparent IC50 of 4.1 μm. However, the KYT‐0353 IC50 concentration (0.06 μm) required to inhibit 14C‐leucine uptake did not inhibit HT‐29 cell growth; this represents a 68‐fold difference in susceptibility. Using BCH, Kim et al. reported similar results ( 36 ) in KB cells and Saos2 cells. BCH inhibited 14C‐leucine uptake with IC50 values of 75.3 ± 6.7 μm and 78.8 ± 3.5 μm, respectively. In contrast, cell growth IC50 values were 6.9 ± 0.4 mm and 5.6 ± 0.7 mm, respectively. Thus, in KB cells and Saos2 cells, there was a 92‐ and 71‐fold difference, respectively, between AA uptake and cell growth IC50 values. The IC50 value differences appear to result from the AA concentrations (the substrates of LAT1) used in the incubation medium. KYT‐0353 inhibits LAT1 by competing with its substrates; hence, the degree of inhibition being greatly influenced by the concentration of the substrates. In the experiment to study the inhibition of 14C‐leucine uptake, the concentration of the LAT1 substrate AA was 1.0 μm, whereas the culture medium for the experiment to study cell growth inhibition contained higher concentrations of AAs; conditions which would require higher concentrations of the inhibitor in order to attain a similar degree of inhibition.
The present study using human colon cancer–derived HT‐29 cells constitutes the first report to demonstrate in vitro and in vivo antitumor effects of KYT‐0353, a compound designed as a selective LAT1 inhibitor. Future work will describe additional KYT‐0353 in vitro and in vivo studies and its potential development as a novel anticancer drug.
Acknowledgments
This study was supported by a grant from New Energy and Industrial Technology Development Organization of the Ministry of Economy, Trade and Industry of Japan. The authors thank A. Yamanishi for cell uptake experiments.
References
- 1. Knudson AG Jr. Hereditary cancer, oncogenes, and antioncogenes. Cancer Res 1985; 45: 1437–43. [PubMed] [Google Scholar]
- 2. Shchors K, Evan G. Tumor angiogenesis: cause or consequence of cancer? Cancer Res 2007; 67: 7059–61. [DOI] [PubMed] [Google Scholar]
- 3. Christensen HN. Role of amino acid transport and counter transport in nutrition and metabolism. Physiol Rev 1990; 70: 43–77. [DOI] [PubMed] [Google Scholar]
- 4. Kanai Y, Segawa H, Miyamoto K, Uchino H, Takeda E, Endou H. Expression cloning and characterization of a transporter for large neutral amino acid activated by the heavy chain of 4F2 antigen (CD98). J Biol Chem 1998; 273: 23629–32. [DOI] [PubMed] [Google Scholar]
- 5. Segawa H, Fukusawa Y, Miyamoto K, Takeda E, Endou H, Kanai Y. Identification and functional characterization of a Na+‐independent neutral amino acid transporter with broad substrate selectivity. J Biol Chem 1999; 274: 19745–51. [DOI] [PubMed] [Google Scholar]
- 6. Babu E, Kanai Y, Chairoungdua A et al. Identification of a novel system L amino acid transporter structurally distinct from heterodimeric amino acid transporters. J Biol Chem 2003; 278: 43838–45. [DOI] [PubMed] [Google Scholar]
- 7. Bodoy S, Martin L, Zorzano A, Palacin M, Estevez R, Bertran J. Identification of LAT4, a novel amino acid transporter with system L activity. J Biol Chem 2005; 280: 12002–11. [DOI] [PubMed] [Google Scholar]
- 8. Yanagida O, Kanai Y, Chairoungdua A et al. Human L‐type amino acid transporter 1 (LAT1): characterization of function and expression in tumor cell lines. Biochim Biophys Acta 2001; 1514: 291–302. [DOI] [PubMed] [Google Scholar]
- 9. Mastroberardino L, Spindler B, Pfeiffer R et al. Amino‐acid transport by heterodimers of 4F2hc/CD98 and members of a permease family. Nature 1998; 395: 288–91. [DOI] [PubMed] [Google Scholar]
- 10. Kanai Y, Endou H. Functional properties of multispecific amino acid transporters and their implication to transporter‐mediated toxicity. J Toxicol Sci 2003; 28: 1–17. [DOI] [PubMed] [Google Scholar]
- 11. Rosenberg B, VanCamp L, Trosko JE, Mansour VH. Platinum compounds: a new class of potent antitumor agents. Nature 1969; 222: 385–6. [DOI] [PubMed] [Google Scholar]
- 12. Capranico G, Zunino F, Kohn KW, Pommier Y. Sequence‐selective topoisomerase II inhibition by anthracycline derivatives in SV40 DNA: relationship with DNA binding affinity and cytotoxicity. Biochemistry 1990; 29: 562–9. [DOI] [PubMed] [Google Scholar]
- 13. Rowinsky EK, Cazenave LA, Donehower RC. Taxol: a novel investigational antimicrotubule agent. J Natl Cancer Inst 1990; 82: 1247–59. [DOI] [PubMed] [Google Scholar]
- 14. Laskin JD, Evans RM, Slocum HK, Burke D, Hakala MT. Basis for natural variation in sensitivity to 5‐fluorouracil in mouse and human cells in culture. Cancer Res 1979; 39: 383–90. [PubMed] [Google Scholar]
- 15. Slamon DJ, Leyland‐Jones B, Shak S et al. Use of chemotherapy plus a monoclonal antibody against HER2 for metastatic breast cancer that overexpresses HER 2. N Engl J Med 2001; 344: 783–92. [DOI] [PubMed] [Google Scholar]
- 16. Lynch TJ, Bell DW, Sordella R et al. Activating mutations in the epidermal growth factor receptor underlying responsiveness of non‐small‐cell lung cancer to gefitinib. N Engl J Med 2004; 350: 2129–39. [DOI] [PubMed] [Google Scholar]
- 17. Giaccone G. The potential of antiangenic therapy in non‐small cell lung cancer. Clin Cancer Res 2007; 13: 1961–70. [DOI] [PubMed] [Google Scholar]
- 18. Hurwits H, Fehrenbacher L, Novotny W et al. Bevacizumab plus irinotecan, fliorouracil, and leucovorin for metastatic colorectal cancer. N Engl J Med 2004; 350: 2335–42. [DOI] [PubMed] [Google Scholar]
- 19. Uchino H, Kanai Y, Kim DK et al. Transport of amino acid‐related compounds mediated by L‐type amino acid transporter 1(LAT1): insights into the mechanisms of substrate recognition. Mol Pharmacol 2002; 61: 729–37. [DOI] [PubMed] [Google Scholar]
- 20. Endou H, Kanai Y, Tsujihara K, Saito K. Aromatic Amino Acid Derivatives and Medicinal Compositions. US Patent 7,345,068 B2, 2008. [Google Scholar]
- 21. Morimoto E, Kanai Y, Kim D‐K et al. Establishiment and characterization of mammalian cell lines stably expressing human L‐type amino acid transporters. J Pharmacol Sci 2008; 108: 505–16. [DOI] [PubMed] [Google Scholar]
- 22. Takeda M, Tojo T, Sekine T, Hosoyamada M, Kanai Y, Endou H. Role of organic anion transporter 1 (OAT1) in cephaloridine (CER)‐induced nephrotoxicity. Kidney Int 1999; 56: 2128–36. [DOI] [PubMed] [Google Scholar]
- 23. Carmichael J, DeGraff WG, Gazdar AF, Minna JD, Mitchell JB. Evaluation of a tetrazolium‐based semiautomated colorimetric assay: assessment of chemosensitivity testing. Cancer Res 1987; 47: 936–42. [PubMed] [Google Scholar]
- 24. Sakata T, Ferdous G, Tsuruta T et al. L‐type amino acid transporter LAT1 as a novel biomarker for high‐grande malignancy in pancreatic cancer. Pathol Int 2009; 59: 7–18. [DOI] [PubMed] [Google Scholar]
- 25. Koyanagi N, Nagasu T, Fujita F et al. In vivo tumor growth inhibition produced by a novel sulfonamido, E7010, against rodent and human tumors. Cancer Res 1994; 54: 1702–6. [PubMed] [Google Scholar]
- 26. Utsugi T, Shibata J, Sugimoto Y et al. Antitumor activity of a novel podophyllotoxin derivative (TOP‐53) against lung cancer and lung metastatic cancer. Cancer Res 1996; 56: 2809–14. [PubMed] [Google Scholar]
- 27. Houchens DP, Ovejera AA, Barker AD. The therapy of human tumor in athymic (nude) mice. In: Houchens P, Ovejera AA, eds. “Proc. Sym. the Use of Athymic(nude) Mice in Cancer Research. New York: Gustav fischer, 1978; 267–80. [Google Scholar]
- 28. Folkman J. Angiogenrsis in cancer, vascular, rheumatoid and other disease. Nat Med 1995; 1: 27–31. [DOI] [PubMed] [Google Scholar]
- 29. Marx J. A boost for tumor starvation. Science 2003; 301: 452–4. [DOI] [PubMed] [Google Scholar]
- 30. Gordon MS, Margolin K, Talpaz M et al. Phase safety and pharmacokinetic study of recombinant human anti‐vascular endothelial growth factor in patients with advanced cancer. J Clin Oncol 2001; 19: 843–50. [DOI] [PubMed] [Google Scholar]
- 31. Johnson DH, Fehrenbacher L, Novotny WF et al. Randomized phase II trial comparing bevacizumab plus carboplatin and paclitaxel with carboplatin and paclitaxel alone in previously untreated locally advanced or metastatic non‐small‐cell lung cancer. J Clin Oncol 2004; 22: 2184–91. [DOI] [PubMed] [Google Scholar]
- 32. Park H‐R, Tomida A, Sato S, Tsukumo Y, Yun J. Effect on tumor cells of blocking survival response to glucose deprivation. J Natl Cancer Inst 2004; 96: 1300–10. [DOI] [PubMed] [Google Scholar]
- 33. Lu J, Kunimoto S, Yamazaki Y, Kaminishi M, Esumi H. Kigamicin D, a novel anticancer agent based on a new anti‐austerity strategy targeting cancer cells’ tolerance to nutrient starvation. Cancer Sci 2004; 95: 547–52. [DOI] [PMC free article] [PubMed] [Google Scholar]
- 34. Kaira K, Oriuchi N, Imai H et al. Prognostic significance of L‐type amino acid transporter I expression in resectable stage I–III nonsmall cell lung cancer. Br J Cancer 2008; 98: 742–8. [DOI] [PMC free article] [PubMed] [Google Scholar]
- 35. Kim DK, Kanai Y, Choi HW et al. Characterization of the system L amino acid transporter in T24 human bladder caricinoma cells. Biochim Biophys Acta 2002; 1565: 112–22. [DOI] [PubMed] [Google Scholar]
- 36. Kim CS, Cho S‐H, Chun HS et al. BCH, an inhibitor of system L amino acid transporters, induces apoptosis in cancer cells. Biol Pharm Bull 2008; 31: 1096–100. [DOI] [PubMed] [Google Scholar]
- 37. Tannock IF. Tumor physiology and drug resistance. Cancer Metastasis Rev 2001; 20: 123–32. [DOI] [PubMed] [Google Scholar]
- 38. Brown JM, Giaccia AJ. The unique physiology of solid tumors: opportunities (and problems) for cancer therapy. Cancer Res 1998; 58: 1408–16. [PubMed] [Google Scholar]
- 39. Tomida A, Turuo T. Drug resistance mediated by cellular stress response to the microenvironment of solid tumors. Anticancer Drug Des 1999; 14: 169–77. [PubMed] [Google Scholar]
- 40. McCormick F. Survival pathways meet their end. Nature 2004; 428: 267–9. [DOI] [PubMed] [Google Scholar]
- 41. Nave BT, Ouwens DM, Withers DJ, Alessi DR, Shepherd PR. Mammalian target of rapamycin is a direct target for protein kinase B: identification of a convergence point for opposing effects of insulin and amino‐acid deficiency on protein translation. Biochem J 1999; 344: 427–31. [PMC free article] [PubMed] [Google Scholar]
- 42. Huang S, Houghton PJ. Targeting mTOR signaling for cancer therapy. Curr Opin Pharmacol 2003; 3: 371–7. [DOI] [PubMed] [Google Scholar]
- 43. Yu K, Toral‐Barza L, Discafani C et al. mTOR, a novel target in breast cancer: the effect of CCI‐779, an mTOR inhibitor, in preclinical models of breast cancer. Endocr Relat Cancer 2001; 8: 249–58. [DOI] [PubMed] [Google Scholar]