Abstract
The antitumor activities of type III interferon (IFN) (interleukin [IL]‐28 and IL‐29) and the combination of type III IFN and type I IFN (IFN‐α) were evaluated using human non‐small cell lung cancer (NSCLC). The expression of type III and type I receptor complexes was detected in NSCLC lines. IL‐29 significantly inhibited the in vitro growth of a wide range of NSCLC lines in a dose‐dependent fashion. To a lesser degree, IL‐28A also displayed growth inhibitory activity. Antitumor activity of type III IFN is associated with cell cycle arrest at the G1 phase and apoptosis. IL‐29 upregulated cyclin‐dependent kinase inhibitor p21Waf1/Cip1 in cells sensitive, but not insensitive, to antiproliferative activity, and knockdown of p21 with small interfering RNA largely attenuated the antiproliferative effect. Intratumoral and systemic administration of IL‐29 inhibited OBA‐LK1 and LK‐1, but not A549, tumor growth in severe combined immunodeficiency mice. Immunohistochemical analyses demonstrated marked upregulated p21 and downregulated Ki‐67 expression in tumors treated with IL‐29. The interferon combination of IL‐29 and IFN‐α displayed a more effective antiproliferative effect and a more intense p21 expression than each reagent alone in vitro. Furthermore, interferon combination therapy suppressed in vivo NSCLC growth more effectively than interferon monotherapy. These findings demonstrate that type III IFN can mediate direct antitumor activities via increased p21 expression and induction of apoptosis and cooperate with type I IFN to elicit more efficient direct antitumor activities, and suggest the possibility that type III IFN might improve the efficacy and reduce the side‐effects of type I IFN cancer therapy. (Cancer Sci 2011; 102: 1977–1990)
Interleukin (IL)‐28 and IL‐29, designated as type III interferon (IFN), are recently identified class II cytokine receptor ligands that are distantly related to members of the IL‐10 family and the type I IFN family.( 1 , 2 , 3 ) Type III IFN expression is induced by virus infection or double‐stranded RNA.( 1 , 2 , 3 ) Type III IFN signals through the same heterodimeric receptor complex that is composed of the IL‐10Rβ and a novel IL‐28R.( 1 , 2 , 3 ) Type III IFN signaling induces many genes that are induced by signaling through IFN‐α/β receptors.( 1 , 2 , 3 ) These include genes such as myxovirus resistance‐A (MxA), 2′‐5′‐oligoadenylate synthetase 1 (OAS1), a double‐stranded RNA‐dependent protein kinase R (PKR) and double‐stranded RNA‐specific adenosine deaminase (ADAR), which mediate at least some of the antiviral and antiproliferative activities of type I IFN.( 1 , 2 , 3 )
Interferons are a large family of proteins having a wide variety of biological properties.( 4 ) These include inhibition of cell growth, activation of T cell and natural killer (NK) cell cytotoxicity, upregulation of MHC class I molecules, promotion of T helper type I responses and inhibition of angiogenesis.( 5 ) In particular, IFN‐α delivered either by recombinant protein or by viral or plasmid vectors has been shown to have potent antitumor effects in mouse tumor models.( 5 ) To date, IFN‐α has been approved for treatment of patients with renal cell carcinoma, metastatic melanoma and chronic myelogeneous leukemia.( 6 )
Type III IFN exerts bioactivities that overlap those of type I IFN.( 1 , 2 , 3 ) Similar to type I IFN, type III IFN has also been demonstrated to elicit antitumor activity.( 7 , 8 , 9 , 10 , 11 , 12 , 13 , 14 , 15 , 16 ) Nevertheless, to date, studies evaluating the antitumor action of type III IFN have been limited to a relatively narrow range of pathological types of human tumors.( 7 , 8 , 9 , 10 , 11 , 12 ) In addition, the precise efficacy of interferon combination therapy of type III IFN and type I IFN has not been examined yet. In the present study, we evaluated the efficacy and mechanisms of direct antitumor activity of type III IFN alone and the combination of type III IFN with type I IFN against human non‐small cell lung cancer (NSCLC) in both in vitro and in vivo studies.
Materials and Methods
Cells, mice and reagents. Human NSCLC lines Sq‐1, Sq‐19, LK‐1, LK‐2, OBA‐LK1, 11–18, LK‐79, 86‐2, Lu99, EBC‐1 and A549 were supplied by Cell Resource Center for Biomedical Research, Institute of Development, Aging and Cancer, Tohoku University (Sendai, Japan). NCI‐H23 was provided by Hiroyuki Achiwa, Department of Internal Medicine and Molecular Science, Nagoya City University Graduate School of Medical Sciences (Nagoya, Japan). Malignant mesothelioma line H28 was from Yasuhiko Nishioka, The University of Tokushima (Tokushima, Japan). These lines were maintained in RPMI 1640 supplemented with 10% fetal calf serum (FCS) (MP Biomedicals, Irvine, CA, USA), 2 mM l‐glutamine, 0.1 mM non‐essential amino acids (NEAA), 100 IU/mL penicillin and 100 μg/mL streptomycin (all from Sigma, St Louis, MO, USA). Severe combined immunodeficiency (SCID) mice were from Charles River (Yokohama, Japan). IL‐28A, IL‐29, TNF‐α, anti‐human IL‐28R monoclonal antibody (mAb), anti‐human IFN‐αRα mAb and anti‐human IFN‐αRβ mAb were from R&D Systems (Minneapolis, MN, USA). IFN‐α (Sumiferon [NAMALWA]) was provided by Sumitomo Pharmaceutical Company (Tokyo, Japan). Rabbit anti‐asialo GM1 antiserum was from Wako Chemicals (Tokyo, Japan). Anti‐p16 and anti‐p27 antibodies were from Calbiochem (La Jolla, CA, USA). Anti‐p21 antibody was from Santa Cruz Biotechnology (Santa Cruz, CA, USA).
Flow cytometric analysis. Cells were treated with or without 50 ng/mL IL‐28A, 50 ng/mL IL‐29 or 50 ng/mL IFN‐α for 24 h, harvested and washed twice with phosphate‐buffered saline (PBS) containing 0.1% NaN3. Cells (1 × 10⁶) were incubated with anti‐human IL‐28R mAb, anti‐human IFN‐αRα mAb, anti‐human IFN‐αRβ mAb (R&D Systems) or with irrelevant mouse IgG1 or IgG2A (eBioscience, San Diego, CA, USA) at 4°C for 30 min. After washing three times with PBS, the cells were incubated with phycoerythrin (PE)‐conjugated goat anti‐mouse IgG F(ab)2 (R&D Systems) at 4°C for 15 min. Expression of IL‐28R, IFN‐αRα and IFN‐αRβ on the NSCLC lines was determined by flow cytometric analysis (Beckman Coulter, Miami, FL, USA).
3‐[4,5‐dimethylthiazol‐2‐yl]‐2,5‐diphenyltetrazolium bromide (MTT) assay. MTT assay was performed as described previously.( 17 ) Briefly, cells (1 × 10³ or 3 × 10³/50 μL) were seeded into 96‐well plates (Becton Dickinson Labware, Franklin Lakes, NJ, USA). After 17 h, 50 μL of RPMI 1640 containing 10% FCS with or without interferon(s) were added to each well (day 0). After incubation for 5 days at the indicated final concentrations of interferon(s), 10 μL of MTT (Dojindo, Kumamoto, Japan) solution (5 mg/mL in RPMI 1640 with 10% FCS) was added to each well and plates were incubated for 4 h. Next, MTT solution was removed and 100 μL of dimethylsulfoxide (Sigma) was added to each well. In some experiments, the MTT assay was done every day. The absorbance (A) was read at a wavelength of 590 nm on an enzyme‐linked immunosorbent assay (ELISA) plate reader (Molecular Devices, Sunnyvale, CA, USA). The percentage of cell growth was determined by the previously reported formula:( 18 , 19 )
 |
Apoptosis assay. Cells were seeded into 96‐well plates (Becton Dickinson Labware). After overnight culture, cells were treated with or without 50 ng/mL IL‐28A, 50 ng/mL IL‐29, 50 ng/mL IFN‐α or combinations for 24 or 48 h. Cells were also treated with cisplatin (20 μM) as positive control.( 20 ) To detect cell death via apoptosis induced by interferons, a cell death detection ELISA kit (Cell Death Detection ELISA plus; Roche Applied Science, Nutley, NJ, USA) was used according to the manufacturer’s instructions. Results for the negative control (medium alone) were set to 10, and all other measurements were normalized to the control for the purpose of comparison.( 21 ) To identify cell death at an earlier stage, the Annexin V‐PE apoptosis detection kit was used according to the manufacturer’s instructions. Briefly, 5 × 10⁵ cells were seeded into 6‐well plates. After overnight culture, the medium was replaced with fresh medium with or without stimulation. Twenty‐four or 32 h later, the cells were harvested and resuspended in 0.5 mL of cold Annexin V binding buffer (10 nM HEPES, 140 mM NaCl, 2.5 mM CaCl2). Annexin V‐PE and 7‐amino‐actinomycin D were added and incubated in the dark at room temperature for 15 min. The treated cells were collected with low‐speed centrifugation for 5 min and resuspended in 0.5 mL of cold binding buffer. The cells were analyzed immediately on a FACScan (Becton Dickinson, San Jose, CA, USA).
Reverse transcription polymerase chain reaction (RT‐PCR). Cells were harvested and total RNA was extracted using RNA Bee (TEL‐TEST, Friendswood, TX, USA), and used as a template for one‐step RT‐PCR with Superscript One‐Step RT‐PCR with a Platinum Taq kit (Invitrogen Corp., Carlsbad, CA, USA). The primer sequences of the oligonucleotides used for PCR in the present study were as follows: IL‐28R, sense: 5′‐GGGAACCAAGGAGCTGCTATG‐3′, antisense: 5′‐TGGCACTGAGGCAGTGGTGTT‐3′; IL‐10Rβ, sense: 5′‐GTAAACGCACCACAGCAAG‐3′, antisense: 5′‐TATTGGACCCCCTGGAATG‐3′; IFN‐αRα, sense: 5′‐CTTTCAAGTTCAGTGGCTCCACGC‐3′, antisense: 5′‐TCACAGGCGTGTTTCCAGACTG‐3′; IFN‐αRβ, sense: 5′‐GAAGGTGGTTAAGAACTGTGC‐3′, antisense: 5′‐CCCGCTGAATCCTTCTAGGACGG‐3′; and glyceraldehyde 3‐phosphate dehydrogenase (GAPDH), sense: 5′‐GCAGGGGGGAGCCAAAAGGG‐3′, antisense: 5′‐TGCCAGCCCCAGCGTCAAAG‐3′.
Quantitative real‐time RT‐PCR. In the quantitative RT‐PCR experiments, cells were cultured with or without the indicated interferon(s) for 12 or 24 h, and the RNA of the cultured cells was extracted as described above. The mRNA expression of OAS1, PKR, ADAR, IL‐28R, IFN‐αRα and IFN‐αRβ was determined with quantitative RT‐PCR using TaqMan Gene Expression Assays (Applied Biosciences, Carlsbad, CA, USA). Simultaneously, mRNA expression of the control housekeeping gene, GAPDH, was determined using Pre‐Developed TaqMan Assay Reagents for human GAPDH. Real‐time RT‐PCR application was carried out in triplicate in 50 μL reaction volumes containing 4 ng total RNA for each specific reaction using a TaqMan One‐Step RT‐PCR Master Mix Reagents Kit (Applied Biosystems) according to the manufacturer’s recommendations. Expression levels of IFN‐inducible gene mRNAs were normalized with respect to GAPDH mRNA expression and expressed as a ratio (relative expression).
Cell cycle analysis. Cell cycle analyses were performed as previously described.( 22 ) In brief, after the cells were washed twice with PBS, they were suspended in a propidium iodide (PI) solution (50 μg/mL PI, 0.1% sodium citrate, 0.2% NP‐40, 0.25 mg/ml RNase), and then incubated for 30 min at 4°C. Cell cycle distribution was determined with a FACScan (Becton Dickinson) and analyzed using ModFit software (Verity Software House, Turramurra, NSW, Australia).
Western blot analysis. Cells were cultured in medium with or without 50 ng/mL IL‐29 for the indicated durations (0, 6, 12 or 24 h). Total cellular extracts were prepared using Cell Lysis Buffer (Cell Signaling Technology, Beverly, MA, USA) and boiled for 3 min. Thirty micrograms of proteins were loaded on a sodium dodecyl sulfate polyacrylamide gel. After electrophoresis, proteins were electrotransferred onto polyvinylidene difluoride membranes (Millipore, Billerica, MA, USA). Membranes were incubated with respective antibodies according to the manufacturer’s instructions, and then with horseradish peroxidase‐conjugated secondary antibodies (Amersham, Arlington Heights, IL, USA) for 1 h. The immunoreactive proteins were visualized with the ECL Plus chemiluminescence system (Amersham). The same membrane was reprobed with anti‐β‐actin Ab (AC‐15; Sigma) as a control. The intensity of bands was analyzed using an image analysis software MultiGauge (Fujifilm, Tokyo, Japan).
RNA interference. Knockdown of p21 through the delivery of double‐stranded RNA molecules into the NSCLC cells was performed using SignalSilence p21Waf1/Cip1 siRNA Kit (Cell Signaling Technology) according to the manufacturer’s instructions. The cells transfected with a p21‐specific double‐stranded small inhibitory RNA (p21‐siRNA) oligonucleotide to inhibit p21 expression or a non‐targeted negative control oligonucleotide (control‐siRNA) were treated with or without IL‐29 for the indicated time period. Cell growth was examined by MTT assay as described above.
Evaluation of in vivo tumor growth. To deplete NK cells in SCID mice, 20 μL of anti‐asialo GM1 antiserum (Wako Chemicals) was administered intraperitoneally 1 day prior to tumor inoculation, and subsequently once every 5 days. The SCID mice were inoculated subcutaneously with 1.3 × 10⁷ OBA‐LK1 cells, 1.5 × 10⁷ LK‐1 cells or 1.2 × 10⁷ A549 cells into the right flank. Tumor volume was calculated by using the formula ab2/2 (a = largest diameter; b = smallest diameter).( 21 ) For intratumoral therapy, IL‐29, IFN‐α, IL‐29 plus IFN‐α or PBS in a total volume of 100 μL was injected directly into tumor tissues (120–170 mm3) for 21 consecutive days. For systemic therapy, IL‐29 or PBS in a total volume of 150 μL was administered subcutaneously at the contralateral site to the tumor (80–100 mm3) for 15 consecutive days.
Immunohistological examination. Tumor tissues were harvested from SCID mice, fixed in 4% buffered paraformaldehyde, embedded in paraffin and sectioned with a microtome. Sections were deparaffinized in xylene, and dehydrated in graded concentrations of ethanol. Standard hematoxylin and eosin staining and several immunochemical stainings were performed. To evaluate tumor angiogenesis, immunostaining for Factor VIII‐related antigen was performed as described previously.( 23 ) p21 immunoreactivity in the tumor tissues was also evaluated. After deparaffinization, sections were autoclaved and incubated with anti‐human p21 antibody (Santa Cruz Biotechnology) at a dilution of 1:50. Immunohistochemistry was performed using a Histofine Simple Stain kit (Nichirei, Tokyo, Japan), and the sections were subsequently counterstained with hematoxylin. Cells exhibiting distinct nuclear staining were considered positive for p21, and the percentages of positive‐stained cells were determined. Two independent investigators examined the stained sections. For p21 immunostaining, sections were autoclaved and incubated with anti‐p21 antibody. Immunohistochemistry was performed using a Histofine Simple Stain kit (Nichirei). Cells exhibiting distinct nuclear staining were considered positive for p21, and the percentages of positive‐stained cells were determined. Analysis of the biological effects of type III and type I IFN on the cell proliferation of NSCLC in vivo was performed with Ki‐67 immunostaining using MIB‐1 Ab (Immunotech, Marseilles, France). Sections were deparaffinized and autoclaved in acetate buffer at 120°C for 5 min. After cooling, slides were incubated overnight at 4°C with MIB‐1 Ab or normal mouse IgG (R&D Systems). After washing, sections were then incubated with biotinylated rabbit anti‐mouse IgG and HRP‐conjugated streptavidin (Nichirei). Sections were developed with 3,3′‐diaminobenzidine (DAB) and counterstained with hematoxylin. The proliferating cells were estimated by the percentage of Ki‐67 positive‐stained cells in 10 randomly chosen HPF for each section (×400).
Statistical analyses. Statistical analysis was performed using an unpaired two‐tailed Student’s t‐test with confirmation by parametric and F‐tests. Differences were considered to be statistically significant when the P‐value was <0.05.
Results
Expression of IL‐28R, IL‐10Rβ, IFN‐αRα and IFN‐αRβ. We first examined expression of the receptor subunits for type III IFN in 12 NSCLC lines and malignant mesothelioma line H28 by RT‐PCR. The transcript for IL‐28R was expressed in 12 NSCLC lines (data not shown). In contrast, the transcript for IL‐28R was not detected in malignant mesothelioma line H28 (data not shown). However, the expression of mRNA for IL‐10Rβ, IFN‐αRα and IFN‐αRβ was detected in all cell lines (data not shown). We further examined the surface expression of IL‐28R, IFN‐αRα and IFN‐αRβ on six NSCLC lines and malignant mesothelioma line H28 by flow cytometric analysis. Relatively high levels of IL‐28R expression on the cell surface of OBA‐LK1 and Sq‐19 were observed (Fig. 1). In contrast, relatively low levels of IL‐28R expression were found in NCI‐H23 and A549 lines. The NSCLC lines 11–18 and LK‐1 were intermediate with regard to IL‐28R expression. However, we could not detect IL‐28R expression on the cell surface of H28 (Fig. 1). Therefore, the differential sensitivity of human NSCLC lines to the antiproliferative action of type III IFN can not completely be attributable to the levels of the surface expression of type III IFN receptor subunit IL‐28R. For example, Sq‐19 line, which displays relatively high levels of surface expression of IL‐28R, is resistant to the antiproliferative activity of type III IFN, whereas 11–18 line, which expresses relatively low levels of surface IL‐28R, responds well to the growth inhibitory action of IL‐29. Taken collectively, the sensitivity of cells to the antiproliferative action of type III IFN does not completely correspond to the levels of surface IL‐28R expression. In addition, in NSCLC lines tested, the levels of surface membrane IFN‐αRα expression are not markedly different, except for A549, which expresses relatively low levels of surface IFN‐αRα and relatively high levels of surface IFN‐αRβ, as shown in Figure 1. In addition, the levels of surface membrane IFN‐αRβ expression on NSCLC A549 and NCI‐H23 lines are relatively high. In contrast, the levels of surface IFN‐αRβ expression on OBA‐LK1 and LK‐1 lines are relatively low. Therefore, we could not conclude that the levels of IFN‐αRα and IFN‐αRβ expression directly correspond to the sensitivity of NSCLC lines to type I IFN‐mediated growth‐suppressive action.
Figure 1.
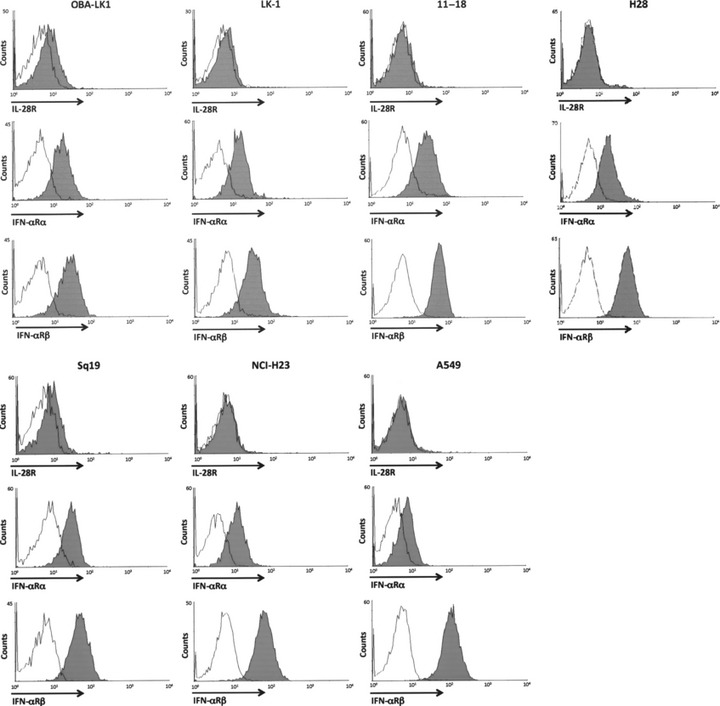
Expression of IL‐28R and interferon (IFN)‐α receptors. Six different human non‐small cell lung cancer (NSCLC) lines, Sq‐19, NCI‐H23, A549, OBA‐LK1, LK‐1 and 11–18, and malignant mesothelioma line H28 were incubated with mouse anti‐human IL‐28R mAb (grey shade), anti‐human IFN‐αRα mAb (grey shade), anti‐human IFN‐αRβ mAb (grey shade) or irrelevant mouse IgG1 (thin line), followed by PE‐conjugated goat anti‐mouse IgG F(ab)2. Expression of IL‐28R on the surface of NSCLC lines and the malignant mesothelioma line was analyzed by flow cytometry.
Type III IFN elicits direct antitumor activity. There have been no reports investigating the antitumor actions of type III IFN against human NSCLC. Therefore, we evaluated the growth inhibitory activities of IL‐28A and IL‐29 on 12 human NSCLC lines by MTT assay. IL‐29 displayed growth inhibitory activities against a wide range of NSCLC lines in a dose‐response manner (Fig. 2a,b, Table 1). IL‐28A also showed an antiproliferative effect on a very limited range of NSCLC lines to a lesser extent (Fig. 2a,b, Table 1). However, the degree of sensitivity of NSCLC lines to the growth suppressive action of IL‐29 varied all the way (Table 1). In terms of the degree of growth inhibition, NSCLC lines were divided into three categories: sensitive, intermediate and insensitive, based on the responsiveness to the growth inhibitory activity of type III IFN (Table 1). Among the NSCLC lines tested, 11–18, OBA‐LK1 and 86‐2 cells were susceptible to type III IFN‐mediated growth suppression. Lu99, NCI‐H23, EBC‐1, LK‐2, Sq‐19 and A549 cells were insensitive, and Sq‐1, LK‐79 and LK‐1 cells were intermediate in sensitivity.
Figure 2.
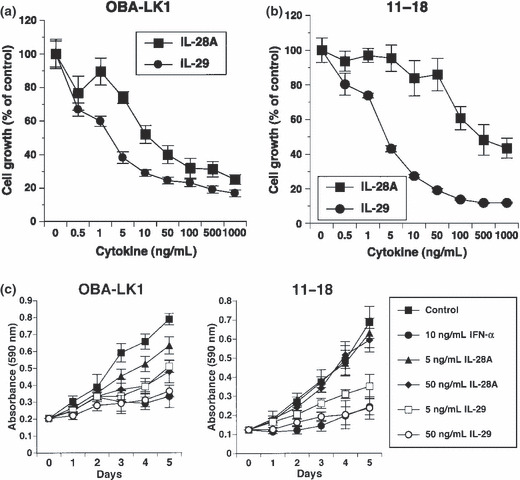
Antitumor activity of type III interferon (IFN) in vitro. (a,b) Antiproliferative effects of different concentrations of interleukin (IL)‐28A or IL‐29 on non‐small cell lung cancer (NSCLC) cell lines were assessed by MTT assay. Cells were incubated in medium supplemented with or without the indicated concentrations of IFN for 5 days, and the MTT assay were performed as described in the Materials and Methods. Each value represents mean percentage cell growth ± SD (n = 5). The results are representative of three independent experiments. (c) Time course of growth inhibition of OBA‐LK1 and 11–18 NSCLC lines by 5 or 50 ng/mL IL‐28A, 5 or 50 ng/mL IL‐29 or 10 ng/mL IFN‐α was assessed by MTT assay for five consecutive days. Each value represents the mean absorbance ± SD (n = 5). The results are representative of three independent experiments.
Table 1.
Antiproliferative activity of interleukin (IL)‐28A, IL‐29, interferon (IFN)‐α, IL‐28A plus IFN‐α and IL‐29 plus IFN‐α against human non‐small cell lung cancer (NSCLC)
| NSCLC cell lines | Antiproliferative effect (IC50 [ng/mL]) | ||||
|---|---|---|---|---|---|
| IL‐28A | IL‐29 | IFN‐α | IL‐28A + 10 ng/mL IFN‐α | IL‐29 + 10 ng/mL IFN‐α | |
| Squamous cell carcinoma | |||||
| Sq‐1 (intermediate) | 800 | 500 | 30 | 700 | 500 |
| Sq‐19 (insensitive) | 1500 | 1300 | 50 | 1300 | 1200 |
| LK‐2 (insensitive) | 1500 | 1300 | 300 | 1000 | 800 |
| LK‐79 (intermediate) | 1700 | 1000 | 50 | 1000 | 50 |
| EBC‐1 (insensitive) | 1300 | 1200 | 3 | 100 | 15 |
| Adenocarcinoma | |||||
| 11–18 (sensitive) | 500 | 20 | 1 | 50 | 1 |
| LK‐1 (intermediate) | 1300 | 700 | 100 | 700 | 15 |
| NCI‐H23 (insensitive) | 2500 | 1300 | 1200 | 900 | 700 |
| Large cell carcinoma | |||||
| OBA‐LK1 (sensitive) | 10 | 3 | 0.7 | 0.3 | 0.2 |
| 86‐2 (sensitive) | 100 | 50 | 5 | 70 | 20 |
| Lu99 (insensitive) | 2000 | 1700 | 1500 | 2000 | 1600 |
| Alveolar cell carcinoma | |||||
| A549 (insensitive) | 2200 | 1500 | 1400 | 1700 | 1300 |
The antiproliferative activity of type III IFN (IL‐28A or IL‐29), type I IFN (IFN‐α) or a combination against NSCLC lines is shown as IC50 under the condition that NSCLC lines are treated with type III IFN, type I IFN or a combination (10 ng/mL IFN‐α + type III IFN) for 5 days.
Type III IFN induces apoptotic cell death. To understand the underlying mechanisms of the observed direct antitumor activity, we first evaluated apoptotic cell death. A DNA fragmentation ELISA was performed to assess apoptotic cells using NSCLC lines sensitive or insensitive to type III IFN‐induced antiproliferative activity. No apoptotic DNA fragmentation in cells treated with type III IFN alone for 24 h was observed, whereas cisplatin induced a significant increase of DNA fragmentation in all cell types (data not shown). In contrast, apoptotic DNA fragmentation in cells treated with 50 ng/mL type III IFN or 50 ng/mL type I IFN alone for 48 h was clearly observed (Fig. 3a). The combination of type III IFN and type I IFN mediated apoptotic DNA fragmentation in NSCLC line OBA‐LK1 more efficiently than each IFN alone (Fig. 3a). Moreover, we investigated early apoptotic cell death using Annexin V assay by flow cytometry. OBA‐LK1 cells treated with 20 μM cisplatin or 10 ng/mL TNF‐α for 24 h underwent apoptosis, whereas treatment with 50 ng/mL type III IFN or 50 ng/mL type I IFN for 24 h only slightly increased the Annexin V‐positive cells compared with the control (data not shown). Furthermore, the percentage of Annexin V‐positive cells increased in NSCLC cells treated with 50 ng/mL IL‐28A, 50 ng/mL IL‐29, 50 ng/mL IFN‐α or combination for 36 h compared with the non‐treated control (Fig. 3b). In addition, treatment with the combination of type III IFN and type I IFN for 36 h increased the Annexin V‐positive cells in NSCLC line OBA‐LK1 compared with the individual IFN alone (Fig. 3b).
Figure 3.
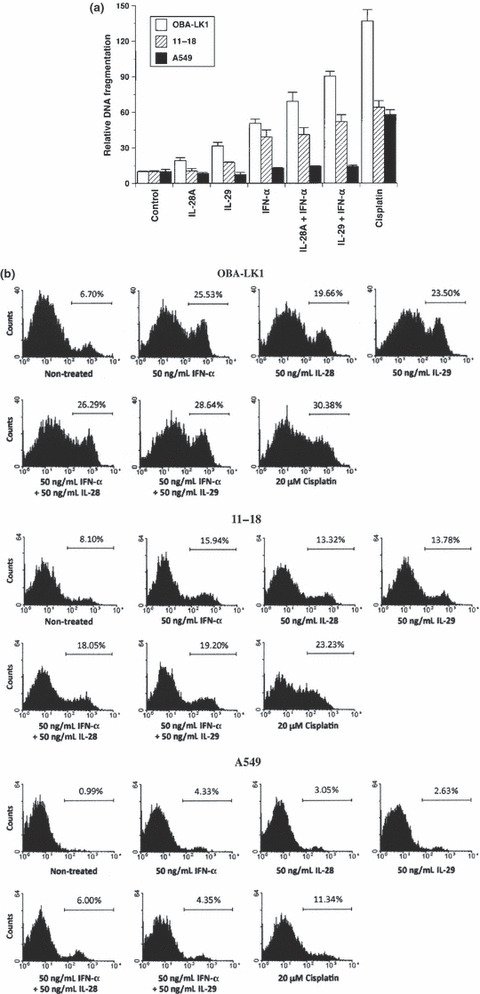
Biological effects of type III interferon (IFN) on apoptotic cell death. (a) Non‐small cell lung cancer (NSCLC) cell lines were cultured in medium supplemented with 50 ng/mL interleukin (IL)‐28A, 50 ng/mL IL‐29, 50 ng/mL IFN‐α, 50 ng/mL IL‐28A plus 50 ng/mL IFN‐α, 50 ng/mL IL‐29 plus 50 ng/mL IFN‐α or 20 μM cisplatin. After 24‐ or 48‐h incubation, DNA fragmentation was analyzed using a Cell Death Detection ELISA. Each value is normalized to the negative control (non‐treated) and represents the mean relative DNA fragmentation ± SD (n = 5). (b) Cells were treated with or without the indicated interferon(s) or cisplatin for 24 or 36 h. Cells were incubated with Annexin V‐PE in a buffer containing 7‐AAD and analyzed using flow cytometry. Y‐axis, cell number; X‐axis, Annexin V‐PE.
Type III IFN induces cell cycle arrest at the G1 phase. Next we investigated the biological effect of IL‐29 on cell cycle distribution analysis using NSCLC lines OBA‐LK1 and 11–18, which were sensitive to antiproliferative activity of IL‐29, showed that IL‐29 resulted in an accumulation of cell numbers in the G1 phase in a dose‐dependent manner (Fig. 4a). OBA‐LK1 cells treated with 50 or 250 ng/mL IL‐29 increased the G1 population from 53% to 69% or 80%, and identical treatment of 11–18 cells increased the G1 population from 30% to 61% or 79%, respectively. This increase in the G1 population is accompanied by a reduction of S and G2 populations (Fig. 4a). In contrast, there was no change in the proportion of cell cycle distribution in A549 cells, which were insensitive to the growth inhibitory activity of IL‐29 (Fig. 4a).
Figure 4.
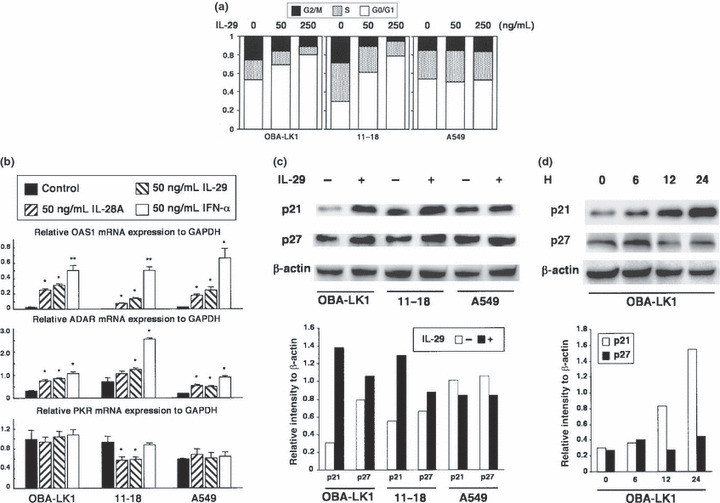
Effect of interleukin (IL)‐29 on cell cycle distribution and expression of cyclin‐dependent kinase inhibitors. (a) Non‐small cell lung cancer (NSCLC) cell lines were cultured in medium supplemented with or without 50 or 250 ng/mL IL‐29 for 48 h, stained with propidium iodide and analyzed using FACScan. The results are representative of three independent experiments. (b) NSCLC cell lines were treated with the indicated interferon and mRNA were prepared as described in the Materials and Methods. Messenger RNA expression of OAS1, ADAR and PKR was determined by quantitative RT‐PCR. Each value is normalized to mRNA expression of GAPDH and represents mean ± SD (n = 3; *P < 0.05; **P < 0.001 vs control). The results are representative of two independent experiments. (c,d) OBA‐LK1, 11–18 and A549 cells were treated with or without 50 ng/mL IL‐29 for 24 h. Induction of cyclin‐dependent kinase inhibitors by IL‐29 in NSCLC lines was evaluated using western blot analysis. Time course analysis of the induction of p21 and p27 in OBA‐LK1 cells treated with 50 ng/mL IL‐29 is also presented. β‐Actin was used as a loading control. Relative intensity of p21 and p27 normalized to β‐actin is presented in the bar graph.
Type III IFN markedly upregulates a cyclin‐dependent kinase inhibitor p21Waf1/Cip1. To assess the mechanism of cell cycle arrest induced by type III IFN, we first examined the OAS1, PKR and ADAR expression levels.( 24 , 25 , 26 , 27 ) A quantitative RT‐PCR analysis showed that IL‐29 as well as IFN‐α upregulated mRNA expression for OAS1 and ADAR in type III IFN‐sensitive OBA‐LK1 and 11–18 cells (Fig. 4b). These molecules were also upregulated in A549, which was insensitive to the growth inhibitory effect of IFN. Furthermore, the transcript of PKR was not influenced by any cytokines tested. These findings strongly suggested that some other molecules were mainly accountable for the antiproliferative effect of type III IFN.
Next we focused on the cyclin‐dependent kinase inhibitors including p16Ink4a, p21Waf1/Cip1 and p27Kip1, which were reported to be involved in cell cycle arrest at the G1 phase. Western blot analysis showed that p21 and p27 were detected in NSCLC cells, and that IL‐29 led to a significantly increased expression of p21 in OBA‐LK1 and 11–18, but not in A549 (Fig. 4c). The p21 expression in OBA‐LK1 increased time dependently in response to IL‐29 (Fig. 4d). In contrast, p27 expression was not influenced (Fig. 4c). Expression of p16 was detected only in LK‐1, and not upregulated by IL‐29 (data not shown).
Upregulation of p21Waf1/Cip1 is involved in the antiproliferative effect of IL‐29 on OBA‐LK1 cells. Increased expression of p21 is responsible for G1 phase arrest in many kinds of cells. To examine whether the upregulation of p21 is involved in the antiproliferative effect of IL‐29 on NSCLC cell lines, we performed siRNA‐mediated p21 knockdown. OBA‐LK1 cells were transfected with a p21‐specific siRNA( 28 ) or a control‐siRNA, and treated with 50 ng/mL IL‐29. Western blot analysis revealed that introduction of the p21‐siRNA efficiently reduced the expression of p21 in OBA‐LK1 cells for 48 h in the condition of 50 ng/mL IL‐29 treatment (Fig. 5a). We therefore examined the effect of siRNA on OBA‐LK1 cells treated with various concentrations of IL‐29 for 48 h (Fig. 5b). The antiproliferative effect in response to incremental concentrations of IL‐29 was significantly alleviated in p21‐siRNA transfected cells compared with non‐transfected cells. Introduction of the control‐siRNA did not affect the antiproliferative effect of IL‐29 on OBA‐LK1 cells (Fig. 5b), confirming that this alleviation of the antiproliferative effect depended on the p21‐specific siRNA, and was not the result of any cell damage by transfection or introduction of the siRNA itself. These findings directly indicated that the upregulation of p21 expression is involved in IL‐29‐induced antiproliferative effect on NSCLC lines.
Figure 5.
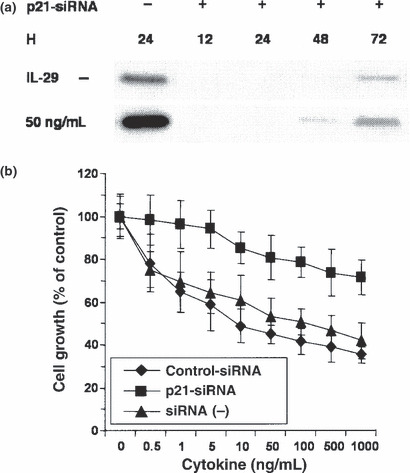
RNA interference inhibited interleukin (IL)‐29‐induced p21 upregulation and counteracted the antiproliferative effect. (a) OBA‐LK1 cells were transfected with or without a p21‐specific double‐stranded small inhibitory RNA (p21‐siRNA) oligonucleotide. Induction of p21 protein in the cells in response to 50 ng/mL IL‐29 was examined using western blot analysis as described in the Materials and Methods. (b) The antiproliferative effect of IL‐29 on the different population of OBA‐LK1 cells was assessed by MTT assay. Cells were transfected with or without a p21‐siRNA oligonucleotide or a non‐targeted control oligonucleotide, and siRNA(−) cells were cultured in medium supplemented with a transfection reagent. Cells were then incubated in the medium supplemented with incremental concentrations of IL‐29 for 48 h. Each value represents mean percentage cell growth ± SD (n = 5). The results are representative of three independent experiments.
Type III IFN suppresses in vivo tumor growth. To examine the antitumor activities of type III IFN in vivo, mice were implanted with NSCLC cells. Animals, which had developed palpable tumor nodules, were treated with daily intratumoral injections of IL‐29. In the case of OBA‐LK1 and LK‐1 tumors, which were sensitive or intermediate to the antiproliferative action of IL‐29 in vitro, mice treated with IL‐29 displayed a significant reduction in tumor volume in a dose‐dependent manner compared with mice treated with PBS (Fig. 6a,b). Three weeks after treatment initiation, mice administered with 0.05, 0.4 or 1.5 μg IL‐29 showed a 30%, 66% or 69% reduction in OBA‐LK1 tumor volume (Fig. 6a), and a 22%, 35% or 50% reduction in LK‐1 tumor volume compared with the controls (Fig. 6b). In addition, systemic treatment at a dose of 0.4, 1.5 or 7 μg per mouse per day resulted in a 20%, 47% or 65% reduction in tumor volume compared with the controls (Fig. 6d). However, tumor regression and rejection were not observed. Moreover, in both strategies, type III IFN treatment did not appear to cause significant adverse reactions in mice. In contrast, in the case of A549 tumor, which was insensitive to the growth inhibitory activity of IL‐29 in vitro, we found that treatment with daily intratumoral injections of 400 ng IL‐29 did not mediate significant suppression of in vivo growth (PBS vs IL‐29; P = 0.1936) (Fig. 6c). In contrast, treatment with daily intratumoral injections of 400 ng IFN‐α elicited significant suppression of in vivo growth (PBS vs IFN‐α; P < 0.05) (Fig. 6d).
Figure 6.
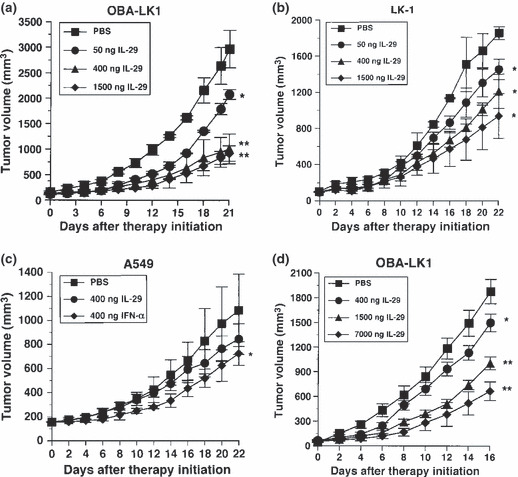
Antitumor activity of interleukin (IL)‐29 in vivo. (a–c) Intratumoral therapy of established OBA‐LK1, LK‐1 and A549 tumors in severe combined immunodeficiency (SCID) mice with IL‐29. Each value represents mean tumor volume (mm3) ± SD for five mice per group (*P < 0.05; **P < 0.001 vs PBS, on day 21 or day 22 after therapy initiation). The results are representative of two independent experiments. (d) Daily systemic therapy of established OBA‐LK1 tumors in SCID mice with IL‐29. Each value represents mean tumor volume (mm3) ± SD for four mice per group (*P < 0.05; **P < 0.0001 vs PBS, on day 16 after therapy initiation). The results are representative of two independent experiments.
To assess the mechanism of the in vivo antitumor effect, we performed histological and immunohistochemical examinations. There was little difference between IL‐29‐treated and PBS‐treated tumors in terms of cellularity and presence of stroma (Fig. 7a). Immunohistochemical staining for vascular endothelial cells to probe the possible contribution of the inhibition of angiogenesis to the observed growth suppression of tumors revealed that IL‐29 did not affect tumor vascularity (Fig. 7). In contrast, p21 accumulated more in the tumors treated with IL‐29 than the tumors treated with PBS (Fig. 7a). The percentage of p21 positive‐staining cells in the tumors treated with 7 μg daily systemic therapy was significantly higher than that in the tumors treated with PBS (27.8 ± 3.0%vs 18.3 ± 5.4%, P < 0.03). Furthermore, the percentage of Ki‐67‐positive cells in the OBA‐LK1 tumor tissues treated with IL‐29 was significantly lower than that treated with PBS (Fig. 7b). In addition, the percentage of Ki‐67‐positive cells in OBA‐LK1 tumors treated with IFN‐α was lowest among the three treatment groups. However, vascular density of OBA‐LK1 tumor tissues treated with IL‐29 was not changed compared with that of tumor tissues treated with PBS, whereas IFN‐α treatment decreased the vascular density of OBA‐LK1 tumor tissues compared with that of tumor tissues treated with IL‐29 or PBS (Fig. 7a,b).
Figure 7.
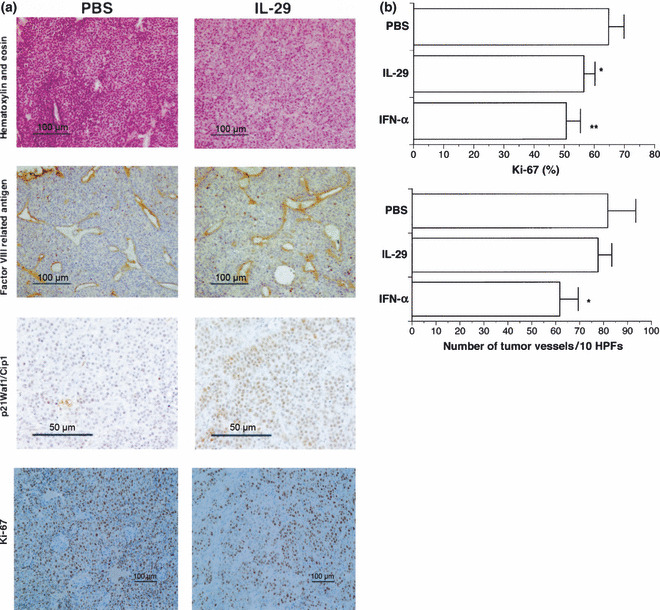
Histological and immunohistochemical examination of non‐small cell lung cancer (NSCLC) tissues. (a) Tumor tissues were excised from severe combined immunodeficiency (SCID) mice, fixed in 4% buffered paraformaldehyde and embedded in paraffin. Representative photomicrographs show a typical immunochemical appearance in OBA‐LK1 tumor tissues from PBS treatment and systemic interleukin (IL)‐29 treatment group. (b) Proliferation and angiogenesis were detected using anti‐Ki‐67 Ab and anti‐Factor VIII‐related antigen Ab, respectively. Graphs show the change in Ki‐67‐positive cells and blood vessel number of the tumor tissues. Data represent the mean ± SD (n = 5) (*P < 0.05; **P < 0.007 vs PBS). HPF, high‐powered field.
Interferon combination elicits more effective antitumor effect than each reagent alone. Because type III IFN signals through the heterodimeric receptor complex, which is quite different from the IFN‐αR complex, we compared the growth inhibitory activity of increasing doses of type III IFN alone to the inhibitory action of increasing doses of type III IFN in combination with 10 and/or 50 ng/mL IFN‐α. The interferon combination showed a more effective antiproliferative effect over the whole IFN‐α concentration range tested (Fig. 8, Table 1).
Figure 8.
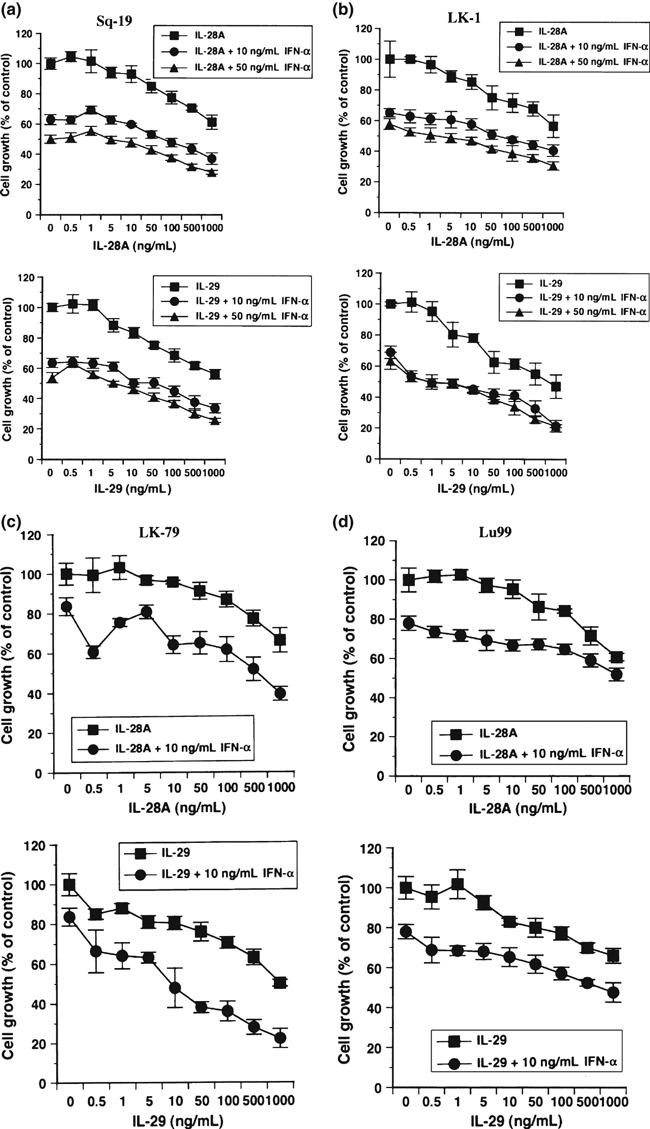
Antitumor activity of interferon (IFN) combination in vitro. (a–d) Effect of the combination of either interleukin (IL)‐28A plus 10 and/or 50 ng/mL IFN‐α or IL‐29 plus 10 and/or 50 ng/mL IFN‐α on the in vitro growth of non‐small cell lung cancer (NSCLC) lines was examined. The absorbance derived from cells exposed to the respective concentrations of interferon(s) is expressed as a percentage of absorbance of control. (a) Sq‐19; (b) LK‐1; (c) LK‐79; and (d) Lu99. Each value represents the mean percentage cell growth ± SD (n = 5). The result is a representative of two independent experiments. The results display an additive cytostatic effect of this interferon combination over the entire IL‐28A or IL‐29 concentration range tested.
Type I IFN IFN‐α upregulates IL‐28R expression, whereas type III IFN downregulates IFN‐αRα expression. To further examine the underlying mechanisms, we next investigated whether the receptor for type III IFN (IL‐28R) is regulated by type I IFN. As shown in Figure 9(c), IL‐28R expression on the surface membrane of NSCLC lines was slightly upregulated after incubation with 50 ng/mL IFN‐α for 24 h, except for the Sq‐19 line, in which IL‐28R expression was not affected. In contrast, downregulation of IFN‐αRα on the surface of NSCLC lines was observed in 50 ng/mL type III IFN treatment for 24 h (Fig. 9c). However, type III IFN did not affect the expression of IFN‐αRβ on NSCLC lines. These findings strongly suggest that type I IFN could alter the responsiveness of NSCLC lines to type III IFN via upregulation of the expression of IL‐28R. Type III IFN also influences the responsiveness of NSCLC lines through the downregulation of type I IFN receptor IFN‐αRα.
Figure 9.
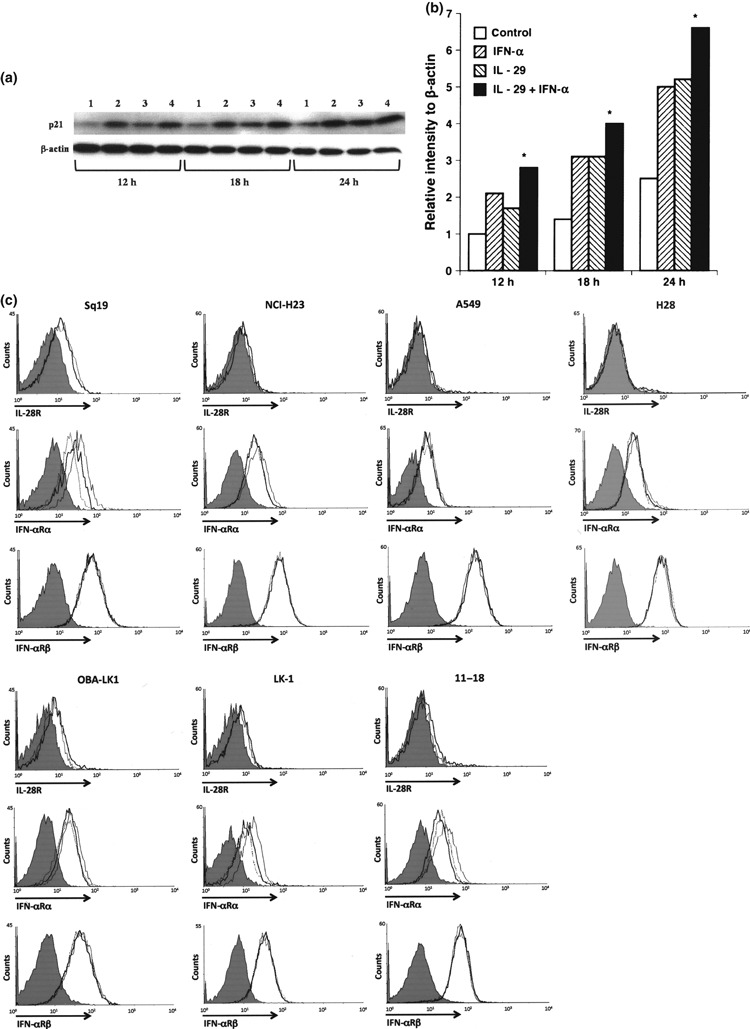
Biological effect of the combination of interleukin (IL)‐29 and interferon (IFN)‐α on p21 expression, and regulation of IL‐28R and IFN‐αRα expression with type III and type I IFN. (a) LK‐1 cells were cultured with or without interferon(s) for the indicated hours. Time course analysis of p21 induction was performed using western blot analysis. 1, control; 2, 10 ng/mL IFN‐α; 3, 50 ng/mL IL‐29; and 4, 50 ng/mL IL‐29 plus 10 ng/mL IFN‐α. (b) The relative p21 intensity normalized to β‐actin is presented in the bar graph (*P < 0.05: IFN‐α or IL‐29 vs IL‐29 plus INF‐α). (c) To examine the surface expression of IL‐28R, cells were treated with 50 ng/mL IFN‐α (bold line) for 24 h, harvested and washed twice with PBS containing 0.1% NaN3. Cells were also cultured without stimulation (thin line). To examine the surface expression of IFN‐αRα or IFN‐αRβ, cells were treated with 50 ng/mL IL‐28A (dotted line) or 50 ng/mL IL‐29 (bold line) for 24 h, harvested and washed twice with PBS containing 0.1% NaN3. Cells were also cultured without stimulation (thin line). Cells (1 × 10⁶) were incubated with anti‐human IL‐28R mAb, anti‐human IFN‐αRα mAb, anti‐human IFN‐αRβ mAb or with isotype control (grey shade). After washing three times with PBS, the cells were incubated with PE‐conjugated goat anti‐mouse IgG F(ab)2.
Interferon combination upregulates p21 expression more efficiently and suppresses in vivo tumor growth more effectively. Next we evaluated the effect of interferon combination on p21 expression, and found that treatment with the combination of IL‐29 and TNF‐α enhanced p21 expression more efficiently than each reagent alone (Fig. 9a,b). This characteristic biological function of type III IFN prompted us to further investigate the in vivo biological effect of this interferon combination. OBA‐LK1 tumors transplanted into SCID mice were treated with IL‐29, IFN‐α or a combination of both. All treatments resulted in significant retarded tumor growth kinetics, whereas the greatest antitumor activity was obtained with the interferon combination therapy (Fig. 10).
Figure 10.
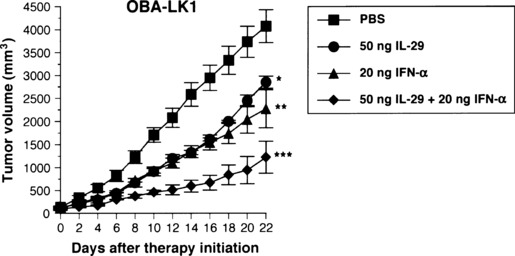
Antitumor activity of the combination of interleukin (IL)‐29 and interferon (IFN)‐αin vivo. Simultaneous administration of 50 ng IL‐29 and 20 ng IFN‐α into established OBA‐LK1 tumors inhibited growth more effectively than each reagent alone (*P < 0.05; **P < 0.03 vs PBS, on day 16 after therapy initiation, ***P < 0.005; IL‐29 or IFN‐αvs IL‐29 plus IFN‐α). The result is representative of two independent experiments.
Discussion
Interferons have direct antitumor activities including induction of cell death via apoptosis and an antiproliferative effect on tumor cells. To date, type I IFN has been used for the treatment of patients with myelogenous leukemias, multiple myeloma, lymphomas, renal cell carcinoma and metastatic melanoma. Newly identified antiviral cytokines IL‐28 and IL‐29 are considered to belong to the IFN family and designed as type III IFN. In addition to its primarily reported antiviral activity, type III IFN has also been shown to have direct antitumor actions against several human tumor lines including glioblastoma,( 7 ) colon cancer,( 8 ) neuroendocrine cancer,( 9 ) esophageal carcinoma( 10 ) and melanoma.( 11 ) Nevertheless, the efficacy and precise molecular mechanisms of the antitumor activities of type III IFN and the interferon combination against NSCLC have not been fully elucidated. We therefore investigated the antitumor actions of type III IFN using NSCLC lines. Our findings demonstrated that type III IFN elicits a direct growth inhibitory effect on a broad range of NSCLC lines via G1 phase arrest and apoptosis. Our findings give rise to the possibility that type III IFN could improve the therapeutic efficacy of IFN‐α although we now do not have evidences that type III IFN in combination with IFN‐α can mediate an additive or synergistic antitumor effect on other pathological types of human tumors.
The antiproliferative activity of IL‐28A appears to be weaker than IL‐29. The precise mechanisms responsible for the difference of the ability of antiproliferative activities between IL‐28 and IL‐29 still remain to be clarified. A possible explanation for the underlying mechanisms is that the binding affinities of IL‐28 and IL‐29 to IL‐28R might be different. IL‐29 could have higher affinity to IL‐28R, whereas IL‐28 might have relatively lower affinity. Therefore, the observed differences in growth suppressive abilities between IL‐28 and IL‐29 could be, at least in part, attributable to the distinct binding affinities for the respective receptor IL‐28R.
Our findings are in line with the results obtained from studies using esophageal carcinoma and melanoma lines, in which type III IFN mediated G1 phase arrest and apoptotic cell death.( 10 , 11 ) Treatment with a sufficient concentration of IL‐29 resulted in an increased cell population at the G1 phase. These results indicate that IL‐29 mediated growth inhibitory activity, at least in part, through cell cycle arrest at the G1 phase. To investigate the underlying mechanisms, we focused on cyclin‐dependent kinase inhibitors such as p16, p21 and p27, all of which have the possibility to be responsible for cell cycle G1 arrest, and found that IL‐29 significantly upregulated p21 expression in cells sensitive, but not insensitive, to the antiproliferative activity of IL‐29. Moreover, the antiproliferative effect of IL‐29 was largely alleviated by knockdown of p21 expression using siRNA specific for p21, indicating that p21 upregulation is crucial to the antiproliferative effect of IL‐29 on NSCLC. These results might be in line with the previously reported findings that increased p21 expression is responsible for cell cycle G1 arrest in many kinds of cells,( 29 , 30 , 31 ) and p21 overexpression in cells resulted in growth inhibition and G1 arrest.( 32 , 33 , 34 , 35 ) Thus, the major mechanism responsible for the resistance to type III IFN‐induced cell cycle G1 arrest might be the loss of ability of cells to upregulate p21 expression in response to type III IFN.
The p21 knockdown could not completely abrogate IL‐29‐mediated cell growth inhibition. This might be due to the presence of other molecules concerned with cell cycle arrest at the G1 phase. One candidate for these factors was OAS1, which was actually induced by IL‐29. OAS1 has been reported to synthesize oligoadenylates that activate a latent RNase (RNase L), which degrades RNA, resulting in cell growth inhibition. Overexpression of this enzyme has been reported to reduce cell growth,( 27 ) and the expression of a dominant‐negative mutant of RNase L in murine SVT2 cells inhibited the antiproliferative effect of IFN on these cells.( 25 ) These findings support the possibility that OAS1 plays a partial role in the antiproliferative effect of IL‐29. However, we could not conclude that OAS1 contributes to the antiproliferative activity of IL‐29 because OAS1 is also induced in A549, which is insensitive to the growth inhibitory action of IL‐29. Another candidate responsible for the antiproliferative effect is p27, since IFN‐α regulates p27 expression by a post‐transcriptional mechanism.( 36 ) However, we could detect significant p27 upregulation in neither NSCLC lines treated with IL‐29 nor xenogeneic NSCLC tumors treated with IL‐29 (data not shown). Additionally, p16 is upregulated by other cytokines such as hepatocyte growth factor and is responsible for cell cycle arrest at the G1 phase in human tumor lines.( 37 ) In the NSCLC lines tested, p16 expression was not detected by western blot assay or RT‐PCR with the exception of LK‐1. Inactivation of the p16Ink4a has been reported in a wide variety of human tumors. In particular, approximately 30–50% of human NSCLC tumors express p16 at nil to low levels by immunostaining, and this correlates with a significantly worse survival.( 38 , 39 , 40 ) Therefore, most NSCLC lines used in the present study might have a homozygous deletion of the p16 genes or aberrant methylation of the p16 promoters. We cannot exclude the possibility that p16 upregulation participates in the antiproliferative effect of IL‐29 in cells that have a normal p16 gene. Our findings suggest that p21 could be a key molecule for the direct antitumor effect of IL‐29 against NSCLC lines, but further analyses are required for more details. It is of interest that IFN‐α induces G1 phase arrest in a number of human tumor lines, and that upregulation of cyclin‐dependent kinase inhibitors accounts for IFN‐α‐induced cell cycle inhibition.( 41 , 42 , 43 ) This might suggest that type III IFN induces cell cycle inhibition with a common molecular mechanism as type I IFN at least in part. In addition, IL‐29 could induce apoptotic cell death in NSCLC lines for 48 h of treatment. Thus, the fact that p21 knockdown could not completely abrogate IL‐29‐mediated cell growth inhibition might be largely due to the induction of apoptotic cell death.
In intratumoral or systemic therapy models, in the case of OBA‐LK1 and LK‐1 tumors, IL‐29 displayed antitumor activities in vivo in a dose‐dependent manner. In contrast, in the case of the A549 tumor, IL‐29 could not significantly suppress in vivo growth. Thus, in vivo efficacy of IL‐29 treatment to inhibit tumor growth is closely associated with the in vitro sensitivity of tumor cells to the growth inhibitory activity of IL‐29. This observed reduction in in vivo tumor growth mediated by IL‐29 could be associated with enhanced p21 expression in xenogeneic tumors. Moreover, in clear contrast to type I IFN,( 44 ) IL‐29 appears to have no capability of inhibiting tumor angiogenesis. SCID mice treated with anti‐asialo GM1 antiserum lack functional T cells, B cells and NK cells. Taken collectively, the growth inhibition in xenogeneic NSCLC tumor models is most likely due to direct antitumor action of IL‐29. These findings totally support the notion that p21 upregulation plays a major role in the in vivo antitumor action of IL‐29. Actually, p21 expression in NSCLC tumors has been reported to be a predictor for a favorable prognosis.( 45 , 46 , 47 ) It is of particular importance that the systemically applied IL‐29 has a therapeutic application to human tumors because this type of treatment can be beneficial for patients with tumors that are difficult to access or with distant metastases. Additionally, IFN‐α causes significant adverse reactions, whereas IL‐29‐associated local and systemic toxicity in vivo appears minimal.
The interferon combination displayed more effective growth inhibitory action than individual interferon alone in vitro. The combination of IL‐29 and IFN‐α upregulated p21 expression more effectively than each reagent alone. Therefore, we further evaluated the efficacy of interferon combination therapy in vivo. The combination of IL‐29 and IFN‐α was more effective in inhibiting in vivo tumor growth than the individual reagent alone. Although the direct antitumor activity of type III IFN against various pathological types of tumors has not been fully evaluated, our findings raise the possibility that the interferon combination therapy might not only surpass the therapeutic outcomes of IFN‐α monotherapy but also reduce the side‐effects by decreasing the daily dose of IFN‐α.
To address the mechanisms of antitumor activity of the interferon combination, we first examined the effect of type I IFN IFN‐α on the expression levels of IL‐28R, and found that IFN‐α treatment upregulated the surface membrane IL‐28R expression on NSCLC lines. In contrast, it is of particular interest that type III IFN downregulated the surface membrane IFN‐αRα expression. Thus, the mechanisms by which the interferon combination more efficiently suppressed in vitro and in vivo NSCLC growth than each reagent alone, still remain to be elucidated. A possible explanation is that simultaneous stimulation with type III IFN and type I IFN could upregulate surface IL‐28R and IFN‐αRα expression on NSCLC cells and enhance the biological activities of type III IFN and type I IFN.
Type III IFN have been reported to possess immunoregulatory activity. Type III IFN stimulates NK cells, polymorphonuclear neutrophils and CD8 T cells, and further enhances antitumor immune responses.( 16 ) Recently, it has been reported that type III IFN upregulates surface IFN‐γR1 expression on monocyte‐derived macrophages, and enhances the biological effect of IFN‐γ on macrophages.( 48 ) Thus, in immunologically normal conditions, type III IFN can elicit antitumor activities via both direct action against tumor cells themselves and indirect action to augment the antitumor immune responses.
In conclusion, type III IFN can elicit direct antitumor activity against NSCLC in vitro and in vivo mainly through p21Waf1/Cip1 upregulation and induction of apoptosis. Type III IFN can cooperate with type I IFN to elicit direct antitumor activity more efficiently. Considering that type III IFN has immunoregulatory activities, the application of type III IFN monotherapy or interferon combination therapy to immunocompetent cancer patients might possibly produce greater therapeutic effects.
Disclosure Statement
The authors have no financial or any other kind of personal conflicts with this article.
Acknowledgments
The authors thank Miss Toshie Suzuki for her excellent technical assistance.
References
- 1. Vilcek J. Novel interferons. Nat Immunol 2003; 4: 8–9. [DOI] [PubMed] [Google Scholar]
- 2. Sheppard P, Kindsvogel W, Xu W et al. IL‐28, IL‐29 and their class II cytokine receptor IL‐28R. Nat Immunol 2003; 4: 63–8. [DOI] [PubMed] [Google Scholar]
- 3. Kotenko SV, Gallagher G, Baurin VV et al. IFN‐lambdas mediate antiviral protection through a distinct class II cytokine receptor complex. Nat Immunol 2003; 4: 69–77. [DOI] [PubMed] [Google Scholar]
- 4. Leaman DW. Mechanism of interferon action. Prog Mol Subcell Biol 1998; 20: 101–42. [DOI] [PubMed] [Google Scholar]
- 5. Pfeffer LM, Dinarello CA, Herberman RB et al. Biological properties of recombinant alpha‐interferons: 40th anniversary of the discovery of interferons. Cancer Res 1998; 58: 2489–99. [PubMed] [Google Scholar]
- 6. Weiss K. Safety profile of interferon‐α therapy. Semin Oncol 1998; 25: 9–13. [PubMed] [Google Scholar]
- 7. Meager A, Visvalingam K, Dilger P, Bryan D, Wadhwa M. Biological activity of interleukins‐28 and ‐29: comparison with type I interferons. Cytokine 2005; 31: 109–18. [DOI] [PubMed] [Google Scholar]
- 8. Brand S, Beigel F, Olszak T et al. IL‐28A and IL‐29 mediate antiproliferative and antiviral signals in intestinal epithelial cells and murine CMV infection increases colonic IL‐28A expression. Am J Physiol Gastrointest Liver Physiol 2005; 289: G960–8. [DOI] [PubMed] [Google Scholar]
- 9. Zitzmann K, Brand S, Baehs S et al. Novel interferon‐lambdas induce antiproliferative effects in neuroendocrine tumor cells. Biochem Biophys Res Commun 2006; 344: 1334–41. [DOI] [PubMed] [Google Scholar]
- 10. Li Q, Kawamura K, Ma G et al. Interferon‐lambda induces G1 phase arrest or apoptosis in oesophageal carcinoma cells and produces anti‐tumour effects in combination with anti‐cancer agents. Eur J Cancer 2010; 46: 180–90. [DOI] [PubMed] [Google Scholar]
- 11. Guenterberg KD, Grignol VP, Raig ET et al. Interleukin‐29 binds to melanoma cells inducing Jak‐STAT signal transduction and apoptosis. Mol Cancer Ther 2010; 9: 510–20. [DOI] [PMC free article] [PubMed] [Google Scholar]
- 12. Maher SG, Sheikh F, Scarzello AJ et al. IFNalpha and IFNlambda differ in their antiproliferative effects and duration of JAK/STAT signaling activity. Cancer Biol Ther 2008; 7: 1109–15. [DOI] [PMC free article] [PubMed] [Google Scholar]
- 13. Steen HC, Gamero AM. Interferon‐lambda as a potential therapeutic agent in cancer treatment. J Interferon Cytokine Res 2010; 30: 597–602. [DOI] [PMC free article] [PubMed] [Google Scholar]
- 14. Lasfar A, Lewis‐Antes A, Smirnov SV et al. Characterization of the mouse IFN‐lambda ligand‐receptor system: IFN‐lambdas exhibit antitumor activity against B16 melanoma. Cancer Res 2006; 66: 4468–77. [DOI] [PubMed] [Google Scholar]
- 15. Sato A, Ohtsuki M, Hata M, Kobayashi E, Murakami T. Antitumor activity of IFN‐lambda in murine tumor models. J Immunol 2006; 176: 7686–94. [DOI] [PubMed] [Google Scholar]
- 16. Numasaki M, Tagawa M, Iwata F et al. IL‐28 elicits antitumor responses against murine fibrosarcoma. J Immunol 2007; 178: 5086–98. [DOI] [PubMed] [Google Scholar]
- 17. Abushahba W, Balan M, Castaneda I et al. Antitumor activity of type I and type III interferons in BNL hepatoma model. Cancer Immunol Immunother 2010; 59: 1059–71. [DOI] [PMC free article] [PubMed] [Google Scholar]
- 18. Numasaki M, Watanabe M, Suzuki T et al. IL‐17 enhances the net angiogenic activity and in vivo growth of human non‐small cell lung cancer in SCID mice through promoting CXCR‐2‐dependent angiogenesis. J Immunol 2005; 175: 6177–89. [DOI] [PubMed] [Google Scholar]
- 19. Fujiwara H, Yamakuni T, Ueno M et al. IC101 induces apoptosis by Akt dephosphorylation via an inhibition of heat shock protein 90‐ATP binding activity accompanied by preventing the interaction with Akt in L1210 cells. J Pharmacol Exp Ther 2004; 310: 1288–95. [DOI] [PubMed] [Google Scholar]
- 20. Horton HM, Hernandez P, Parker SE, Barnhart KM. Antitumor effects of interferon‐omega: in vivo therapy of human tumor xenografts in nude mice. Cancer Res 1999; 59: 4064–8. [PubMed] [Google Scholar]
- 21. Seki K, Yoshikawa H, Shiiki K, Hamada Y, Akamatsu N, Takeda K. Cisplatin (CDDP) specifically induces apoptosis via sequential activation of caspase‐8, ‐3 and ‐6 in osteosarcoma. Cancer Chemother Pharmacol 2000; 45: 199–206. [DOI] [PubMed] [Google Scholar]
- 22. Nakayama K, Pergolizzi RG, Crystal RG. Gene transfer‐mediated pre‐mRNA segmental trans‐splicing as a strategy to deliver intracellular toxins for cancer therapy. Cancer Res 2004; 65: 254–63. [PubMed] [Google Scholar]
- 23. Morita E, Tada K, Chisaka H et al. Human parvovirus B19 induces cell cycle arrest at G2 phase with accumulation of mitotic cyclins. J Virol 2001; 75: 7555–63. [DOI] [PMC free article] [PubMed] [Google Scholar]
- 24. Numasaki M, Fukushi J, Ono M et al. Interleukin‐17 promotes angiogenesis and tumor growth. Blood 2003; 101: 2620–7. [DOI] [PubMed] [Google Scholar]
- 25. Rysiecki G, Gewert DR, Williams BR. Constitutive expression of a 2′,5′‐oligoadenylate synthetase cDNA results in increased antiviral activity and growth suppression. J Interferon Res 1989; 9: 649–57. [DOI] [PubMed] [Google Scholar]
- 26. Koromilas AE, Roy S, Barber GN, Katze MG, Sonenberg N. Malignant transformation by a mutation of the IFN‐inducible dsRNA‐dependent protein kinase. Science 1992; 257: 1685–9. [DOI] [PubMed] [Google Scholar]
- 27. Hassel BA, Zhou A, Sotomayor C, Maran A, Silverman RH. A dominant negative mutant of 2‐5A‐dependent RNase suppresses antiproliferative and antiviral effects of interferon. EMBO J 1993; 12: 3297–304. [DOI] [PMC free article] [PubMed] [Google Scholar]
- 28. Clemens MJ. PKR‐α protein kinase regulated by double‐stranded RNA. Int J Biochem Cell Biol 1997; 29: 945–9. [DOI] [PubMed] [Google Scholar]
- 29. Basile JR, Eichten A, Zacny V, Munger K. NF‐kappa B‐mediated induction of p21(Cip1/Waf1) by tumor necrosis factor alpha induces growth arrest and cytoprotection in normal human keratinocytes. Mol Cancer Res 2003; 1: 262–70. [PubMed] [Google Scholar]
- 30. Fang F, Orend G, Watanabe N, Hunter T, Ruoslahti E. Dependence of cyclin E‐CDK2 kinase activity on cell anchorage. Science 1996; 271: 499–502. [DOI] [PubMed] [Google Scholar]
- 31. Bates S, Ryan KM, Phillips AC, Vousden KH. Cell cycle arrest and DNA endoreduplication following p21Waf1/Cip1 expression. Oncogene 1998; 17: 1691–703. [DOI] [PubMed] [Google Scholar]
- 32. Tsukada Y, Tanaka T, Miyazawa K, Kitamura N. Involvement of down‐regulation of Cdk2 activity in hepatocyte growth factor‐induced cell cycle arrest at G1 in the human hepatocellular carcinoma cell line HepG2. J Biochem 2004; 136: 701–9. [DOI] [PubMed] [Google Scholar]
- 33. Hall MC, Li Y, Pong RC, Ely B, Sagalowsky AI, Hsieh JT. The growth inhibitory effect of p21 adenovirus on human bladder cancer cells. J Urol 2000; 163: 1033–8. [PubMed] [Google Scholar]
- 34. Harada K, Kurisu K, Sadatomo T et al. Growth inhibition of human glioma cells by transfection‐induced p21 and its effects on telomerase activity. J Neurooncol 2000; 47: 39–46. [DOI] [PubMed] [Google Scholar]
- 35. Chen X, Zhang W, Gao YF, Su XQ, Zhai ZH. Senescence‐like changes induced by expression of p21Waf1/Cip1 in NIH3T3 cell line. Cell Res 2002; 12: 229–33. [DOI] [PubMed] [Google Scholar]
- 36. Sangfelt O, Erickson S, Castro J et al. Molecular mechanisms underlying interferon‐alpha‐induced G0/G1 arrest: CKI‐mediated regulation of G1 Cdk‐complexes and activation of pocket proteins. Oncogene 1999; 18: 2798–810. [DOI] [PubMed] [Google Scholar]
- 37. Han J, Tsukada Y, Hara E, Kitamura N, Tanaka T. Hepatocyte growth factor induces redistribution of p21CIP1 and p27KIP1 through ERK‐dependent p16INK4a up‐regulation, leading to cell cycle arrest at G1 in HepG2 hepatoma cells. J Biol Chem 2005; 280: 31548–56. [DOI] [PubMed] [Google Scholar]
- 38. Vonlanthen S, Heighway J, Tschan MP et al. Expression of p16INK4a/p16alpha and p19ARF/p16beta is frequently altered in non‐small cell lung cancer and correlates with p53 overexpression. Oncogene 1998; 17: 2779–85. [DOI] [PubMed] [Google Scholar]
- 39. Kratzke RA, Greatens TM, Rubins JB et al. Rb and p16INK4a expression in resected non‐small cell lung tumors. Cancer Res 1996; 56: 3415–20. [PubMed] [Google Scholar]
- 40. Taga S, Osaki T, Ohgami A et al. Prognostic value of the immunohistochemical detection of p16INK4 expression in nonsmall cell lung carcinoma. Cancer 1997; 80: 389–95. [DOI] [PubMed] [Google Scholar]
- 41. Sangfelt O, Erickson S, Einhorn S, Grander D. Induction of Cip/Kip and Ink4 cyclin dependent kinase inhibitors by interferon‐α in hematopoietic cell lines. Oncogene 1997; 14: 415–33. [DOI] [PubMed] [Google Scholar]
- 42. Tada S, Saito H, Tsunematsu S et al. Interferon regulatory factor‐1 gene abnormality and loss of growth inhibitory effect of interferon‐alpha in human hepatoma cell lines. Int J Oncol 1998; 13: 1207–16. [DOI] [PubMed] [Google Scholar]
- 43. Moro A, Calixto A, Suarez E, Arana MJ, Perea SE. Differential expression of the p27Kip1 mRNA in IFN‐sensitive and resistant cell lines. Biochem Biophys Res Commun 1998; 245: 752–6. [DOI] [PubMed] [Google Scholar]
- 44. Sidky YA, Borden EC. Inhibition of angiogenesis by interferons: effects on tumor‐ and lymphocyte‐induced vascular responses. Cancer Res 1987; 47: 5155–61. [PubMed] [Google Scholar]
- 45. Komiya T, Hosono Y, Hirashima T et al. p21 expression as a predictor for favorable prognosis in squamous cell carcinoma of the lung. Clin Cancer Res 1997; 3: 1831–5. [PubMed] [Google Scholar]
- 46. Shoji T, Tanaka F, Takata T et al. Clinical significance of p21 expression in non‐small cell lung cancer. J Clin Oncol 2002; 20: 3865–71. [DOI] [PubMed] [Google Scholar]
- 47. Singhal S, Vachani A, Antin‐Ozerkis D, Kaiser LR, Albelda SM. Prognostic implications of cell cycle, apoptosis, and angiogenesis biomarkers in non‐small cell lung cancer: a review. Clin Cancer Res 2005; 11: 3974–86. [DOI] [PubMed] [Google Scholar]
- 48. Liu BS, Janssen HL, Boonstra A. IL‐29 and IFNα differ in their ability to modulate IL‐12 production by TLR‐activated human macrophages and exhibit differential regulation of the IFNγ receptor expression. Blood 2011; 117: 2385–95. [DOI] [PubMed] [Google Scholar]


