

Abstract
Although DNA‐damaging agents are among the most effective anticancer drugs in clinical use, their overall effectiveness is limited by the development of cross‐resistance to these drugs. Given that histone deacetylase (HDAC) inhibitors increase the acetylation of core histones, resulting in an open chromatin configuration that is more accessible to DNA‐targeting agents, we examined whether HDAC inhibitors might enhance the cytotoxicity of DNA‐damaging drugs in six human ovarian tumor cell lines that exhibit different cisplatin sensitivities. Low concentrations of HDAC inhibitors, which alone exhibited little cytotoxicity, markedly enhanced the induction of apoptotic cell death not only by cisplatin but also by a wide variety of DNA‐targeting anticancer drugs in these tumor cell lines, irrespective of their sensitivities to the respective drugs. In contrast, HDAC inhibitors did not increase the cytotoxicity of metabolic antagonists or microtubule‐targeting agents. HDAC inhibitors potentiated both the phosphorylation of histone H2AX on serine‐139 (a marker of DNA double‐strand breaks) as well as the accumulation of reactive oxygen species induced by DNA‐damaging agents in tumor cells. The enhanced generation of reactive oxygen species appeared to be responsible for the enhanced apoptotic cell death induced by the combination of these drugs. These results indicate that the combination of an HDAC inhibitor with a wide variety of DNA‐damaging agents is a promising chemotherapeutic strategy for the eradication of tumor cells, regardless of whether the cells are sensitive or resistant to the DNA‐damaging anticancer drugs. (Cancer Sci 2008; 99: 376–384)
Cancer is a disease of genetic defects such as gene mutations and deletions as well as chromosomal abnormalities, which together result in the gain of function or hyperactivation of oncogenes, or the loss of function of tumor suppressor genes. Recent evidence indicates, however, that changes in gene expression attributable to epigenetic alterations also contribute to the onset and progression of cancer.( 1 , 2 ) Remodeling of chromatin between relatively open and closed states plays a key role in the epigenetic regulation of gene expression. Such remodeling is induced by modification of the structure of nucleosomes, which consist of approximately two turns of the DNA helix wound around a histone octamer. Regulation of nucleosome structure is mediated in part by modification of the amino‐terminal tail of histones.( 3 ) Acetylation of histones (in particular, histones H3 and H4), which is determined by the opposing activities of histone acetyltransferases (HAT) and histone deacetylases (HDAC), is central to the regulation of gene expression through chromatin modification.( 4 ) HAT transfer acetyl groups to lysine residues in the amino‐terminal tail of histones, resulting in local expansion of chromatin and increased accessibility of the DNA to regulatory proteins, whereas HDAC catalyze the removal of acetyl groups, leading to chromatin condensation and transcriptional repression.( 5 )
Dysregulation of chromatin modification can result in abnormalities in gene expression and, ultimately, in malignant diseases including cancer.( 6 , 7 , 8 ) Reduced levels of histone acetylation as a result of aberrant HDAC activity have thus been detected in several human tumors and appear to trigger repression of tumor suppressor genes and to contribute to tumor onset and progression.( 9 ) Specific inhibition of HDAC activity has therefore emerged as a potential strategy to reverse epigenetic changes associated with cancer. Several small‐molecule HDAC inhibitors have recently been shown to exhibit potent and specific anticancer activity in preclinical studies.( 10 , 11 , 12 , 13 , 14 )
Multiple mechanisms have been proposed for the anticancer activity of HDAC inhibitors, which include the enhanced acetylation of core histones and consequent increased accessibility of genomic DNA to transcriptional complexes, resulting in the induction of tumor suppressor genes.( 10 , 15 ) The hyper‐acetylation of histones induced by the HDAC inhibitor trichostatin A (TSA) has been shown to increase chromatin accessibility by measurement of the size‐dependent nuclear distribution of microinjected fluorescein isothiocyanate–dextran conjugates with the use of image‐correlation spectroscopy.( 16 ) Such an HDAC inhibitor‐induced relaxation of chromatin structure would be expected to increase chromatin accessibility not only to transcription factors but also to therapeutic agents that target genomic DNA. Consistent with this notion, HDAC inhibitors have been shown to sensitize tumor cells to the induction of cell death by ionizing radiation,( 17 , 18 ) ultraviolet (UV) radiation,( 19 ) and several DNA‐damaging drugs.( 20 , 21 ) The molecular mechanisms of such effects have remained largely unknown.
Anticancer drugs that induce DNA damage are among the most effective of such drugs and substantially increase the survival of cancer patients.( 22 ) However, some cancer patients do not respond or develop resistance to such DNA‐damaging drugs. To identify an effective strategy to improve the efficacy of DNA‐damaging drugs even in resistant tumors, we have now examined the potential utility of HDAC inhibitors as chemosensitizers for these agents. We found that HDAC inhibitors indeed increased the chemosensitivity of tumor cells with cross‐resistance to a wide range of DNA‐damaging drugs, including DNA cross‐linkers, topoisomerase inhibitors, and radiomimetics. Co‐administration of HDAC inhibitors potentiated the induction of genomic DNA damage by DNA‐damaging drugs, resulting in increased generation of reactive oxygen species (ROS) and the consequent induction of apoptotic cell death in tumor cells.
Materials and Methods
Drugs and antibodies. TSA, doxorubicin, 5‐fluorouracil, cytosine β‐D‐arabinofuranoside (Ara‐C), vincristine, paclitaxel, and N‐acetyl‐L‐cysteine (NAC) were obtained from Sigma‐Aldrich (St Louis, MO, USA). Etoposide, cisplatin, and bleomycin were from Wako (Osaka, Japan). Mitomycin‐C was from ICN Biochemicals (Irvine, CA, USA), topotecan was from LKT Laboratories (St Paul, MN, USA), MS‐275 was from Calbiochem (La Jolla, CA, USA), and FK228 was kindly provided by Fujisawa Pharmaceutical Co. (Osaka, Japan). Antibodies to XIAP (X2503) or to β‐actin (A4700) were obtained from Sigma‐Aldrich; those to caspase‐3 cleaved at Asp175 (#9661), to caspase‐9 (#9502), to Akt (#9272), or to the Ser473‐phosphorylated form of Akt (#9271) were from Cell Signaling (Beverly, MA, USA); those to caspase‐8 (559932) were from BD Biosciences (San Jose, CA, USA); those to acetylated histone H3 (#06–599) or to phosphorylated histone H2AX (#07–164) were from Upstate Cell Signaling Solutions (Charlottesville, VA, USA); and those to Bcl‐xL (MAB3121) were from Chemicon (Temecula, CA, USA). All other chemicals and reagents were of the purest grade available.
Cell culture and assay of cell viability. The human ovarian cancer cell lines OVCAR‐3, OVCAR‐4, OVCAR‐5, OVCAR‐8, SKOV‐3, and TYK‐nu, as well as the colon cancer cell line HT‐29, were cultured in Dulbecco's modified Eagle's medium (DMEM) supplemented with 10% fetal bovine serum (FBS).( 23 ) The effect of cisplatin on tumor cell viability was assayed with the use of a Cell Counting Kit‐8 (Dojindo Molecular Technologies, Kumamoto, Japan). In brief, cells (3 × 10³/well) were plated in 100 µL of medium in 96‐well plates and cultured for 24 h before the addition of various concentrations of cisplatin. They were then incubated for an additional 48 h, after which water‐soluble tetrazolium salt (WST‐8) was added to each well and absorbance at 490 nm was measured with a microplate reader. Cell viability was expressed as a percentage of the absorbance for control cells treated with vehicle.
Immunofluorescence microscopy. Cells grown on glass cover slips were exposed to various reagents, fixed with methanol at –20°C, and transferred to blocking solution (phosphate‐buffered saline [PBS] containing 2% bovine serum albumin [BSA]). They were then stained with primary antibodies and AlexaFluor 546‐ or AlexaFluor 488‐conjugated secondary antibodies (Molecular Probes, Eugene, OR, USA).( 24 ) Nuclei were counterstained with 4′,6‐diamidino‐2‐phenylindole (DAPI). The cells were examined with an Axioskop2 Plus microscope equipped with epifluorescence optics and Axiovision software (Carl Zeiss, Jena, Germany). The appearance of phosphatidylserine on the extracellular side of the plasma membrane was detected by staining with annexin V and propidium iodide (PI) with the use of an Annexin‐V‐Fluos staining kit (Roche Diagnostics, Penzberg, Germany).
Flow cytometry. Cells exposed to various agents were harvested by exposure to trypsin, fixed with ice‐cold 70% ethanol, treated with DNase‐free RNase A (100 µg/mL) (Sigma‐Aldrich), and stained with PI (20 µg/mL). At least 1 × 10⁴ cells were analyzed for DNA content with the use of a FACSCalibur flow cytometer and CellQuest Pro software (Becton Dickinson, San Jose, CA, USA).( 25 , 26 ) For detection of ROS accumulation, cells treated with various agents were incubated for 30 min at 37°C with 10 µM 5‐(and‐6)‐chloromethyl‐2′,7′‐dichlorodihydrofluorescein diacetate (CM‐H2DCFDA; Molecular Probes), harvested by exposure to trypsin, and then monitored for fluorescence with a FACSCalibur flow cytometer as described.( 14 )
Immunoblot analysis. Cell lysates were fractionated using sodium dodecyl sulfate–polyacrylamide gel electrophoresis (SDS–PAGE) and subjected to immunoblot analysis as described.( 27 , 28 ) Immune complexes were visualized with an enhanced chemiluminescence system (GE Healthcare Bio‐Sciences, Piscataway, NJ, USA).
Statistical analysis. Data are presented as means ± SD and were analyzed where indicated using the two‐tailed Student's t‐test. A P‐value of <0.05 was considered statistically significant.
Results
HDAC inhibitors potentiate induction of apoptosis by cisplatin. We first examined the cytotoxic effect of cisplatin, one of the most active and widely used DNA‐damaging anticancer drugs, in six human ovarian tumor cell lines. Exposure of the tumor cells for 48 h to various concentrations of cisplatin resulted in a concentration‐dependent reduction in cell viability that differed between the cell lines (Fig. 1a). OVCAR‐8 cells, which were established from an individual who had been treated with intensive chemotherapy,( 29 ) exhibited marked resistance to cisplatin, with a median inhibitory concentration (IC50) of 30.0 µM. In contrast, the other tumor cell lines appeared relatively sensitive to cisplatin, with IC50 values of 3.0 µM for OVCAR‐4, 3.2 µM for OVCAR‐5, 3.5 µM for OVCAR‐3, 4.0 µM for TYK‐nu, and 5.0 µM for SKOV‐3 cells. Consistent with these observations, although cisplatin induced a concentration‐dependent increase in the proportion of OVCAR‐3 or SKOV‐3 cells with a fractional DNA content (those in sub‐G1 phase), a characteristic of apoptotic cell death,( 30 ) it did not induce such an effect in OVCAR‐8 cells (Fig. 1b,c).
Figure 1.
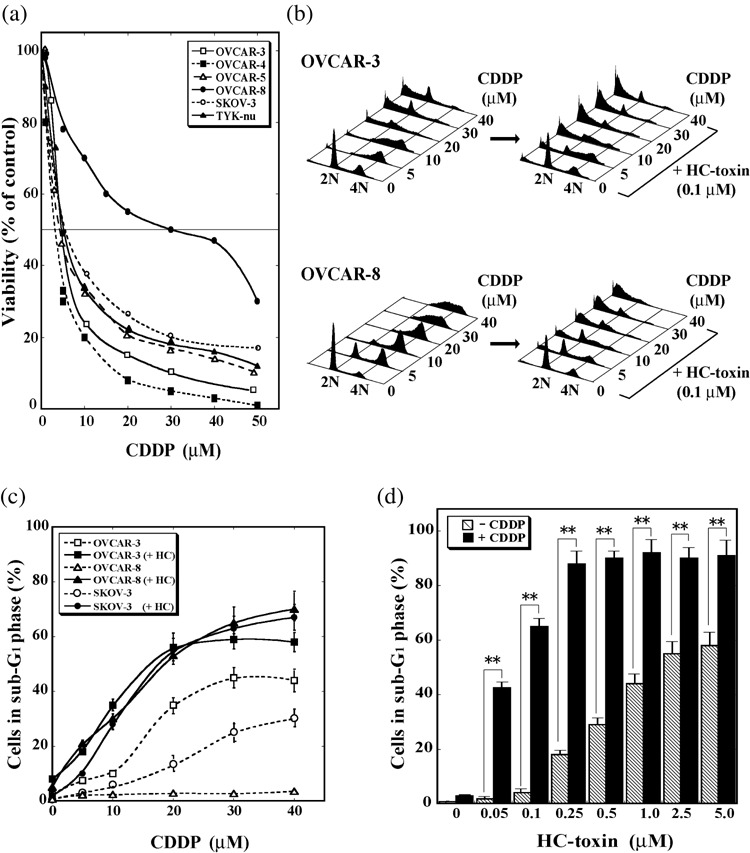
HC‐toxin enhances the death‐inducing effect of cisplatin in human ovarian tumor cells. (a) OVCAR‐3, OVCAR‐4, OVCAR‐5, OVCAR‐8, SKOV‐3, or TYK‐nu cells were incubated for 48 h with the indicated concentrations of cisplatin (CDDP), after which cell viability was determined and expressed as a percentage of that for vehicle‐treated control cells. Data are means from three separate experiments, each performed in duplicate; the SD for each value was between 3 and 15%. (b) OVCAR‐3 or OVCAR‐8 cells were incubated for 48 h with the indicated concentrations of cisplatin in the absence or presence of 0.1 µM HC‐toxin, after which the cells were fixed, stained with propidium iodide, and analyzed for DNA content by flow cytometry. Data are representative of three separate experiments. (c) OVCAR‐3, OVCAR‐8, or SKOV‐3 cells were incubated for 48 h with the indicated concentrations of cisplatin in the absence or presence (+HC) of 0.1 µM HC‐toxin, after which the cells were analyzed as in (b) and the proportion of cells with a fractional DNA content (those in sub‐G1 phase) was determined. Data are means ± SD from three separate experiments, each performed in duplicate. (d) OVCAR‐8 cells were incubated for 48 h with the indicated concentrations of HC‐toxin in the absence (–) or presence (+) of 30 µM cisplatin and were then analyzed for the proportion of cells in sub‐G1 phase. Data are means ± SD from three separate experiments, each performed in duplicate. **P < 0.001.
We next examined whether relaxation of chromatin structure induced by HDAC inhibitors sensitizes these ovarian tumor cell lines to the cytotoxic action of cisplatin. Thus, tumor cells were treated with the combination of a HDAC inhibitor, HC‐toxin (0.1 µM), and varying concentrations of cisplatin. HC‐toxin indeed potentiated the induction of cell death by cisplatin not only in cisplatin‐sensitive OVCAR‐3 and SKOV‐3 cells but also, and most markedly, in cisplatin‐resistant OVCAR‐8 cells (Fig. 1b,c). Furthermore, this enhancing effect of HC‐toxin was apparently synergistic (Supplementary Fig. S1), and was most pronounced at low concentrations of the HDAC inhibitor (Fig. 1d). Whereas the proportion of OVCAR‐8 cells in sub‐G1 phase was <5% after treatment with either 0.1 µM HC‐toxin or 30 µM cisplatin alone, it was approximately 65% for cells treated with the combination of these agents.
Structurally distinct HDAC inhibitors, including FK228, MS‐275 and TSA, also potentiated the induction of cell death by cisplatin in OVCAR‐8 cells (Fig. 2a). Again, this enhancing effect was most pronounced at low concentrations of the HDAC inhibitors that alone exhibited only a limited ability to induce cell death. The ability of HC‐toxin to potentiate the induction of OVCAR‐8 cell death by cisplatin was also revealed by fluorescence microscopic detection of cells manifesting DNA condensation (as revealed by DAPI staining), those expressing the activated form of caspase‐3, or those displaying phosphatidylserine at the cell surface in the absence of membrane permeability (as revealed by staining with annexin V and PI; Fig. 2b), all of which are characteristics of the early phase of apoptotic cell death.( 31 ) In addition, immunoblot analysis revealed that the combination of cisplatin (30 µM) and HC‐toxin (0.1 µM), but neither agent alone, induced the cleavage (activation) of caspase‐8, caspase‐9, and caspase‐3, as well as the down‐regulation of several antiapoptotic proteins including Akt, X‐linked inhibitor of apoptosis protein (XIAP), and Bcl‐xL in OVCAR‐8 cells (see Fig. 4c). Cisplatin (30 µM) alone induced the cleavage of all these caspases and down‐regulated Akt, XIAP and Bcl‐xL in OVCAR‐3 cells (data not shown). All of these results thus indicated that HC‐toxin potentiated the apoptosis‐inducing action of cisplatin.
Figure 2.
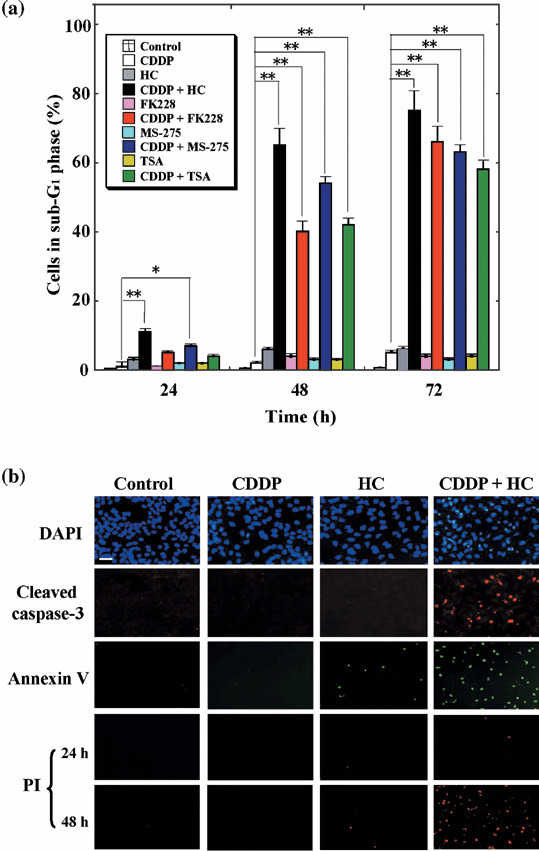
Synergistic induction of apoptosis in OVCAR‐8 cells by histone deacetylase (HDAC) inhibitors and cisplatin. (a) Cells were incubated with 30 µM cisplatin, 0.1 µM HC‐toxin, 2.5 nM FK228, 2.5 µM MS‐275, or 0.5 µM trichostatin A (TSA), as indicated, for 24, 48, or 72 h, after which the proportion of cells in sub‐G1 phase was determined using flow cytometry. Data are means ± SD from three separate experiments, each performed in duplicate. *P < 0.01, **P < 0.001. (b) Cells were incubated for 24 h with 30 µM cisplatin, 0.1 µM HC‐toxin, or both agents and were then fixed and subjected to staining with 4′,6‐diamidine‐2′‐phenylindole (DAPI), with antibodies to the cleaved form of caspase‐3, or with annexin V and propidium iodide (PI). Cells incubated with the drugs for 48 h were also stained with PI to reveal those in the advanced stages of apoptosis or necrosis. Data are representative of three separate experiments. Bar = 100 µm.
Figure 4.
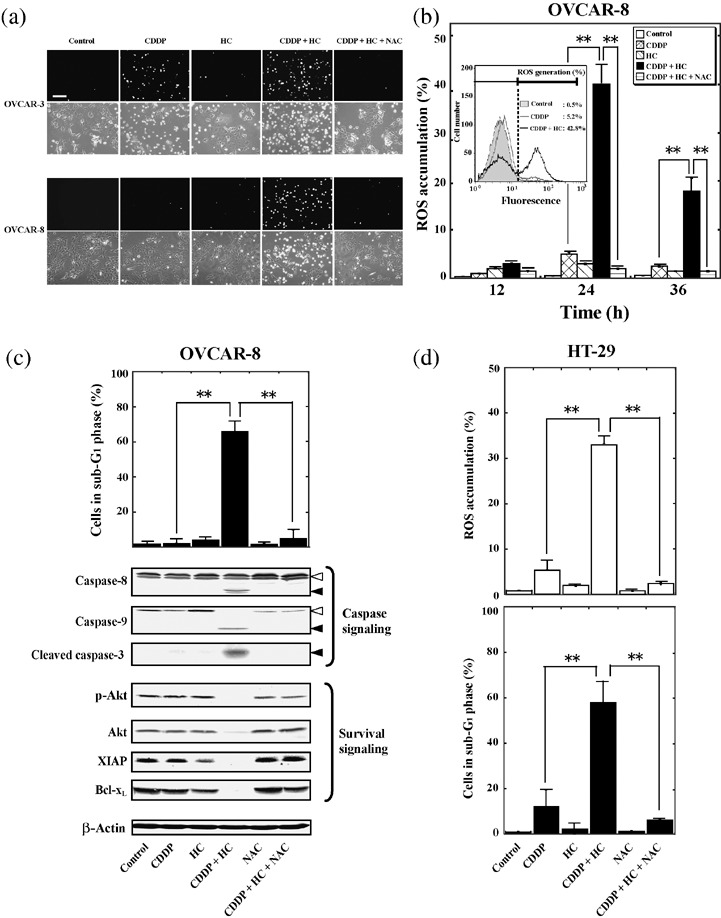
HC‐toxin enhances the cisplatin‐induced accumulation of reactive oxygen species (ROS). (a) OVCAR‐3 or OVCAR‐8 cells were incubated for 24 h with 30 µM cisplatin, 0.1 µM HC‐toxin, or both agents in the absence or presence of 10 mM N‐acetyl‐L‐cysteine (NAC), as indicated. The accumulation of ROS was then examined using fluorescence staining with the ROS‐sensitive dye CM‐H2DCFDA. Both fluorescence (upper rows) and phase‐contrast (lower rows) images are shown. Bar = 200 µm (b) OVCAR‐8 cells were incubated for the indicated times as in (a), after which the cells were labeled with CM‐H2DCFDA and analyzed using flow cytometry to determine the percentage of cells manifesting ROS accumulation. (Inset) Flow cytometric traces for cells incubated for 24 h in the absence or presence of cisplatin with or without HC‐toxin. Cells showing a rightward shift of the histogram were considered to manifest an increase in ROS generation. (c) OVCAR‐8 cells were incubated for 48 h as in (a), after which the proportion of cells in sub‐G1 phase was determined using flow cytometry (upper panel), or cell lysates (30 µg of protein) were subjected to immunoblot analysis with antibodies to the indicated proteins (lower panels). Open arrowheads indicate the uncleaved forms of caspase‐8 or caspase‐9; closed arrowheads indicate cleaved fragments of the respective caspases. (d) HT‐29 cells were incubated for 24 h (upper panel) or 48 h (lower panel) with 50 µM cisplatin, 0.1 µM HC‐toxin, or both agents in the absence or presence of 10 mM of NAC. The proportion of cells manifesting ROS accumulation (upper panel) or a fractional DNA content (lower panel) was then determined using flow cytometry. All qualitative data are representative of three separate experiments. All quantitative data are means ± SD from three separate experiments, each performed in duplicate. **P < 0.001.
HC‐toxin potentiates the induction of genomic DNA damage by cisplatin. To investigate the mechanism by which HDAC inhibitors promote the induction of apoptosis by cisplatin, we examined the possible effect of HC‐toxin on cisplatin‐induced damage to genomic DNA by immunofluorescence and immunoblot analyses of the phosphorylation of histone H2AX on Ser139. Phosphorylation of histone H2AX on this residue represents a rapid and sensitive response of cells exposed to agents (such as ionizing radiation) that elicit DNA damage (such as DNA double‐strand breakage).( 32 ) Cisplatin (30 µM) induced a rapid (within 1 h) and sustained (>12 h) phosphorylation of histone H2AX on Ser139 in cisplatin‐sensitive SKOV‐3 cells, and this effect was significantly enhanced by co‐administration of HC‐toxin (0.1 µM; Fig. 3a and data not shown). In contrast, the same concentration of cisplatin induced only a small and transient increase in histone H2AX phosphorylation in cisplatin‐resistant OVCAR‐8 cells; however, this effect was markedly enhanced by HC‐toxin (Fig. 3a,b). HC‐toxin induced a rapid and sustained hyper‐acetylation of histone H3 in OVCAR‐8 cells, and this effect was not modified by co‐administration of cisplatin (Fig. 3b). A similar enhancing effect on cisplatin‐induced phosphorylation of histone H2AX on Ser139 was observed with the HDAC inhibitor MS‐275 in OVCAR‐8 cells (data not shown). These results suggested that HDAC inhibitors, by inducing relaxation of the chromatin structure, sensitize tumor cells to the DNA‐damaging action of cisplatin.
Figure 3.
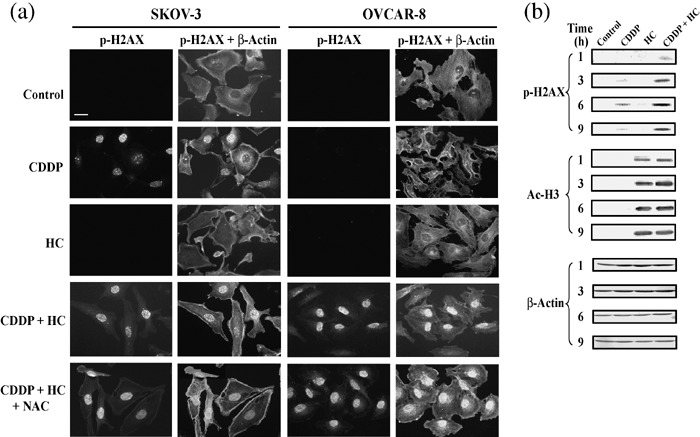
HC‐toxin enhances cisplatin‐induced phosphorylation of histone H2AX. (a) SKOV‐3 or OVCAR‐8 cells were incubated for 9 h with 30 µM cisplatin, 0.1 µM HC‐toxin, or both agents in the absence or presence of 10 mM N‐acetyl‐L‐cysteine (NAC), as indicated. The cells were fixed and subjected to immunofluorescence analysis with antibodies to the Ser139‐phosphorylated form of histone H2AX (p‐H2AX). The cells were counterstained with antibodies to β‐actin. Bar = 50 µm. (b) OVCAR‐8 cells were incubated for the indicated times with 30 µM cisplatin, 0.1 µM HC‐toxin, or both agents, after which cell lysates (50 µg of protein) were subjected to immunoblot analysis with antibodies to phospho‐H2AX, to acetylated histone H3 (Ac‐H3), or to β‐actin (loading control). All data are representative of three separate experiments.
HC‐toxin enhances cisplatin‐induced accumulation of ROS. Cisplatin‐induced cytotoxicity has been associated with the generation of ROS in cells.( 33 , 34 ) The cisplatin‐induced accumulation of ROS was found to be markedly suppressed in the inherently cisplatin‐resistant HT‐29 colon adenocarcinoma cell line.( 35 , 36 ) In addition, the antitumor activity of HDAC inhibitors has also been associated with their ability to induce the intracellular accumulation of ROS.( 37 , 38 ) With the use of the ROS‐sensitive dye, CM‐H2DCFDA, we therefore next examined whether HC‐toxin enhances the ability of cisplatin to induce the generation of ROS in ovarian cancer cells.
Treatment of cisplatin‐sensitive OVCAR‐3 cells with 30 µM cisplatin for 24 h resulted in the generation of ROS, and this effect was enhanced by 0.1 µM HC‐toxin (Fig. 4a). In contrast, cisplatin or HC‐toxin alone did not induce the accumulation of ROS in cisplatin‐resistant OVCAR‐8 cells, whereas the combination of these agents induced a marked increase in ROS generation in these cells (Fig. 4a). The synergistic effect of cisplatin and HC‐toxin on ROS accumulation in OVCAR‐8 cells peaked at 24 h (Fig. 4b). The free‐radical scavenger, N‐acetyl‐L‐cysteine (NAC), abolished the combined effect of cisplatin and HC‐toxin on ROS generation in both OVCAR‐3 and OVCAR‐8 cells (Fig. 4a,b). Furthermore, although NAC did not inhibit the phosphorylation of histone H2AX on Ser139 (Fig. 3a), it blocked the induction of apoptosis, the activation of caspase‐3, ‐8, and ‐9, and the downregulation of Akt, XIAP, and Bcl‐xL by the combination of cisplatin and HC‐toxin in OVCAR‐8 cells (Fig. 4c). HC‐toxin also potentiated the cisplatin‐induced accumulation of ROS and cell death in cisplatin‐resistant HT‐29 colon tumor cells, and the combined effects of these drugs were again abolished by the presence of NAC (Fig. 4d). These results thus indicated that HC‐toxin promotes cisplatin‐induced DNA damage to enhance the generation of ROS in tumor cells, and that the ROS so generated mediate apoptotic cell death induced by the combination of these agents.
HDAC inhibitors selectively enhance the induction of cell death by a variety of DNA‐damaging agents. Finally, we examined whether the induction of cell death by other anticancer drugs is also enhanced by HDAC inhibitors. The drugs examined included DNA‐damaging agents such as mitomycin‐C (a DNA cross‐linking agent), bleomycin (a radiomimetic), topotecan (a topoisomerase‐I inhibitor), doxorubicin (a topoisomerase‐II inhibitor), and etoposide (a topoisomerase‐I inhibitor); as well as metabolic antagonists such as 5‐fluorouracil and Ara‐C; and microtubule‐targeting agents such as paclitaxel (a microtubule‐stabilizing agent) and vincristine (a microtubule‐destabilizing agent).
The sensitivity of OVCAR‐8 or SKOV‐3 cells to the various anticancer drugs varied substantially. However, HC‐toxin (0.1 µM) enhanced the death‐inducing effect of all DNA‐damaging agents examined, irrespective of the sensitivity of the tumor cells to these drugs (Fig. 5a). In contrast, HC‐toxin either did not affect or antagonized the cytotoxicity of 5‐fluorouracil, Ara‐C, paclitaxel, or vincristine in these tumor cells (Fig. 5a, data not shown). HC‐toxin also enhanced the induction of histone H2AX phosphorylation on Ser139 (Fig. 5b) and the accumulation of ROS (Fig. 5c) induced by each of the DNA‐damaging agents. Furthermore, NAC markedly suppressed both the accumulation of ROS and the cell death induced by treatment of the tumor cells with each combination of HC‐toxin and DNA‐damaging agent (Fig. 5c). 5‐Fluorouracil or vincristine did not induce phosphorylation of histone H2AX on Ser139 or the accumulation of ROS, and NAC did not affect the induction of cell death by these agents, in OVCAR‐8 cells (data not shown). These results suggest that HDAC inhibitors selectively enhance the cell death‐inducing efficacy of a wide variety of DNA‐damaging agents by potentiating the effects of these drugs on DNA damage and ROS generation.
Figure 5.
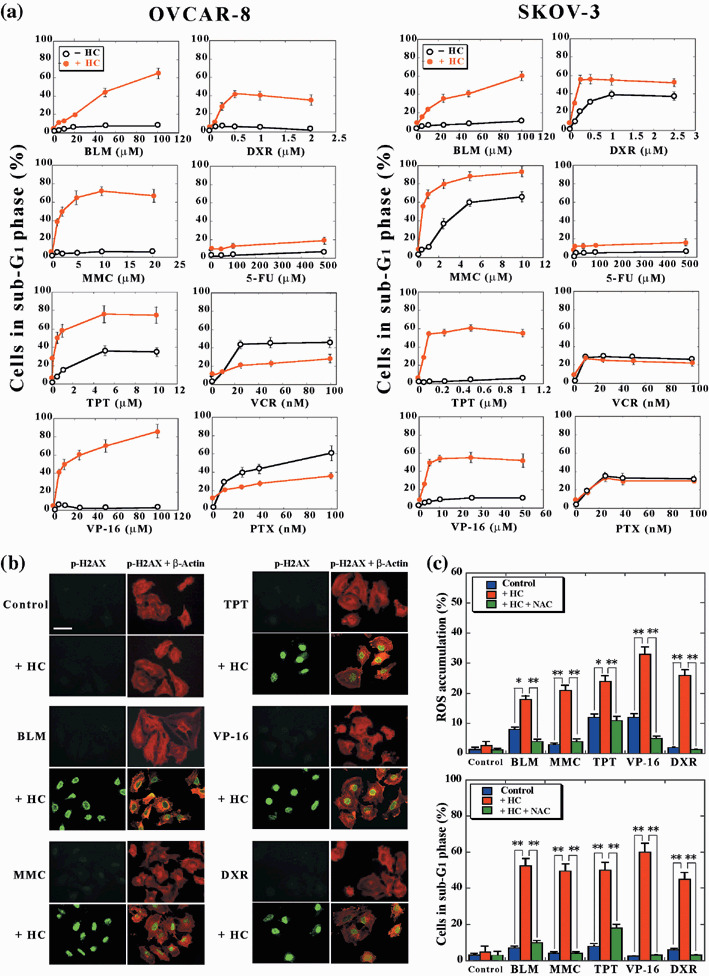
HC‐toxin selectively enhances the induction of cell death by a variety of DNA‐damaging agents. (a) OVCAR‐8 or SKOV‐3 cells were incubated for 48 h with the indicated concentrations of bleomycin (BLM), mitomycin‐C (MMC), topotecan (TPT), etoposide (VP‐16), doxorubicin (DXR), 5‐fluorouracil (5‐FU), vincristine (VCR), or paclitaxel (PTX), in the absence (–HC) or presence (+HC) of 0.1 µM HC‐toxin. The proportion of cells in sub‐G1 phase was then determined using flow cytometry. Data are means ± SD from three separate experiments, each performed in duplicate. (b) OVCAR‐8 cells were incubated for 9 h with 50 µM BLM, 2 µM MMC, 0.5 µM TPT, 20 µM VP‐16, or 0.5 µM DXR, in the absence or presence of 0.1 µM HC‐toxin. They were then fixed and subjected to immunofluorescence analysis with antibodies to phosphorylated H2AX. The cells were counterstained with antibodies to β‐actin. Bar = 100 µm. Data are representative of three separate experiments. (c) OVCAR‐8 cells were incubated for 24 h (upper panel) or 48 h (lower panel) as in (b) but in the additional absence or presence of 10 mM NAC, as indicated. The proportion of cells manifesting ROS accumulation (upper panel) or a fractional DNA content (lower panel) was then determined using flow cytometry. Data are means ± SD from three separate experiments, each performed in duplicate. *P < 0.01, **P < 0.001.
Discussion
Cisplatin is one of the most effective DNA‐targeting anticancer drugs for the treatment of individuals with various solid tumors, including ovarian cancer. However, development of resistance is a major barrier to successful chemotherapy with this drug, with such resistance being relatively common in patients repeatedly treated with cisplatin. We have now shown that low concentrations of HDAC inhibitors, which by themselves exhibited little cytotoxic effect, markedly sensitized tumor cells to the induction of cell death by cisplatin. Importantly, this enhancing effect of HDAC inhibitors on cisplatin cytotoxicity was most pronounced in tumor cells with marked cisplatin resistance, including OVCAR‐8 ovarian tumor cells that have acquired resistance,( 29 ) and HT‐29 colon adenocarcinoma cells that have intrinsic resistance.( 35 , 36 ) It is worthy of mention that normal cells are less susceptible to the combinatory treatment with cisplatin and HDAC inhibitors: whereas the proportion of TIG‐3 or IMR‐90 diploid fibroblast cells in sub‐G1 phase was 15–20% or approximately 5% after treatment for 48 h with 30 µM cisplatin or 0.1 µM HC‐toxin, respectively, this proportion was increased only slightly to show at most an additive, but not a synergistic effect, when these cells were treated with the combination of both agents (Ozaki et al., unpublished data, 2007).
Various mechanisms have been proposed for the development of cisplatin resistance in tumor cells, including increased expression of drug efflux pumps such as P‐glycoprotein (MDR1) and multidrug‐resistance protein (MRP), overexpression of enzymes that mediate drug detoxification such as γ‐glutamyl‐cysteine synthetase (γ‐GCS), and enhanced activation of DNA repair systems such as the nucleotide excision repair pathway mediated in part by excision repair cross‐complementation group 1 (ERCC‐1) and xeroderma pigmentosum group A (XPA) proteins.( 39 , 40 ) We compared the expression levels of several markers of cisplatin resistance, including MDR1, MRP2, ATP7B, γ‐GCS, ERCC‐1, and XPA, among five ovarian tumor cell lines (OVCAR‐3, ‐4, ‐5, and ‐8 and SKOV‐3 cells) and HT‐29 cells by semiquantitative reverse transcription–polymerase chain reaction (RT–PCR) analysis. Both of the cisplatin‐resistant tumor cell lines (OVCAR‐8 and HT‐29) characteristically manifested a higher level of ERCC‐1 gene expression than did the other tumor cell lines, and this increased level of expression was not affected by treatment with the combination of cisplatin and HC‐toxin (Supplementary Fig. S2). These results suggest that increased DNA repair, rather than enhanced activity of drug efflux pumps or drug detoxification enzymes, contributes to cisplatin resistance in OVCAR‐8 and HT‐29 cells. Consistent with these observations, OVCAR‐8 cells exhibit cross‐resistance to other DNA‐damaging agents such as mitomycin‐C and doxorubicin, but to neither vincristine nor paclitaxel. Low concentrations of HDAC inhibitors selectively and markedly enhanced the cell death‐inducing effect of all the DNA‐targeting anticancer drugs examined in OVCAR‐8 and SKOV‐3 cells, irrespective of the sensitivity to the respective drug, and thereby overcame their cross‐resistance.
Treatment of tumor cells with HDAC inhibitors induces hyper‐acetylation of core histones and consequent relaxation of chromatin structure. Such an open chromatin configuration induced by HDAC inhibitors would be expected to increase accessibility of genomic DNA not only to transcription factors but also to drugs that target DNA. Consistent with this notion, HC‐toxin potentiated the phosphorylation of histone H2AX on Ser139, a marker of DNA damage, induced by various DNA‐damaging agents. Although the free‐radical scavenger NAC suppressed not only the accumulation of ROS but also the activation of caspases, downregulation of antiapoptotic proteins, and cell death induced in OVCAR‐8 cells by the combination of HC‐toxin and cisplatin, it did not inhibit the phosphorylation of histone H2AX on Ser139. These results thus indicate that HDAC inhibitors promote the induction of DNA damage by a variety of DNA‐targeting agents, which then results in enhanced generation of ROS, with the accumulated ROS then eliciting apoptotic cell death. Although the cytotoxicity of HDAC inhibitors has been shown to be associated with the accumulation of ROS in cells,( 37 , 38 ) the precise mechanism through which DNA damage induced by DNA‐targeting anticancer drugs promotes the accumulation of ROS in tumor cells remains to be elucidated.
It has recently been reported that the sensitization of tumor cells to VP‐16 cytotoxicity is observed only when TSA is added before VP‐16.( 20 ) Pretreatment of tumor cells with HDAC inhibitors for several hours, however, appears not to be a strict prerequisite to enhance the cytotoxic effect of DNA‐damaging agents. HC‐toxin induced a rapid (within 1 h) and sustained (>12 h) hyperacetylation of histone H3 in OVCAR‐8 and SKOV‐3 cells (Fig. 3b). In the present study, these tumor cells were treated simultaneously with HC‐toxin and respective DNA‐damaging agents to exhibit the enhanced cytotoxic effect of the latter agents. Pretreatment of OVCAR‐8 cells with HC‐toxin for 6 h, or the addition of HC‐toxin 12 h after the treatment of the cells with respective DNA‐damaging agents did not at all affect the enhancing effect of HC‐toxin on the cytotoxicity of the latter drugs (Ozaki et al., unpublished data, 2007). Such a rather loose condition of drug administration for exhibiting the markedly enhanced cytotoxic effect would make the combination of HDAC inhibitors and DNA‐damaging agents easily adaptable for clinical applications.
In conclusion, our results indicate that co‐administration of HDAC inhibitors and a wide variety of DNA‐damaging drugs is a promising chemotherapeutic strategy for the eradication of tumor cells, regardless of whether the cells are sensitive or resistant to the DNA‐damaging drugs.
Supporting information
Fig. S1. Synergism between cisplatin and HC‐toxin in OVCAR‐8 cells. Isobologram analysis at IC50 was based on the results of water‐soluble tetrazolium (WST)‐8 assays performed on OVCAR‐8 cells treated with the combination of varying concentrations of CDDP and HC‐toxin for 48 h. The data points corresponding to all the combination treatments fall far below the line of additivity (the broken line), indicating synergistic interaction between CDDP and HC‐toxin.
Fig. S2. Expression of the ERCC‐1 gene is increased in cisplatin‐resistant OVCAR‐8 and HT‐29 cells. (A) Semiquantitative reverse transcription–polymerase chain reaction (RT–PCR; 28, 30, or 32 cycles) analysis was performed with a ThermoScript RT–PCR system (Invitrogen) and 5 µg of total RNA isolated from the indicated cell lines. The primer sets were 5′‐AATTTGTGATACCCCTCGAC‐3′ and 5′‐ATGTAGTCTGGGTGCAGGTT‐3′, 5′‐TACTGGAGGCATGGCTAATG‐3′ and 5′‐CATATCACCCCATTGTGAATG‐3′, 5′‐CAGCAAAGGAGGCCAACATAC‐3′ and 5′‐TGAGGCTGTCTAACAAGGGCA‐3′, 5′‐CAAACTCTATCTTGCTAAGCAGG‐3′ and 5′‐TGAGTACAAGGGCCAGCTCTA‐3′, 5′‐TCCTGGTGGCTATTGACGGTGT‐3′ and 5′‐CATTCAGGCGCAGAGACCACTT‐3′, or 5′‐GGTGACATTCCAAGCCTGCA‐3′ and 5′‐CCAGGAGATGATCAATGCCT‐3′ for amplification of 397, 370, 142, 337, 833, and 350‐bp fragments of human ERCC‐1, XPA, MDR1, MRP2, ATP7B, or &ggr;‐GCS cDNA, respectively. Each PCR cycle consisted of incubation at 94°C for 30 s, 58°C for 42 s, and 72°C for 1 min, and a final extension step was performed at 72°C for 10 min. A 410‐bp fragment of &bgr;‐actin cDNA was amplified as an internal control with the primers 5′‐CAGAGCAAGAGAGGCATCCT‐3′ and 5′‐TCGGTGAGGATCTTCATGAG‐3′. Amplified products were separated on 2.0% agarose gels. (B) Semiquantitative RT–PCR analysis was performed for the ERCC‐1 gene, as described above, with the use of total RNA (5 µg) isolated from the indicated tumor cell lines after incubation in the absence (Ct) or presence of 30 µM cisplatin (CP), 0.1 µM HC‐toxin, or both agents for 9 h. Data are representative of three separate experiments.
This material is available as part of the online article from:
http://www.blackwell‐synergy.com/doi/abs/10.1111/j.1349‐7006.2008.00669.x
< http://www.blackwell‐synergy.com/doi/abs/10.1111/j.1349‐7006.2008.00669.x>
(This link will take you to the article abstract).
Please note: Blackwell Publishing are not responsible for the content or functionality of any supplementary materials supplied by the authors. Any queries (other than missing material) should be directed to the corresponding author for the article.
Supporting info item
Supporting info item
Acknowledgments
This study was supported in part by Grants‐in‐Aid for Scientific Research from the Ministry of Education, Culture, Sports, Science, and Technology of Japan.
References
- 1. Estellaer M. Cancer epigenomics: DNA methylomes and histone‐modification maps. Nat Rev Genet 2007; 8: 286–98. [DOI] [PubMed] [Google Scholar]
- 2. Jones PA, Baylin SB. The epigenomics of cancer. Cell 2007; 128: 683–92. [DOI] [PMC free article] [PubMed] [Google Scholar]
- 3. Nalikar GJ, Fan HY, Kingston RE. Cooperation between complexes that regulate chromatin structure and transcription. Cell 2002; 108: 475–87. [DOI] [PubMed] [Google Scholar]
- 4. Clayton AL, Hazzalin CA, Mahadevan LC. Enhanced histone acetylation and transcription: a dynamic perspective. Mol Cell 2006; 23: 289–96. [DOI] [PubMed] [Google Scholar]
- 5. Kuo MH, Allis CD. Roles of histone acetyltransferases and deacetylases in gene regulation. Bioessays 1998; 20: 615–26. [DOI] [PubMed] [Google Scholar]
- 6. Lund AH, Van Lohuizen M. Epigenetics and cancer. Genes Dev 2004; 18: 2315–35. [DOI] [PubMed] [Google Scholar]
- 7. Feinberg AP, Tycko B. The history of cancer epigenetics. Nat Rev Cancer 2004; 4: 143–53. [DOI] [PubMed] [Google Scholar]
- 8. Marks PA, Rifkind RA, Richon VM et al . Histone deacetylase and cancer: cause and therapies. Nat Rev Cancer 2001; 1: 194–202. [DOI] [PubMed] [Google Scholar]
- 9. Zhu P, Martin E, Mengwasser J et al . Induction of HDAC2 expression upon loss of APC in colorectal tumorigenesis. Cancer Cell 2004; 5: 455–63. [DOI] [PubMed] [Google Scholar]
- 10. Johnstone RW. Histone deacetylase inhibitors: novel drugs for treatment of cancer. Nat Rev Drug Discov 2002; 1: 287–99. [DOI] [PubMed] [Google Scholar]
- 11. Marks PA, Richon VM, Miller T, Kelly WK. Histone deacetylase inhibitors. Adv Cancer Res 2004; 91: 137–68. [DOI] [PubMed] [Google Scholar]
- 12. Insinga A, Monestiroli S, Ronzoni S et al . Inhibitors of histone deacetylases induce tumor‐selective apoptosis through activation of the death receptor pathway. Nat Med 2005; 11: 71–6. [DOI] [PubMed] [Google Scholar]
- 13. Nebbioso A, Clarke N, Voltz E et al . Tumor‐selective action of HDAC inhibitors involves TRAIL induction in acute myeloid leukemia cells. Nat Med 2005; 11: 77–84. [DOI] [PubMed] [Google Scholar]
- 14. Ozaki K, Minoda A, Kishikawa F, Kohno M. Blockade of the ERK pathway markedly sensitizes tumor cells to HDAC inhibitor‐induced cell death. Biochem Biophys Res Commun 2006; 339: 1171–7. [DOI] [PubMed] [Google Scholar]
- 15. Minucci S, Pelicci PG. Histone deacetylase inhibitors and the promise of epigenetic (and more) treatments for cancer. Nat Rev Cancer 2006; 6: 38–51. [DOI] [PubMed] [Google Scholar]
- 16. Görisch SM, Wachsmuth M, Tóth KF, Lichter P, Rippe K. Histone acetylation increases chromatin accessibility. J Cell Sci 2005; 118: 5825–34. [DOI] [PubMed] [Google Scholar]
- 17. Camphausen K, Cerna D, Scott T et al . Enhancement of in vitro and in vivo tumor cell radiosensitivity by valproic acid. Int J Cancer 2005; 114: 380–6. [DOI] [PubMed] [Google Scholar]
- 18. Karagiannis TC, El‐Osta A. Modulation of cellular radiation responses by histone deacetylase inhibitors. Oncogene 2006; 25: 3885–93. [DOI] [PubMed] [Google Scholar]
- 19. Kim MS, Baek JH, Chakravarty D, Sidransky D, Carrier F. Sensitization to UV‐induced apoptosis by the histone deacetylase inhibitor trichostatin A (TSA). Exp Cell Res 2005; 306: 94–102. [DOI] [PubMed] [Google Scholar]
- 20. Kim MS, Blake M, Baek JH, Kohlhagen G, Pommier Y, Carrier F. Inhibition of histone deacetylase increases cytotoxicity to anticancer drugs targeting DNA. Cancer Res 2003; 63: 7291–300. [PubMed] [Google Scholar]
- 21. Piacentini P, Donadelli M, Costanzo C, Moore PS, Palmieri M, Scarpa A. Trichostatin A enhances the response of chemotherapeutic agents in inhibiting pancreatic cancer cell proliferation. Virchows Arch 2006; 448: 797–804. [DOI] [PubMed] [Google Scholar]
- 22. Hurley LH. DNA and its associated processes as targets for cancer therapy. Nat Rev Cancer 2002; 2: 188–200. [DOI] [PubMed] [Google Scholar]
- 23. Hoshino R, Chatani Y, Yamori T et al . Constitutive activation of the 41‐/43‐kDa mitogen‐activated protein kinase signaling pathway in human tumors. Oncogene 1999; 18: 813–22. [DOI] [PubMed] [Google Scholar]
- 24. Tanimura S, Nomura K, Ozaki K, Tsujimoto M, Kondo T, Kohno M. Prolonged nuclear retention of activated extracellular signal‐regulated kinase 1/2 is required for hepatocyte growth factor‐induced cell motility. J Biol Chem 2002; 277: 28256–64. [DOI] [PubMed] [Google Scholar]
- 25. Hoshino R, Tanimura S, Watanabe K, Kataoka T, Kohno M. Blockade of the extracellular signal‐regulated kinase pathway induces marked G1 cell cycle arrest and apoptosis in tumor cells in which the pathway is constitutively activated: up‐regulation of p27Kip1 . J Biol Chem 2001; 276: 2686–92. [DOI] [PubMed] [Google Scholar]
- 26. Fujiwara Y, Kawada K, Takano D, Tanimura S, Ozaki K, Kohno M. Inhibition of the PI3 kinase/Akt pathway enhances doxorubicin‐induced apoptotic cell death in tumor cells in a p53‐dependent manner. Biochem Biophys Res Commun 2006; 340: 560–6. [DOI] [PubMed] [Google Scholar]
- 27. Ozaki K, Miyazaki S, Tanimura S, Kohno M. Efficient suppression of FGF‐2‐induced ERK activation by the cooperative interaction among mammalian Sprouty isoforms. J Cell Sci 2005; 118: 5861–71. [DOI] [PubMed] [Google Scholar]
- 28. Fujiwara Y, Hosokawa Y, Watanabe K, Tanimura S, Ozaki K, Kohno M. Blockade of the phosphatidylinositol‐3‐kinase Akt signaling pathway enhances the induction of apoptosis by microtubule‐destabilizing agents in tumor cells in which the pathway is constitutively activated. Mol Cancer Ther 2007; 6: 1133–42. [DOI] [PubMed] [Google Scholar]
- 29. Schilder RJ, Hall L, Monks A et al . Metallothionein gene expression and resistance to cisplatin in human ovarian cancer. Int J Cancer 1990; 45: 416–22. [DOI] [PubMed] [Google Scholar]
- 30. Darzynkiewicz Z, Juan G, Li X, Gorczyca W, Murakami T, Traganos F. Cytometry in cell necrobiology: analysis of apoptosis and accidental cell death (necrosis). Cytometry 1999; 27: 1–20. [PubMed] [Google Scholar]
- 31. Diaz C, Lee AT, McConkey DJ, Schroit AJ. Phosphatidylserine externalization during differentiation‐triggered apoptosis of erythroleukemic cells. Cell Death Differ 1999; 6: 218–26. [DOI] [PubMed] [Google Scholar]
- 32. Rogakou EP, Pilch DR, Orr AH, Ivanova VH, Bonner WM. DNA double‐stranded breaks induce histone H2AX phosphorylation on serine 139. J Biol Chem 1998; 273: 5858–68. [DOI] [PubMed] [Google Scholar]
- 33. Miyajima A, Nakashima J, Yoshioka K, Tachibana M, Tazaki H, Murai M. Role of reactive oxygen species in cis‐dichlorodiamineplatinum‐induced cytotoxicity on bladder cancer cells. Br J Cancer 1997; 76: 206–10. [DOI] [PMC free article] [PubMed] [Google Scholar]
- 34. Huang HL, Fang LW, Lu SP, Chou CK, Luh TY, Lai MZ. DNA‐damaging reagents induce apoptosis through reactive oxygen species‐dependent Fas aggregation. Oncogene 2003; 22: 8168–77. [DOI] [PubMed] [Google Scholar]
- 35. Pendyala L, Creaven PJ. In vivo cytotoxicity, protein binding, red blood cell partitioning, and biotransformation of oxaliplatin. Cancer Res 1993; 53: 5970–6. [PubMed] [Google Scholar]
- 36. Benhar M, Dalyot I, Engelberg D, Levitzki A. Enhanced ROS production in oncogenically transformed cells potentiates c‐Jun N‐terminal kinase and p38 mitogen‐activated protein kinase activation and sensitization to genotoxic stress. Mol Cell Biol 2001; 21: 6913–26. [DOI] [PMC free article] [PubMed] [Google Scholar]
- 37. Ruefli AA, Ausserlechner MJ, Bernhard D et al . The histone deacetylase inhibitor and chemotherapeutic agent suberoylanilide hydroxamic acid (SAHA) induces a cell‐death pathway characterized by cleavage of Bid and production of reactive oxygen species. Proc Natl Acad Sci USA 2001; 98: 10833–8. [DOI] [PMC free article] [PubMed] [Google Scholar]
- 38. Rosato RR, Almenara JA, Grant S. The histone deacetylase inhibitor MS‐275 promotes differentiation or apoptosis in human leukemia cells through a process regulated by generation of reactive oxygen species and induction of p21CIP1/WAF1 . Cancer Res 2003; 63: 3637–45. [PubMed] [Google Scholar]
- 39. Perez RP. Cellular and molecular determinants of cisplatin resistance. Eur J Cancer 1998; 34: 1535–42. [DOI] [PubMed] [Google Scholar]
- 40. Dabholkar M, Vionnet J, Bostick‐Bruton F, Yu JJ, Reed E. Messenger RNA levels of XPAC and ERCC1 in ovarian cancer tissue correlated with response to platinum‐based chemotherapy. J Clin Invest 1994; 94: 703–8. [DOI] [PMC free article] [PubMed] [Google Scholar]
Associated Data
This section collects any data citations, data availability statements, or supplementary materials included in this article.
Supplementary Materials
Fig. S1. Synergism between cisplatin and HC‐toxin in OVCAR‐8 cells. Isobologram analysis at IC50 was based on the results of water‐soluble tetrazolium (WST)‐8 assays performed on OVCAR‐8 cells treated with the combination of varying concentrations of CDDP and HC‐toxin for 48 h. The data points corresponding to all the combination treatments fall far below the line of additivity (the broken line), indicating synergistic interaction between CDDP and HC‐toxin.
Fig. S2. Expression of the ERCC‐1 gene is increased in cisplatin‐resistant OVCAR‐8 and HT‐29 cells. (A) Semiquantitative reverse transcription–polymerase chain reaction (RT–PCR; 28, 30, or 32 cycles) analysis was performed with a ThermoScript RT–PCR system (Invitrogen) and 5 µg of total RNA isolated from the indicated cell lines. The primer sets were 5′‐AATTTGTGATACCCCTCGAC‐3′ and 5′‐ATGTAGTCTGGGTGCAGGTT‐3′, 5′‐TACTGGAGGCATGGCTAATG‐3′ and 5′‐CATATCACCCCATTGTGAATG‐3′, 5′‐CAGCAAAGGAGGCCAACATAC‐3′ and 5′‐TGAGGCTGTCTAACAAGGGCA‐3′, 5′‐CAAACTCTATCTTGCTAAGCAGG‐3′ and 5′‐TGAGTACAAGGGCCAGCTCTA‐3′, 5′‐TCCTGGTGGCTATTGACGGTGT‐3′ and 5′‐CATTCAGGCGCAGAGACCACTT‐3′, or 5′‐GGTGACATTCCAAGCCTGCA‐3′ and 5′‐CCAGGAGATGATCAATGCCT‐3′ for amplification of 397, 370, 142, 337, 833, and 350‐bp fragments of human ERCC‐1, XPA, MDR1, MRP2, ATP7B, or &ggr;‐GCS cDNA, respectively. Each PCR cycle consisted of incubation at 94°C for 30 s, 58°C for 42 s, and 72°C for 1 min, and a final extension step was performed at 72°C for 10 min. A 410‐bp fragment of &bgr;‐actin cDNA was amplified as an internal control with the primers 5′‐CAGAGCAAGAGAGGCATCCT‐3′ and 5′‐TCGGTGAGGATCTTCATGAG‐3′. Amplified products were separated on 2.0% agarose gels. (B) Semiquantitative RT–PCR analysis was performed for the ERCC‐1 gene, as described above, with the use of total RNA (5 µg) isolated from the indicated tumor cell lines after incubation in the absence (Ct) or presence of 30 µM cisplatin (CP), 0.1 µM HC‐toxin, or both agents for 9 h. Data are representative of three separate experiments.
This material is available as part of the online article from:
http://www.blackwell‐synergy.com/doi/abs/10.1111/j.1349‐7006.2008.00669.x
< http://www.blackwell‐synergy.com/doi/abs/10.1111/j.1349‐7006.2008.00669.x>
(This link will take you to the article abstract).
Please note: Blackwell Publishing are not responsible for the content or functionality of any supplementary materials supplied by the authors. Any queries (other than missing material) should be directed to the corresponding author for the article.
Supporting info item
Supporting info item