

Abstract
Transforming growth factor‐β1 (TGF‐β1), a cytokine involved in various stages of cancer, is produced as a latent complex and requires processing to become active. We have determined total and active TGF‐β1 levels in homogenates of colorectal neoplasia. In contrast to total TGF‐β levels, showing a stepwise increase in the mucosa‐adenoma‐carcinoma sequence, active TGF‐β1 levels are increased only in carcinomas but not in premalignant adenomas. Furthermore, solely active TGF‐β1 levels are associated with the stage of the carcinomas and worse patient prognosis. Active TGF‐β1 levels correlated significantly with plasminogen activator inhibitor (PAI)‐1, α‐smooth muscle actin (SMA) and several matrix‐remodeling proteinases. Interestingly, SMA levels are also significantly increased in colorectal carcinomas but not in adenomas, suggesting that despite the enhanced total TGF‐β1 levels, myofibroblast accumulation is not (yet) occurring in these premalignant neoplasias. The correlation between active TGF‐β1 and SMA expression in tumors indicates that tumor‐promoting myofibroblasts might arise as a result of increased TGF‐β1 activation. These data underline the significance of the interaction between malignant cells and (myo)‐fibroblasts in the tumor microenvironment, modulating the biologic behavior of colorectal cancer. (Cancer Sci 2009; 100: 663–670)
Abbreviations:
- ECM
extracellular matrix
- ELISA
enzyme‐linked immunosorbent assay
- MMP
matrix metalloproteinase
- PAI
plasminogen activator inhibitor
- SMA
smooth muscle actin
- TGF‐β
transforming growth factor beta
- tPA
tissue type plasminogen activator
- uPA
urokinase type plasminogen activator
The tumor microenvironment is increasingly recognized as an important factor in cancer progression.( 1 , 2 , 3 ) Malignant cells induce host reactions, that is, immune reactions, angiogenesis, and desmoplasia/fibrosis within and around tumor tissue. Tumor fibrosis consists of an accumulation of extracellular matrix‐producing myofibroblasts and was initially regarded as the host's barrier against cancer dissemination.( 4 ) Myofibroblasts are hyper‐activated fibroblasts that simultaneously express vimentin, fibroblast‐activation protein (FAP), and α‐smooth muscle actin (SMA).( 5 ) Physiologically, myofibroblasts play a role in wound healing in which they rearrange the extracellular matrix (ECM) and contract wound edges by SMA‐mediated contractile properties.( 6 ) In cancer, myofibroblasts circumvent apoptosis and remain hyper‐activated, secreting high amounts of ECM molecules, cytokines, and matrix‐degrading enzymes including matrix metalloproteinases (MMPs).( 7 ) In addition, they influence the immune response,( 8 ) induce pro‐invasive signals for tumor cells,( 9 ) and influence epithelial‐mesenchymal transitions.( 7 ) The origin of myofibroblasts has not been fully elucidated and is likely a combination of bone marrow‐derived fibrocytes and transition of resident fibroblasts.( 10 ) In cancer tissues the majority of myofibroblasts arise presumably from activation of fibroblasts by direct cell–cell contact, for example, via EMMPRIN,( 5 , 11 ) or via growth factors like transforming growth factor‐β (TGF‐β).( 12 , 13 )
TGF‐β1 is synthesized as a latent, ECM‐bound molecule which is activated via proteolytic and non‐proteolytic pathways.( 14 ) Activation of the latent TGF‐β complex is crucial, because up‐regulation without activation will have little biological and clinical consequences.( 15 , 16 ) In cancer, TGF‐β has tumor‐inhibiting as well as tumor‐promoting effects.( 17 , 18 ) Although many details of the working mechanisms of TGF‐β in cancer still have to be elucidated, the induction of SMA expression in fibroblasts, leading to myofibroblast trans‐differentiation, is well established, at least in vitro.( 19 )
In this study, we examined the presence of total and active TGF‐β1 in the colorectal mucosa‐adenoma‐carcinoma sequence using tissue homogenates. The clinical relevance of TGF‐β1 levels was evaluated by correlations with the grade and stage of the tumor and the survival of the patients. Furthermore, TGF‐β1 levels were compared with various known target proteins like plasminogen activator inhibitor (PAI)‐1, urokinase type plasminogen activator (uPA), and matrix metalloproteinases MMP‐2 and MMP‐9. To evaluate the role of TGF‐β1 in myofibroblast generation, an enzyme‐linked immunosorbent assay (ELISA) for SMA, an established myofibroblast marker, was developed.( 19 , 20 , 21 ) The results of this study indicate the clinical importance of especially active TGF‐β1 levels and its relation with the quantity of myofibroblasts in colorectal carcinomas.
Materials and methods
Patient materials and homogenates. Representative tissue specimens from endoscopically or surgically resected colorectal adenomas (female n = 14, male n = 21), carcinomas (female n = 77, male n = 102; Dukes A, n = 3, B, n = 105, C, n = 45, D, n = 26) and adjacent mucosa (n = 179) were collected from the Departments of Oncologic Surgery and Gastroenterology of the Leiden University Medical Center according to the guidelines of the Medical Ethics Committee of the Leiden University Medical Center. Macroscopic and microscopic parameters were obtained from the pathology reports; clinical data and follow‐up were available for at least 10 years. The tissues were homogenized using a micropotter in Tris/Tween‐80 (pH 7.5) and protein concentrations were determined according to Lowry.( 22 ) In short, 10 µL homogenate or buffer was incubated for 10 min with 500 µL MiliQ and 2.5 mL of a solution consisting of 0.5 mL 2% K‐Na‐tartrate, 0.5 mL 1% CuSO4, 50 mL 2% Na2CO3 in 0.1 M NaOH. Next, 250 µL Folin reagent (Merck, 1:1 diluted with MiliQ) was added and after 30 min the A750 was determined. Bovine serum albumin (BSA) was used as a standard. Under these conditions the extraction buffers containing edetic acid (EDTA), sodium dodecylsulfate (SDS), Triton X‐100 or β‐mercaptoethanol did not interfere with the assay (background absorption A750 < 0.01).
TGF‐β1 ELISA. Total and active TGF‐β1 levels were determined as described previously.( 16 ) In short, plates were coated O/N with TGF‐β1 capture antibody, blocked, and 30 µL sample, with or without acid activation, was incubated to determine, respectively, endogenous active and total tissue TGF‐β1 levels. Immune‐detection was performed with biotinylated antibodies and a substrate reagent pack according to the manufacturer's protocol (R & D Systems, Abington, UK).
ELISAs for uPA, tPA, PAI‐1, PAI‐2, MMP‐2 and MMP‐9. The levels of uPA, tPA, PAI‐1, PAI‐2, MMP‐2 and MMP‐9 were determined with established ELISAs as described previously.( 22 , 23 )
SMA ELISA. To determine SMA levels in colorectal tissue homogenates an ELISA was developed. Maxisorp 96‐well plates (Nunc, Roskilde, Denmark) were coated with rabbit polyclonal anti‐SMA antibodies (Abcam, Cambridge, UK, 1:5000, stock 0.5 mg/mL) overnight at 4°C in coating buffer (NaHCO3 buffer, pH 9.6). Plates were washed after each step with PBS containing 0.05% Tween‐20 (PBST, Merck, Darmstadt, Germany). Non‐specific binding was blocked with phosphate‐buffered saline (PBS) containing 5% Tween‐20, 0.05% NaN3 for 1 h at 37°C. Samples were 1:10 diluted in PBS containing 1% BSA (Sigma, Darmstadt, Germany)/0.05% Tween‐20 and allowed to bind for 2 h at 37°C. Immunodetection was performed with mouse monoclonal anti‐SMA antibodies (stock 50 µg/mL, 1:32 000 diluted in PBS/1% BSA, clone ASM‐1, Progen, Heidelberg, Germany) overnight at 4°C, biotinylated goat antimouse antibodies (Dako, Glostrup, Denmark, 1:4000, 2 h at room temperature [RT]) and streptavidin‐horseradish peroxidase (HRP) (1:200, R & D Systems). Color development was performed with a substrate reagent kit according to the manufacturer's protocol (Dy999, R & D Systems). Absorbance was measured at 450 nm. SMA content was calculated in arbitrary units (AU)/mg protein, using a colonic muscle homogenate and TGF‐β1‐stimulated colonic fibroblasts as positive controls.
SMA ELISA validation. Colon cancer samples and corresponding mucosa samples were homogenized using the previously described conventional potter method (in Tris/Tween‐80), or using an Ultra Turrax (IKA Labortechnik, Staufen, Germany) on ice in 50 mM Tris/HCL buffer, pH 7.6 containing 1% Triton X‐100 (BDH Chemicals, Poole, UK) or using a mikro‐dismembrator (Sartorius, Aubagne, France) for 30 s at 3000 r.p.m. (shaking frequency 3000 min) followed by extraction with Tris‐HCl, pH 7.6 containing 1% Triton X‐100 for 5 h at 4°C. After centrifugation, the extracts were used for TGF‐β1 determination, whereas the pellets containing the insoluble actin filaments were further extracted with a 10 mM Tris/HCL buffer, pH 7.5 with 1% SDS, 1.25%β‐mercaptoethanol and 2 mM EDTA by boiling for 3 min and subsequent sonification for 30 s.( 24 ) Final protein concentrations were determined according to Lowry.( 25 ) SMA levels were analyzed using an ELISA and Western blotting as described below.
The sensitivity of the SMA ELISA was evaluated on four tissue samples using Turrax homogenation: two colorectal cancer samples, one colon cancer‐derived liver metastasis and one gastrointestinal stromal tumor (GIST). For these samples ELISA‐derived SMA levels were compared with Western blot analysis and immunohistochemistry on the same samples. For Western blot analysis 10 µg protein was analyzed on a 10% SDS‐PAGE (polyacrylamide gel electrophoresis) under reducing conditions. Proteins were transferred to a nitrocellulose membrane (Whatman, Dasel, Germany) overnight and equal loading was confirmed by ponceau‐S staining (Sigma) of the blot. Non‐specific binding was blocked with 0.2% gelatin (30 min at RT). After washing with PBS containing 0.05% Tween (PBST), immunodetection was performed with the antibody used as detection antibody in the ELISA, mouse monoclonal anti‐SMA (1:5000, 2 h RT). Next, blots were incubated with biotinylated goat‐anti‐mouse antibodies, HRP‐conjugated streptavidin (both Dako) and finally detection was performed using a chemoluminescent substrate according to the manufacturer's protocol (Super Signal West Pico, Pierce, Rockford, IL, USA).
Immunohistochemistry. Tissue samples were fixated, dehydrated through graded alcohol and xylene and embedded in paraffin. Consecutive sections of 4 µm were deparaffinized and rehydrated. Subsequent antigen retrieval was performed by boiling in sodium citrate buffer pH 6.0 for 10 min. Immunostaining was performed using mouse monoclonal anti‐SMA, mouse monoclonal antivimentin, mouse monoclonal antipan‐cytokeratin (both Santa Cruz Biotechnologies, Santa Cruz, CA, USA), mouse monoclonal antidesmin (clone 33, kindly provided by the Department of Pathology, Leiden University Medical Center), mouse monoclonal anti‐PAI‐1 (Novocastra Laboratories Ltd, Newcastle, UK), rabbit monoclonal antipSmad‐2 (Cell Signaling Technology, St. Quentin Falavier, France), mouse monoclonal anti‐uPA (TNO‐BioSciences, Leiden, the Netherlands) as described previously.( 16 ) In short, primary antibodies were incubated overnight at RT followed by detection with biotinylated goat anti‐mouse antibodies and StreptAvidin‐Biotin Complex (all Dako). Staining was visualized using diaminobenzidine with H2O2. Positive and negative controls (by omitting primary antibodies) were included for all stainings. Representative photomicrographs were taken using a Nikon Eclipse E800 microscope equipped with a Nikon DXM 1200 digital camera.
Isolation and characterization of primary human colonic fibroblasts. Normal human mucosa was prepared from surgically obtained resection specimens by removing the muscle fraction. Tissue pieces of 5 mm were repeatedly treated with 0.5 M EDTA/PBS in a Wheaton chamber at 37°C until no epithelial cells were recovered from the tissue. The remaining tissue was washed with Dulbecco's Modified Eagles's Medium (DMEM)/F12 + Glutamax (Invitrogen, the Netherlands), containing 10% fetal calf serum (FCS, Perbio Science, Erebodegem, Belgium), 10 mM N‐2‐Hydroxyethylpiperazine‐N‐2‐Ethanesulfonic Acid (HEPES), 50 µg/mL gentamycin, 100 U/mL penicillin and 100 µg/mL streptomycin (all Invitrogen) and subsequently incubated in 75 cm2 flasks until outgrowth of fibroblast‐like cells was observed (7–10 days). The fibroblast origin of the cells was established by morphologic characteristics and immunohistochemical staining of cell markers. Staining was performed by preparing cytospin preparations, fixation with ice‐cold acetone (10 min), followed by overnight incubation with primary antibodies against vimentin and pan‐cytokeratin at 4°C and immunodetection. To generate myofibroblasts, subconfluent‐growing fibroblasts were stimulated with 5 ng/mL active recombinant human TGF‐β1 (Peprotech, London, UK) over 24 h. Myofibroblast differentiation was confirmed by positive staining for SMA (> 95%) on cytospin preparations.
Statistical analysis. Statistical analyses were performed using the SPSS 12.0 Statistical Package (2004, SPSS Inc., Chicago, IL, USA). Group means are accompanied by standard errors of the mean. Differences between groups were calculated using Student's t‐test. Correlations between SMA and TGF‐β levels were calculated according to Spearman. Log‐rank statistics were used for optimal cut‐off point analysis. Survival curves were according to Kaplan and Meier. P‐values = 0.05 were considered significant.
Results
TGF‐β1 levels in colorectal (pre)malignancies. Total and endogenously active TGF‐β1 levels determined in tissue homogenates of colorectal mucosa, adenomas and carcinomas are depicted in Fig. 1. Total TGF‐β1 levels were significantly increased in adenomas (116.8 ± 12.0 pg/mg protein, P < 0.0005) and carcinomas (372.0 ± 21.4 pg/mg, P < 0.0005) versus normal mucosa (41.2 ± 2.3 pg/mg) and adenomas (P < 0.0005), but showed no clear relation with the presence of dysplasia in adenomas, nor with the differentiation grade (Fig. 1a) or Dukes stage of the carcinomas (Fig. 1b). In contrast, active TGF‐β1 levels were not significantly increased in adenomas (9.2 ± 0.8 pg/mg, P = 0.120) compared to colorectal mucosa (8.6 ± 0.8 pg/mg). In carcinomas there was a significant (32.5 ± 2.9 pg/mg, P < 0.0005 vs. normal mucosa) and stepwise increase with differentiation (Fig. 1c) and Dukes stage of the tumor (Fig. 1d). To establish the correlation between TGF‐β1 levels and overall survival of the patients, we calculated optimal cut‐off points. Only for active TGF‐β1 a significant cut‐off point was found (13.7 pg/mg, Fig. 2a), resulting in a Log Rank of 4.06 with a P‐value of 0.0439 (Fig. 2b). Next, we analyzed the correlation of TGF‐β1 levels in colorectal tissue homogenates with various TGF‐β1 target genes (Table 1). Active and total TGF‐β1 correlated significantly with urokinase‐type plasminogen activator (uPA), the inhibitors PAI‐1 and PAI‐2 and matrix metalloproteinase MMP‐2, but not with non‐TGF‐β1 depending upon tissue‐type plasminogen activator (tPA). Interestingly, MMP‐9 correlated with total but not with active TGF‐β1. Immunohistochemical evaluation of the localization of these proteins revealed that especially the stainings for PAI‐1 and uPA were closely related with the nuclear pSmad‐2 staining, an indicator of the presence of TGF‐β activity (Fig. 3).
Figure 1.
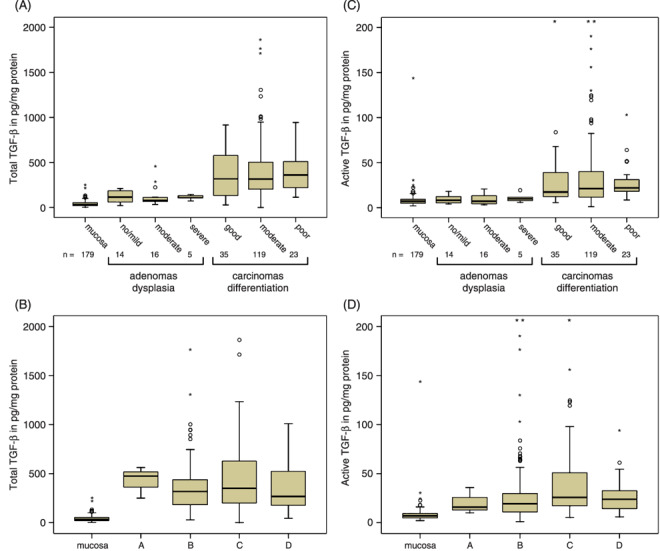
Total (A/B) and endogenous active (C/D) transforming growth factor‐β (TGF‐β) levels in homogenates from, respectively, colorectal normal mucosa, adenomas and carcinomas. The adenomas are subdivided by dysplasia and the carcinomas by differentiation (A/C) and Dukes stage (B/D). The box‐plots represent median, quartiles, extreme values (o) and outliers (*) in pg/mg protein.
Figure 2.
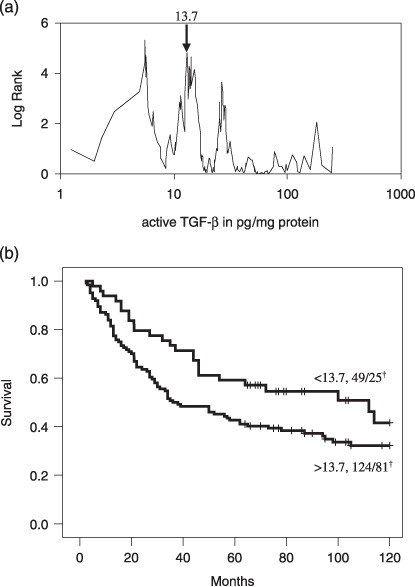
Optimal cut‐point analysis for active transforming growth factor‐β (TGF‐β1) with respect to overall survival of colorectal cancer patients (a). Kaplan–Meier survival curve showing that patients with high active TGF‐β1 levels (>13.7 pg/mg protein) had significant worse survival than patients with low levels (b: log rank 4.06, P = 0.04).
Table 1.
Correlation of transforming growth factor‐β (TGF‐β) with target proteins in colorectal mucosal, adenomatous and carcinomatous tissue. Protein levels were determined using ELISA's in tissue homogenates
| Proteins (ng/mg) | Active TGF‐β (pg/mg) | Total TGF‐β (pg/mg) | ||
|---|---|---|---|---|
| Spearman's Rho | P | Spearman's Rho | P | |
| uPA | 0.491 | <0.0005 | 0.650 | <0.0005 |
| tPA | 0.164 | 0.057 | –0.217 | 0.011 |
| PAI‐1 | 0.495 | <0.0005 | 0.599 | <0.0005 |
| PAI‐2 | 0.412 | <0.0005 | 0.328 | 0.002 |
| MMP‐2 | 0.343 | <0.0005 | 0.264 | <0.0005 |
| MMP‐9 | 0.095 | 0.210 | 0.343 | <0.0005 |
uPA: urokinase‐type plasminogen activator.
tPA: tissue‐type plasminogen activator.
PAI: plasminogen activator inhibitor.
MMP: matrix metalloproteinase.
Figure 3.
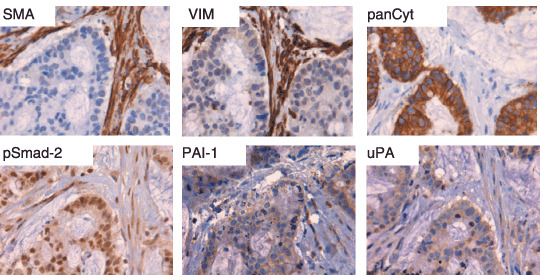
Immunohistochemical staining of human colonic cancer for smooth muscle actin (SMA) in myofibroblasts in comparison with mesenchymal cell marker vimentin (VIM) and epithelial cell marker pan‐cytokeratin (panCyt). The nuclear staining of pSmad‐2 indicates transforming growth factor‐β (TGF‐β) activity in malignant cells and surrounding myofibroblasts. The staining patterns for TGF‐β activity‐inducible proteins plasminogen activator inhibitor (PAI‐1) and urokinase plasminogen activator (uPA) are comparable with pSmad‐2.
Development and validation of an SMA‐ELISA. Because TGF‐β1 is in vitro able to differentiate fibroblasts into SMA‐expressing myofibroblasts, we examined the relation between TGF‐β1 and SMA levels in colorectal tissue samples using a newly developed ELISA. Our conventional potter/Tris–Tween‐based method of homogenization proved not stringent enough to extract detectable amounts of actin filaments from colorectal tissues (Fig. 4a). Two alternative homogenization methods were capable of extracting detectable amounts of SMA from these tissue samples, as shown on the same Western blot. Homogenization by Turrax or extracted pellets from dismembrator homogenates revealed similar levels of SMA. A Turrax muscle homogenate was subsequently used for evaluation of the ELISA. The absorbance units decreased linearly with increasing dilution of the samples (Fig. 4b). As a more relevant positive control for our purposes we prepared a series of five homogenates consisting of cultures of, respectively, 0, 25, 50, 75 and 100% SMA‐positive myofibroblast (>95%) completed with inversely decreasing numbers of non‐SMA expressing HT29 colon cancer cells. As expected, the ELISA levels showed a linearly increasing SMA signal with increasing myofibroblast levels (Fig. 4c). One hundred percent HT29 homogenate gave no detectable signal above background. To evaluate the ELISA further, four different gastrointestinal tumors were selected showing varying levels in the ELISA (Fig. 4d): Tu1 and Tu2 being colon carcinomas, Tu3 a colon cancer‐derived liver metastasis and Tu4 a gastrointestinal stromal tumor (GIST, connective tissue carcinoma) located in the ileum. Figure 4(e) shows intense bands for the samples with the highest ELISA signal (Muscle, Tu1, Tu2) and low levels observed for Tu3 and 4. The SMA‐levels of all tissue samples were inbetween the absent signal of HT29 cells and the high signal of the myofibroblast homogenate. Immunohistochemistry confirmed that the SMA‐signal as detected by Western blot and ELISA was derived from myofibroblasts (Fig. 4f). SMA immunoreactivity was mainly present in vimentin‐ and SMA‐positive myofibroblasts. In normal colorectal tissues SMA‐staining was observed in a thin layer of myofibroblasts along the crypt axis and in the muscularis mucosa beneath the colonic crypts (not shown). In carcinoma Tu1 very strong SMA expression was observed in the vast majority of the vimentin‐positive myofibroblasts, whereas cytokeratin‐positive tumor cells did not stain. Desmin staining, normally restricted to smooth muscle cells, revealed a few positive myofibroblasts. Carcinoma Tu2 also showed SMA expression in myofibroblasts, but to a lesser extent than observed in Tu1. Tu3, the colonic liver metastasis showed lower numbers of fibroblasts of which some were SMA‐positive and desmin‐negative. Finally the GIST (Tu4) showed almost exclusively vimentin‐positive fibroblasts, but hardly any SMA‐positive cells, reflecting the data obtained by ELISA.
Figure 4.
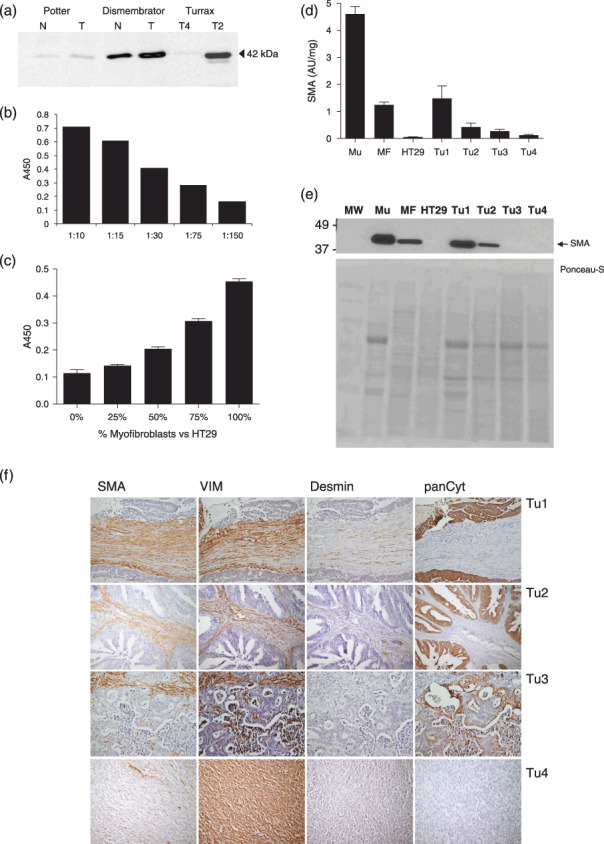
Development of an enzyme‐linked immunosorbent assay (ELISA) for smooth muscle actin (SMA). (a) Western blot showing variations in SMA content of tissue homogenates generated with different extraction methods. SMA absorption levels were measured in increasing dilution of a colonic muscle homogenate (b) or decreasing amount of myofibroblasts versus non‐SMA expressing HT29 colon cancer cells (c). Four different gastrointestinal cancers show different SMA expression values (d) (Tu1 and Tu2 colon carcinoma, Tu3 colon cancer‐derived liver metastasis, Tu4 GIST located in the ileum). SMA Western blot analysis (e) and immunohistochemistry (f) on the same samples to confirm the data obtained by ELISA. (SMA = smooth muscle actin, myofibroblast and smooth muscle cell marker; Vim = vimentin, stromal cell marker; desmin, smooth muscle cell marker; panCyt = pan‐cytokeratin, epithelial marker).
SMA levels in colorectal (pre)malignancies. SMA levels were determined by ELISA in dismembrator‐type homogenates from normal colorectal mucosa, adenomas and carcinomas. Figure 5(a) shows significantly increased SMA levels for malignant tumors (1.50 ± 0.15 AU/mg protein, n = 16) compared to normal mucosa (1.0 ± 0.08, n = 18, P = 0.005), whereas benign adenomas appeared to have even lower SMA expression levels (0.55 ± 0.07, n = 17, P = 0.0005) than mucosa. The SMA levels correlated significantly with active (Fig. 5b, Rho = 0.558, P = 0.0005) and total TGF‐β1 (Fig. 5c, Rho = 0.599, P = 0.0005) levels in these samples.
Figure 5.
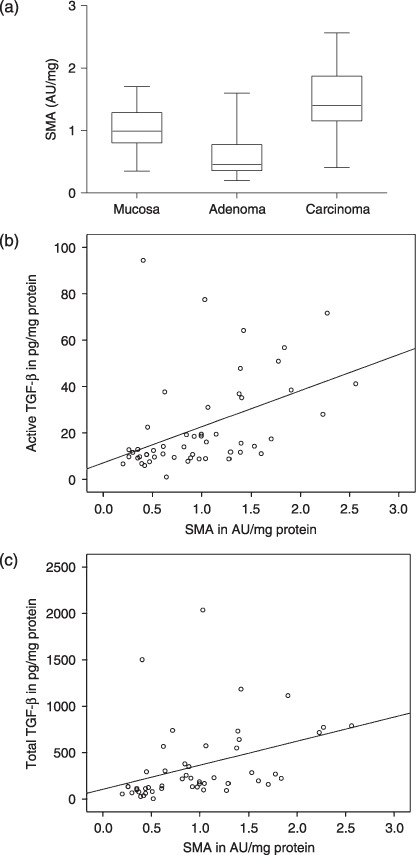
Smooth muscle actin (SMA) expression levels in colorectal (pre)malignancies as determined by enzyme‐linked immunosorbent assay (ELISA). (a) The SMA concentration, representative for myofibroblast content is significantly increased in colorectal carcinomas (P = 0.005), but not in adenomas. The box‐plots represent median and quartiles. Correlation between SMA and active (b) and total (c) levels of transforming growth factor‐β (TGF‐β) (both P = 0.0005).
Discussion
The pluripotent growth factor TGF‐β1 is produced as a latent precursor and therefore activation is a crucial regulating event. We have previously shown the clinical relevance of high levels of active TGF‐β1 levels in gastric cancer,( 16 ) which we have now confirmed in a larger series of colorectal cancers and premalignant adenomatous polyps. Up‐regulation of the latent TGF‐β1 complex is already detectable early in the colorectal normal‐adenoma‐carcinoma sequence, whereas substantial increase of TGF‐β1 activity occurs merely in carcinomas, showing an increasing stepwise relation with differentiation grade and Dukes stage. Furthermore, only high active TGF‐β1 levels were related to worse survival of the cancer patients. Although several studies have been performed on the expression of TGF‐β1 in colorectal carcinomas,( 26 , 27 ) up to now only one study also examined total and active TGF‐β1 levels.( 28 ) They found that higher total TGF‐β1 protein expression was associated with increasing tumor stage, but did not find a significant difference in active TGF‐β1 levels between normal and tumor samples. The discrepancy with our study could be due to sensitivity differences between the different assays used. Although on average their levels of total TGF‐β1 were comparable with the results from our study, active TGF‐β levels in normal tissue, requiring extreme sensitivity, are probably better detectable using a mild detergent‐containing lysis buffer, as in our studies.
Myofibroblasts of normal colon, adenoma and carcinoma differ in the expression of 395 genes.( 6 ) Although the origin of myofibroblasts is probably heterogeneous, TGF‐β1 mediated trans‐differentiation of resident fibroblasts seems to be a major source of myofibroblast aggregation in cancer.( 12 ) Cancer‐associated myofibroblasts promote the progression of carcinomas by modulation of invasion, angiogenesis and the immune response,( 6 , 7 ) and the recent association between the presence of tumor stromal cells with poor survival of colon carcinoma patients is in part due to myofibroblasts.( 29 ) Various studies have assessed the presence and number of myofibroblasts in colorectal (pre)malignancies, mainly based on immunohistochemical staining of SMA.( 20 , 30 , 31 ) We have developed an ELISA capable of detecting SMA‐levels in homogenates of colorectal tissues, but found that the method of tissue homogenization is crucial for SMA detection. Conventional Triton X‐100 extracts, obtained according to the protocol recently described,( 32 ) showed hardly detectable SMA levels, because this technique is not stringent enough to extract the actin filaments.( 24 ) However, when resulting membrane fractions were boiled and treated with strong detergent and β‐mercaptoethanol (to prevent clustering of the SMA filaments) this resulted in detection of levels of SMA, comparable to homogenation using a Turrax. Regardless of the two homogenization methods, a significant increase in SMA was observed in colorectal carcinomas compared to adjacent mucosa. Immunohistochemistry revealed the expression of SMA being present in myofibroblasts in different cancers. Desmin staining, normally restricted to smooth muscle cells, revealed also few desmin‐positive myofibroblasts, which has been described recently,( 33 ) and could indicate a minor additional source of myofibroblasts. SMA was also detectable in normal colorectal tissue probably because of the high expression of SMA in the muscularis mucosa. Interestingly, adenomas contained lower SMA levels than normal tissue, which could be explained by the fact that the majority of the cells is of epithelial origin and the relative absence of muscularis mucosa in these samples. In addition, SMA expression has also been shown to be dependent on the histological type of the adenoma.( 20 ) The low levels of SMA in adenomas suggest that the up‐regulated levels of total TGF‐β1 should be mainly of premalignant epithelial origin. The relative inactivity of this adenomatous TGF‐β1 is probably due to the absence of an efficient activation mechanism and could result in suppression of malignant outgrowth of the tumor. Subsequent over‐activation of TGF‐β1 in the adenomas will induce myofibroblast formation and in turn increased TGF‐β1 expression, which further validates tumor‐associated myofibroblasts as therapeutic targets.( 34 , 35 )
Besides induction of SMA in myofibroblasts, TGF‐β1 is also a regulator of extracellular matrix remodelling‐associated genes. Colorectal tissue TGF‐β1 levels correlated significantly with the expression of urokinase and PAI‐1 levels, two well‐known TGF‐β1 target genes, but also with PAI‐2 and MMP‐2. MMP‐9 correlated with total but not with active TGF‐β1, whereas the control proteinase tissue‐type plasminogen activator did not correlate with TGF‐β1 at all. PAI‐1, urokinase and MMP‐2 have been found in colorectal cancer‐associated myofibroblasts as well as in epithelial cells.( 31 , 36 , 37 ) Our immunohistochemical results showed a comparable staining pattern between local TGF‐β activity (pSmad‐2) and uPA/PAI‐1 in both myofibroblasts and carcinoma cells. Recent studies have indicated that over‐expression and efficient localized activation of the uPA/PAI‐1 and MMP proteolytic cascade systems are especially distributed at the interface between tumor cells and stromal cells,( 38 , 39 , 40 ) where these proteinases are not only indispensable for matrix remodeling/tumor invasion but are also implicated in TGF‐β1 activation.( 41 , 42 ) Our results suggest that local (proteolytic) activation of tumor‐cell‐derived latent TGF‐β1 in premalignant adenomas might initiate the accumulation of cancer‐associated myofibroblasts by TGF‐β‐induced transdifferentiation of resident fibroblasts. In turn this results in uncontrolled up‐regulation of not only TGF‐β but also of proteinases, culminating in growth of tumor cells as well as stromal cells, and ultimately leading to invasion of the ECM.
In conclusion, we have shown that total and active TGF‐β1 levels are clearly related to the normal‐adenoma‐carcinoma sequence and active TGF‐β1 is more indicative of malignant progression, tumor stage and survival of patients than total TGF‐β1. Furthermore, the correlation between active TGF‐β1 levels and SMA expression might indicate a prominent role for TGF‐β1 in myofibroblast trans‐differentiation.
Acknowledgments
We thank Dr A. Gorter and E. Dreef from the Pathology Department of the LUMC for the generous antibody supply and immunohistochemical support.
References
- 1. Gout S, Huot J. Role of cancer microenvironment in metastasis: Focus on colon cancer. Cancer Microenviron 2008; 1: DOI 10.1007/s12307‐008‐0007‐2. [DOI] [PMC free article] [PubMed] [Google Scholar]
- 2. Park CC, Bissell MJ, Barcellos‐Hoff MH. The influence of the microenvironment on the malignant phenotype. Mol Med Today 2000; 6: 324–9. [DOI] [PubMed] [Google Scholar]
- 3. Nielsen JD, Moeslund M, Wandall HH et al . Influences of tumor stroma on the malignant phenotype. J Oral Pathol Med 2008; 7: 412–6. [DOI] [PubMed] [Google Scholar]
- 4. Ohtani H. Pathophysiologic significance of host reactions in human cancer tissue: desmoplasia and tumor immunity. Tohoku J Exp Med 1999; 187: 193–202. [DOI] [PubMed] [Google Scholar]
- 5. Orimo A, Weinberg RA. Heterogeneity of stromal fibroblasts in tumors. Cancer Biol Ther 2007; 6: 618–19. [DOI] [PubMed] [Google Scholar]
- 6. Powell DW, Adegboyega PA, Di Mari JF et al . Epithelial cells and their neighbors I. Role of intestinal myofibroblasts in development, repair, and cancer. Am J Physiol Gastrointest Liver Physiol 2005; 289: G2–7. [DOI] [PubMed] [Google Scholar]
- 7. Kalluri R, Zeisberg M. Fibroblasts in cancer. Nat Rev Cancer 2006; 6: 392–401. [DOI] [PubMed] [Google Scholar]
- 8. Lieubeau B, Heymann MF, Henry F et al . Immunomodulatory effects of tumor‐associated fibroblasts in colorectal‐tumor development. Int J Cancer 1999; 81: 629–36. [DOI] [PubMed] [Google Scholar]
- 9. De Wever O, Nguyen QD, Van Hoorde L et al . Tenascin‐C and SF/HGF produced by myofibroblasts in vitro provide convergent pro‐invasive signals to human colon cancer cells through RhoA and Rac. FASEB J 2004; 18: 1016–18. [DOI] [PubMed] [Google Scholar]
- 10. De Wever O, Mareel M. Role of tissue stroma in cancer cell invasion. J Pathol 2003; 200: 429–47. [DOI] [PubMed] [Google Scholar]
- 11. Huet E, Vallee B, Szul D et al . Extracellular matrix metalloproteinase inducer/CD147 promotes myofibroblast differentiation by inducing alpha‐smooth muscle actin expression and collagen gel contraction: implications in tissue remodeling. FASEB J 2008; 22: 1144–54. [DOI] [PubMed] [Google Scholar]
- 12. Ronnov‐Jessen L, Petersen OW, Koteliansky VE et al . The origin of the myofibroblasts in breast cancer. Recapitulation of tumor environment in culture unravels diversity and implicates converted fibroblasts and recruited smooth muscle cells. J Clin Invest 1995; 95: 859–73. [DOI] [PMC free article] [PubMed] [Google Scholar]
- 13. Wipff PJ, Rifkin DB, Meister JJ et al . Myofibroblast contraction activates latent TGF‐β1 from the extracellular matrix. J Cell Biol 2007; 179: 1311–23. [DOI] [PMC free article] [PubMed] [Google Scholar]
- 14. Ten Dijke P, Arthur HM. Extracellular control of TGF‐β signalling in vascular development and disease. Nat Rev Mol Cell Biol 2007; 8: 857–69. [DOI] [PubMed] [Google Scholar]
- 15. Barcellos‐Hoff MH, Ewan KB. Transforming growth factor‐beta and breast cancer: mammary gland development. Breast Cancer Res 2000; 2: 92–9. [DOI] [PMC free article] [PubMed] [Google Scholar]
- 16. Hawinkels LJ, Verspaget HW, Van Duijn W et al . Tissue level, activation and cellular localisation of TGF‐β1 and association with survival in gastric cancer patients. Br J Cancer 2007; 97: 398–404. [DOI] [PMC free article] [PubMed] [Google Scholar]
- 17. Muraoka‐Cook RS, Dumont N, Arteaga CL. Dual role of transforming growth factor‐β in mammary tumorigenesis and metastatic progression. Clin Cancer Res 2005; 11: 937s–43s. [PubMed] [Google Scholar]
- 18. Leivonen SK, Kahari VM. Transforming growth factor‐β signaling in cancer invasion and metastasis. Int J Cancer 2007; 121: 2119–24. [DOI] [PubMed] [Google Scholar]
- 19. Desmouliere A, Geinoz A, Gabbiani F et al . Transforming growth factor‐β1 induces alpha‐smooth muscle actin expression in granulation tissue myofibroblasts and in quiescent and growing cultured fibroblasts. J Cell Biol 1993; 122: 103–11. [DOI] [PMC free article] [PubMed] [Google Scholar]
- 20. Adegboyega PA, Mifflin RC, DiMari JF et al . Immunohistochemical study of myofibroblasts in normal colonic mucosa, hyperplastic polyps, and adenomatous colorectal polyps. Arch Pathol Laboratory Med 2002; 126: 829–36. [DOI] [PubMed] [Google Scholar]
- 21. Lewis MP, Lygoe KA, Nystrom ML et al . Tumour‐derived TGF‐β1 modulates myofibroblast differentiation and promotes HGF/SF‐dependent invasion of squamous carcinoma cells. Br J Cancer 2004; 90: 822–32. [DOI] [PMC free article] [PubMed] [Google Scholar]
- 22. Sier CF, Verspaget HW, Griffioen G et al . Imbalance of plasminogen activators and their inhibitors in human colorectal neoplasia. Implications of urokinase in colorectal carcinogenesis. Gastroenterology 1991; 101: 1522–8. [DOI] [PubMed] [Google Scholar]
- 23. Kubben FJ, Sier CF, Van Duijn W et al . Matrix metalloproteinase‐2 is a consistent prognostic factor in gastric cancer. Br J Cancer 2006; 94: 1035–40. [DOI] [PMC free article] [PubMed] [Google Scholar]
- 24. Kobayashi R, Tawata M, Field JB. Actin in Triton‐insoluble cytoskeleton of thyroid. Metabolism 1982; 31: 133–8. [DOI] [PubMed] [Google Scholar]
- 25. Lowry OH, Rosebrough NJ, Farr AL et al . Protein measurement with the Folin phenol reagent. J Biol Chem 1951; 193: 265–75. [PubMed] [Google Scholar]
- 26. Tsushima H, Kawata S, Tamura S et al . High levels of transforming growth factor β1 in patients with colorectal cancer: association with disease progression. Gastroenterology 1996; 110: 375–82. [DOI] [PubMed] [Google Scholar]
- 27. Bellone G, Carbone A, Tibaudi D et al . Differential expression of transforming growth factors‐β1‐β2 and ‐β3 in human colon carcinoma. Eur J Cancer 2001; 37: 224–33. [DOI] [PubMed] [Google Scholar]
- 28. Langenskiold M, Holmdahl L, Falk P et al . Increased TGF‐β1 protein expression in patients with advanced colorectal cancer. J Surg Oncol 2008; 97: 409–15. [DOI] [PubMed] [Google Scholar]
- 29. Mesker WE, Junggeburt JM, Szuhai K et al . The carcinoma‐stromal ratio of colon carcinoma is an independent factor for survival compared to lymph node status and tumor stage. Cell Oncol 2007; 29: 387–98. [DOI] [PMC free article] [PubMed] [Google Scholar]
- 30. Nakayama H, Enzan H, Miyazaki E et al . The role of myofibroblasts at the tumor border of invasive colorectal adenocarcinomas. Jpn J Clin Oncol 1998; 28: 615–20. [DOI] [PubMed] [Google Scholar]
- 31. Illemann M, Hansen U, Nielsen HJ et al . Leading‐edge myofibroblasts in human colon cancer express plasminogen activator inhibitor‐1. Am J Clin Pathol 2004; 122: 256–65. [DOI] [PubMed] [Google Scholar]
- 32. Schmitt M, Mengele K, Schueren E et al . European Organisation for Research and Treatment of Cancer (EORTC) Pathobiology Group standard operating procedure for the preparation of human tumour tissue extracts suited for the quantitative analysis of tissue‐associated biomarkers. Eur J Cancer 2007; 43: 835–44. [DOI] [PubMed] [Google Scholar]
- 33. Abergel A, Sapin V, Dif N et al . Growth arrest and decrease of alpha‐SMA and type I collagen expression by palmitic acid in the rat hepatic stellate cell line PAV‐1. Dig Dis Sci 2006; 51: 986–95. [DOI] [PubMed] [Google Scholar]
- 34. Micke P, Ostman A. Tumour–stroma interaction: cancer‐associated fibroblasts as novel targets in anti‐cancer therapy? Lung Cancer 2004; 45 (Suppl. 2): S163–75. [DOI] [PubMed] [Google Scholar]
- 35. Hofmeister V, Schrama D, Becker JC. Anti‐cancer therapies targeting the tumor stroma. Cancer Immunol Immunother 2008; 57: 1–17. [DOI] [PMC free article] [PubMed] [Google Scholar]
- 36. Sier CF, Fellbaum C, Verspaget HW et al . Immunolocalization of urokinase‐type plasminogen activator in adenomas and carcinomas of the colorectum. Histopathology 1991; 19: 231–7. [DOI] [PubMed] [Google Scholar]
- 37. Ornstein DL, MacNab J, Cohn KH. Evidence for tumor‐host cooperation in regulating MMP‐2 expression in human colon cancer. Clin Exp Metastasis 1999; 17: 205–12. [DOI] [PubMed] [Google Scholar]
- 38. Sier CF, Zuidwijk K, Zijlmans HJ et al . EMMPRIN‐induced MMP‐2 activation cascade in human cervical squamous cell carcinoma. Int J Cancer 2006; 118: 2991–8. [DOI] [PubMed] [Google Scholar]
- 39. Blavier L, Declerck YA. Considering the critical interface between tumor cells and stromal cells in the search for targets for anticancer therapy. Cancer Cell 2005; 7: 408–9. [DOI] [PubMed] [Google Scholar]
- 40. Bisson C, Blacher S, Polette M et al . Restricted expression of membrane type 1‐matrix metalloproteinase by myofibroblasts adjacent to human breast cancer cells. Int J Cancer 2003; 105: 7–13. [DOI] [PubMed] [Google Scholar]
- 41. Cauwe B, Van den Steen PE, Opdenakker G. The biochemical, biological, and pathological kaleidoscope of cell surface substrates processed by matrix metalloproteinases. Crit Rev Biochem Mol Biol 2007; 42: 113–85. [DOI] [PubMed] [Google Scholar]
- 42. Jenkins G. The role of proteases in transforming growth factor‐β activation. Int J Biochem Cell Biol 2008; 40: 1068–78. [DOI] [PubMed] [Google Scholar]