

Abstract
Array‐based comparative genomic hybridization (array‐CGH) has powerful potential for high‐throughput identification of genetic aberrations in cell genomes. We identified high‐level amplification of kallikrein (KLK) genes, which are mapped to 19q13.3 and belong to the serine protease family, in the course of a program to screen a panel of urinary bladder carcinoma cell lines for genomic copy number aberrations using our in‐house CGH‐array. Expression levels of KLK5, ‐6, ‐8 and ‐9 were significantly increased in three cell lines with copy number gains of these KLK genes. Knockdown of these KLK transcripts by specific small interfering RNA significantly inhibited the invasion of a bladder carcinoma cell line through Matrigel in vitro. Reverse transcription–polymerase chain reaction analysis of 42 primary bladder tumor samples showed that increased expression of KLK5 was frequently observed in invasive tumors (pT2–pT4) (14.3%, 6/42) compared with superficial tumors (pTa, pT1) (0%, 0/42; P = 0.0052), and expression levels of KLK5, ‐6, ‐8 and ‐9 mRNA were higher in invasive tumors than in superficial tumors (P < 0.0001, P = 0.0043, P = 0.0790 and P = 0.0037, respectively). These observations indicate that KLK5, ‐6, ‐8 and ‐9 may be the most likely targets of the 19q13.3 amplification, and may play a crucial role in promoting cancer‐cell invasion in bladder tumor. (Cancer Sci 2007; 98: 1078–1086)
Urinary bladder carcinoma is the most common urogenital malignancy, with most being transitional cell carcinomas (TCC). Approximately 70–80% of primary bladder carcinomas are superficial (pTis, pTa, pT1). Patients with superficial bladder carcinoma are treated by transurethral resection or intravesical immunotherapy and chemotherapy. Their 5‐year survival rate approaches 90%, but 50–70% of patients have subsequent recurrences, and 5–20% of post‐therapeutic recurrences progress to muscle‐invasive bladder carcinoma.( 1 ) However, approximately 20–30% of primary cases involve muscle‐infiltrating bladder cancers (pT2–pT4) at the time of first inspection. These patients with no evidence of metastasis are generally treated by cystectomy, although continent or incontinent urinary diversion with decreasing quality of life is still often required. The 5‐year survival rate is only approximately 60%, with the majority of deaths due to recurrence or metastasis. Chemotherapy is used for most patients with metastasis, which is correlated with high morbidity and mortality. However, more than 90% of such patients die within the first 5 years.( 2 ) Therefore, predicting the recurrence and progression of bladder carcinoma is crucial to improving prognosis and quality of life.
The development and progression of bladder carcinoma is a multistep process, the result of a series of genetic alterations occurring over the lifetime of a tumor.( 3 ) It has also been reported that the spectrum of alterations at the chromosomal level can vary depending on the grade of differentiation and the tumor stage in bladder carcinomas.( 4 ) Genomic amplifications and homozygous deletions are believed to be useful landmarks in cancer cell genomes for identifying oncogenes and tumor‐suppressor genes, respectively, critical to tumorigenesis. Therefore, the search for significant changes in copy number through the entire genome with high resolution will allow precise and rapid identification of oncogenes as well as tumor‐suppressor genes in various types of cancer. For this approach, we have applied several in‐house bacterial artificial chromosome (BAC)/P1‐derived artificial chromosome (PAC)‐based arrays for array‐based comparative genomic hybridization (array‐CGH) analyses.( 5 , 6 , 7 , 8 )
Here we examined seven bladder carcinoma cell lines by array‐CGH and identified high‐level amplification of kallikrein (KLK) genes. KLK comprise a family of 15 genes clustered together in chromosomal region 19q13.3, and encode secreted enzymes belonging to the serine protease family.( 9 , 10 ) Many members of this family have been previously described as being associated with various human cancers, such as prostate, breast and ovarian cancer.( 11 , 12 , 13 , 14 , 15 ) However, the significance of KLK genes to the pathogenesis of bladder carcinoma has never been reported. In the present study therefore we analyzed 42 primary bladder carcinoma cases, as well as seven bladder carcinoma cell lines, with regard to the frequency of the overexpression of KLK genes, and evaluated the association between these frequencies and the clinical characteristics of patients with bladder carcinoma. Furthermore, in order to explore the possible roles of KLK in cancer‐cell invasiveness, we show here that the knockdown of these KLK mRNAs by specific small interfering RNA (siRNA) can inhibit the invasion of bladder carcinoma cell lines in vitro through Matrigel‐containing basement membrane components. These findings suggest KLK to be novel molecular targets for the prevention of bladder tumor invasion.
Materials and Methods
Cell lines and primary tumor samples. Ku1, Ku7, EJ1, SNK57, NKB1, KK47 and T24 bladder carcinoma cell lines derived from TCC were used for the present study, and were maintained in Dulbecco's modified Eagle's medium (DMEM) containing 10% fetal bovine serum (FBS), 100 units/mL penicillin and 100 µg/mL streptomycin. A total of 42 frozen primary samples were obtained from TCC patients (pTis, no cases; pTa, 10 cases; pT1, 13 cases; pT2, nine cases; pT3, nine cases; and pT4, one case) treated at University Hospital, Kyoto Prefectural University of Medicine; University Hospital, Iwate Medical University School of Medicine and Kochi Medical School Hospital, with written consent from each patient in the formal style and after approval by the local ethics committees. All primary specimens analyzed in this study were diagnosed and classified into superficial tumors or invasive tumors by pathologists belonging to each institution. Clinical and laboratory data on all 42 of the patients with TCC were collected from the patients’ records. The TNM classification of Union International Contre le Cancer was used. Three of these patients were treated with neoadjuvant methotrexate, vinblastine, doxorubicin and cisplatin chemotherapy for one to three cycles. Genomic DNA and total RNA were extracted from the cell lines and the frozen tissue using a Genomic DNA Purification kit (Gentra, Minneapolis, MN, USA) and Isogen (Nippon Gene, Toyama, Japan) according to the manufacturers’ instructions. Total RNA from normal bladder was purchased from two sources: Clontech (Palo Alto, CA, USA) and Ambion (Austin, TX, USA).
Array‐CGH analysis. Two in‐house BAC/PAC‐based arrays, the MCG Whole Genome Array‐4500 containing 4523 clones covering the human genome at roughly a 0.7‐Mb resolution and the MCG Cancer Array‐800 containing 800 clones specifically selected to contain important tumor‐associated gene loci,( 5 , 6 , 7 , 8 ) were used in this study. Hybridizations were carried out as described elsewhere.( 8 ) Hybridized slides were scanned with a GenePix 4000B and acquired images were analyzed with GenePix Pro 6.0 imaging software (Axon Instruments, Foster City, CA, USA). Fluorescence ratios were normalized so that the mean of the middle third of log2 ratios across the array was zero. Average ratios that deviated significantly (>2 SD) from zero (log2 ratio <–0.4 and >0.4) were considered abnormal.
Fluorescence in situ hybridization using cell lines. Metaphase chromosome slides were prepared from normal male lymphocytes and bladder carcinoma cell lines. The location of each BAC (RPCI‐11 and CTC library) or PAC, used as a fluorescence in situ hybridization (FISH) probe, within the region of interest was compiled from information archived by the National Center for Biotechnology Information (http://www.ncbi.nlm.nih.gov/) or the University of California Santa Cruz Genome Bioinformatics (http://genome.ucsc.edu/). We confirmed or modified the mapping data according to the results of FISH using normal metaphase chromosomes. Probes were labeled with biotin‐16‐dUTP or digoxigenin‐11‐dUTP by nicktranslation (Roche Diagnostics, Tokyo, Japan), denatured with Cot‐1 DNA, and hybridized to the chromosome slides. Fluorescent detection of hybridization signals was carried out as described elsewhere.( 16 ) The cells were counter‐stained with 4′,6‐diamidino‐2‐phenylindole.
Reverse transcription–polymerase chain reaction. Single‐stranded cDNA was generated from total RNA( 6 ) and amplified with primers specific for each gene. The primer sequences for KLK1–KLK15 were obtained from previous reports.( 17 , 18 ) The primer sequences for other genes are available on request. The glyceraldehyde‐3‐phosphate dehydrogenase gene (GAPDH) was amplified at the same time to allow estimation of the efficiency of cDNA synthesis. Real‐time reverse transcription–polymerase chain reaction (RT‐PCR) was carried out using an ABI Prism 7900 Sequence Detection System (Applied Biosystems, Foster City, CA, USA), the SYBR Green PCR Master Mix (Applied Biosystems), and random‐primed cDNAs.
Screening of cell lines and primary bladder tumors for amplification by quantitative real‐time genomic polymerase chain reaction. We assessed gene amplification in genomic DNA isolated from the ovarian cancer cell line OVCAR‐3, the gastric cancer cell lines MKN28 and MKN74, and 16 primary bladder tumors (superficial, eight samples; muscle invasive, eight samples) by SYBR Green quantitative polymerase chain reaction (PCR). All of the relevant primer sequences are available on request. PCR was carried out with the SYBR Green PCR Master Mix on an ABI Prism 7900 Sequence Detection System.
Transient siRNA oligonucleotide transfection. The ‘Smart‐pool’ siRNA for KLK5, KLK6 or KLK8 (KLK5‐, KLK6‐ or KLK8‐siRNA, respectively) was purchased from Dharmacon (Lafayette, CO, USA), and was transiently transfected into Ku1 bladder carcinoma cells with Lipofectamine 2000 (Invitrogen, Carlsbad, CA, USA) according to the manufacturer's directions. Transfection of siRNA for the luciferase gene (CGUACGCGGAAUACUUCGA, Luc‐siRNA) synthesized by Sigma (Tokyo, Japan) and transfection with Lipofectamine 2000 only served as controls. The efficacy of the knockdown of gene expression by the gene‐specific siRNA was confirmed 48 and 96 h after transfection by RT‐PCR with a specific primer set for each gene.
In vitro invasion assay. To quantify the invasive activity of cancer cells in vitro, 24‐well transwell‐chamber culture systems (Becton Dickinson, Franklin Lakes, NJ, USA) were used. The upper surface of 6.4‐mm‐diameter filters with 8‐µm pores was precoated with Matrigel. At 48 h after transfection of siRNA, 5 × 10⁴ cells were added to the upper chamber after the lower chamber had been filled with 750 mL of DMEM with 5% FBS. Following 48 h of incubation, the non‐invasive cells on the upper surface of filters were removed with sterile cotton swabs. The invasive cells on the lower surface of filters were fixed and stained with the Diff‐Quik stain (Sysmex, Kobe, Japan), and stained cell nuclei were counted directly in triplicate. We assessed invasive potential using an invasion index to eliminate the influence of migration and proliferation as much as possible. Results were calculated as the percentage invasion through the Matrigel and filters relative to the migration through the control filters without Matrigel. The invasion index was also calculated as the ratio of the percentage invasion of a test cell over the percentage of a control cell.
Cell growth assay. Cells transiently transfected with KLK‐siRNA and control cells (3 × 10³) were seeded in 96‐well plates and allowed to grow for 4 consecutive days. Viable cells were assessed with the microtiter plate colorimetric water‐soluble trazolium salt (WST) assay (Cell counting kit‐8; Dojindo Laboratories, Kumamoto, Japan). The proliferation rate was taken as the ratio of the optical density at 450–650 nM on the second day to the density on the fourth day.
Statistical analysis. The Fisher's exact test or the χ2‐test was used to examine categorical data. The Mann–Whitney U‐test was used to compare the level of gene expression. All tests of significance were two‐sided and considered significant at the level P < 0.05.
Results
Array‐CGH analysis of bladder carcinoma cell lines. Copy number gains and losses were seen to some degree in all of the seven bladder carcinoma cell lines examined by both array‐CGH analyses. Among the genetic aberrations detected, high‐level amplifications and homozygous deletions are believed to be useful for identifying oncogenes and tumor‐suppressor genes, respectively, critical to tumorigenesis. Therefore, we paid attention to significant patterns of chromosomal abnormalities. Supplementary Tables S1 and S2 summarize the clones showing high‐level amplifications (log2 ratio >2.0) and homozygous deletions (log2 ratio <–2.0), respectively. Eight loci with high‐level amplifications (5p13.3, FRA5A; 11p13, FRA11E; 11q13.2‐13.3, FRA11H/FRA11A; 19q13.3, FRA19A) or homozygous deletions (3p14.2, FRA3B; 9p21.3, FRA9A/FRA9C) detected in this study are located at fragile sites.
Homozygous deletions were detected in five of the bladder carcinoma cell lines (Ku7, EJ1, SNK57, KK47, T24) in 12 clones, and five loci were represented (Suppl. Table S2). Among them, BAC RP11‐259 N12 at 1p21.1 and RP11‐43B19 at 6q26 are located within regions of large‐scale copy number variation in the human genome (Database of Genomic Variants, http://projects.tcag.ca/variation/), and BAC RP11‐91E8 at 3p21.31 harbors no putative tumor‐suppressor gene. A homozygous deletion of the region containing CDKN2A/p16 at 9p21.3 is frequently observed in bladder carcinoma, and can be detected by means of array‐CGH analysis.( 3 , 19 ) FHIT at 3p14.3 is a well‐known tumor suppressor gene in patients with bladder carcinoma.( 20 )
High‐level amplifications were detected in the Ku1, SNK57 and NKB1 cell lines in 10 clones, and five loci were represented (Suppl. Table S1). Several cancer‐related genes, CCND1, CD44, CDH6, EHF, KLK1‐KLK15 and PDZD2,( 16 , 21 , 22 , 23 , 24 ) are located at these loci. These loci were reported as regions with copy number gains in a BAC array‐based CGH analysis of 22 bladder carcinoma cell lines, although only one of the 22 cell lines overlapped with our series of cell lines.( 19 ) Within the 19q13 region, interestingly, copy number gains at 19q13.1 and 19q13.2 were reported in primary bladder tumors,( 3 , 4 ) but there is no report about high‐level amplifications at 19q13.3, which prompted us to further analyze this region to identify target genes for this alteration.
Definition of the 19q13.3 amplicon by FISH. High‐level amplification at 19q13.3 was identified in our array‐CGH analysis (Fig. 1). KLK1–KLK15 are located at 19q13.3, and have been reported as promising biomarkers of several cancers, including prostate, ovarian, testicular and breast cancers. However, hK3 translated from KLK3 mRNA has had the greatest impact on the screening, diagnosis, staging and monitoring of prostate cancer.( 25 , 26 ) The KLK6 gene is known to be overexpressed in ovarian cancers with gene amplification,( 27 ) although no other KLK genes are known to be targets for amplification. We therefore focused on the high‐level amplification at this locus, and first generated a defined amplicon map in three bladder carcinoma cell lines, Ku1, SNK57 and NKB1, which showed copy number gains at this locus in our array‐CGH analysis. A FISH analysis was carried out using 15 BAC spanning the amplified region as probes. Relative positions of these BAC on a map of the 19q13.3 region are indicated in Fig. 2a. Copy numbers, as well as the molecular organization of the amplicon, were assessed by analyzing hybridization patterns of metaphase and interphase chromosomes. In the Ku1 cell line, 10 BAC (RP11‐795B6, RP11‐10I11, RP11‐891J20, RP11‐99I13, RP11‐1108B3, RP11‐105H4, RP11‐749C22, RP11‐690A4, 79A3 and RP11‐344A8) produced the highest number of signals (14 copies) on marker chromosomes (Fig. 2b,c). Fewer signals were detected with the remaining five BAC (45F3, 1051H12, 22I5, 184K19 and 79I16), suggesting that they were located outside the amplicon. The other two cell lines examined by FISH yielded more than five signals; the number of signals in each line did not differ among the 15 BAC, except for one increase observed between BAC RP11‐1051H12 and RP11‐105H4 in the NKB1 cell line. Therefore, the smallest region of overlap (SRO) was defined between BAC RP11‐795B6 and RP11‐105H4. The size of the SRO was 870 kb, according to information in the University of California, Santa Cruz (UCSC) Genome Bioinformatics database (http://genome.ucsc.edu/), and was adopted as a critical region harboring targets.
Figure 1.
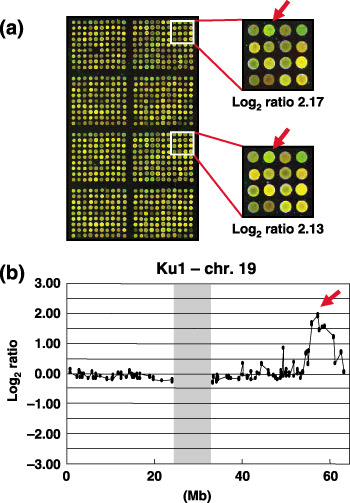
Array‐based comparative genomic hybridization (CGH‐array) analysis of bladder carcinoma cell lines. (a) Representative duplicate CGH‐array image of the Ku1 cell line. A significant increase in the copy number ratio (log2 ratio) of KLK at 19q13.3 was detected as a clear green signal. (b) Copy‐number profile of chromosome 19 in the Ku1 cell line. The arrow indicates a candidate spot showing the pattern of high‐level amplification (log2 ratio >2) at 19q13.3. A vertical shade marks the centromeric region.
Figure 2.
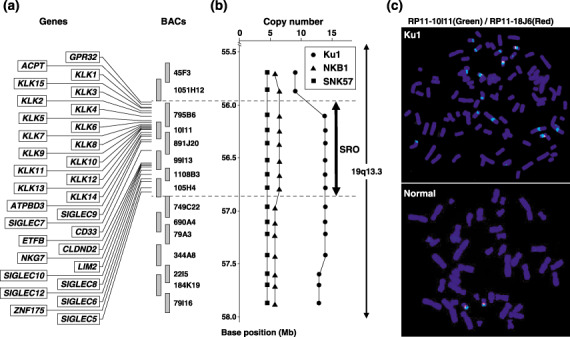
Definition of the 19q13.3 amplicon by fluorescence in situ hybridization (FISH). (a) Map of 19q13 covering the region amplified in bladder carcinoma cell lines. Genes located within the smallest region of overlap are positioned according to the information archived by UCSC and NCBI. Bacterial artificial chromosome (BAC) probes used for FISH are indicated as vertical bars. (b) Summarized results of a copy number analysis using FISH in three different cell lines. The horizontal axis shows the number of FISH signals detected with BAC probes. The closed thick arrow indicates the smallest region of overlap. (c) Representative FISH images from probe RP11‐10I11, which contains KLK (green signals) and with RP11‐18J6 as a control (red signals) hybridized to metaphase chromosomes from the Ku1 cell line and normal male lymphocytes. RP11‐10I11 shows 14 signals in the Ku1 cell line.
Expression of genes located on the 19q13.3 amplicon in bladder carcinoma cell lines. Next, to determine whether KLK1–KLK15 and other genes located at 19q13.3 were overexpressed in association with their amplification, we assessed the expression status of these genes in seven bladder carcinomas cell lines, one normal bladder as a normal control, and pancreas and prostate as positive controls using RT‐PCR (Fig. 3). KLK1, ‐5, ‐6, ‐7, ‐8, ‐9, ‐10, ‐11 and ‐14, SIGLEC9 and ‐10, GPR32, ATPBD3, ETFB, CLDND2, NKG7 and ZNF175 were expressed in three cell lines with amplification at 19q13.3, Ku1, SNK57 and NKB1; however, the expression of other genes mapped to this amplicon was not detected in any of the cell lines, except for CD33, which was expressed only in the T24 cell line. Among them, the increased expression levels of KLK5, ‐6, ‐8 and ‐9 were well associated with copy number gains in the Ku1, SNK57 and NKB1 cells. In the Ku1 cell line, which had the highest copy number gain in our array‐CGH analysis (Fig. 1b), the expression levels of KLK5, ‐6, ‐8 and ‐9 were much higher than in other cell lines. In addition, compared with the ovarian cancer cell line OVCAR‐3, the gastric cancer cell lines MKN28 and MKN74, which had already been reported to overexpress KLK5, ‐6, ‐8 and ‐9,( 15 , 17 ) had much lower levels of these KLK than the Ku1 cell line (Fig. 3b). Because no change in copy number at 19q13 was observed in OVCAR‐3, MKN28 or MKN74, the high‐level amplification at 19q13.3 might strongly contribute to the signigficant upregulation of these KLK in Ku1 cells (Fig. 3a). We did not detect transcripts of ACPT or LIM2 in any of the samples (data not shown).
Figure 3.
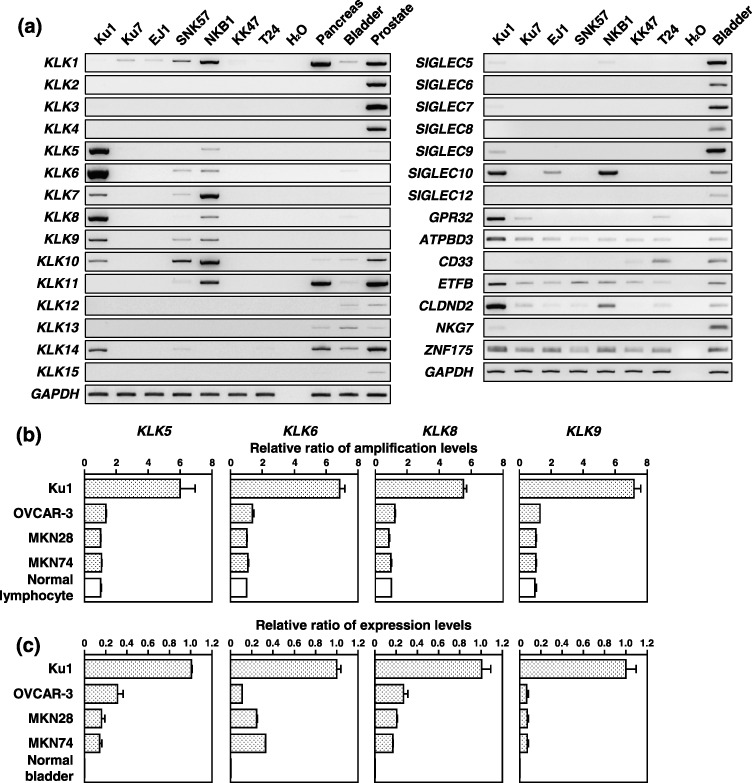
Expression of genes located on the 19q13.3 amplicon in bladder carcinoma cell lines. (a) Expression of KLK1–KLK15 and other genes located within smallest region of overlap in seven bladder carcinoma cell lines, one normal bladder as a normal control, and pancreas and prostate as positive controls detected by reverse transcription–polymerase chain reaction (PCR). Comparison of copy‐number (b) and expression (c) of the KLK5, KLK6, KLK8 or KLK9 genes by quantitative real‐time quantitative PCR. Genomic DNA of normal lymphocytes and total RNA of normal bladder were used as the normal counterpart of four cancer cell lines. These results were normalized to the copy number or expression levels of these KLK genes in each normal counterpart.
Inhibition of the in vitro invasiveness of Ku1 bladder carcinoma cells by KLK5, ‐6, ‐8 and ‐9 siRNA. Previously, experimental evidence indicated that KLK might promote cancer‐cell growth, angiogenesis, invasion and metastasis.( 28 ) Furthermore, some reports showed that hK5, hK6 and hK8 can degrade fibronectin, laminin and type IV collagen in vitro.( 12 , 13 , 29 ) These reports prompted us to investigate the role of KLK5, ‐6, ‐8 and ‐9 in cancer‐cell invasion because our findings indicated that the overexpression of these four KLK was correlated with copy number gains in three cell lines with amplification at 19q13.3. Hence we examined the effects of knocking down the KLK5, ‐6, ‐8 and ‐9 transcripts on in vitro cell growth and invasion in Ku1 cells which had the highest copy number gain and expression of these four KLK. The effects of the knockdown were confirmed at days 2 and 4 after siRNA transfection. The transcript levels of these four KLK were decreased significantly by the transient transfection of each specific siRNA, whereas these transcripts were detected in cells transfected with non‐specific‐ or Luc‐siRNA (Fig. 4a). The knockdown of these KLK mRNAs did not affect the in vitro growth rate of the transfectants (Fig. 4b), whereas the invasive potential of these specific siRNA transfectants was significantly reduced in the Matrigel invasion assay (Fig. 4c,d). Notably, KLK6‐siRNA was found to be a potent inhibitor of invasion through Matrigel compared with KLK5‐, KLK8‐ and KLK‐9‐siRNA. In morphological appearance, these transfectants showed no significant differences from the parental Ku1 cells (Fig. 4c).
Figure 4.
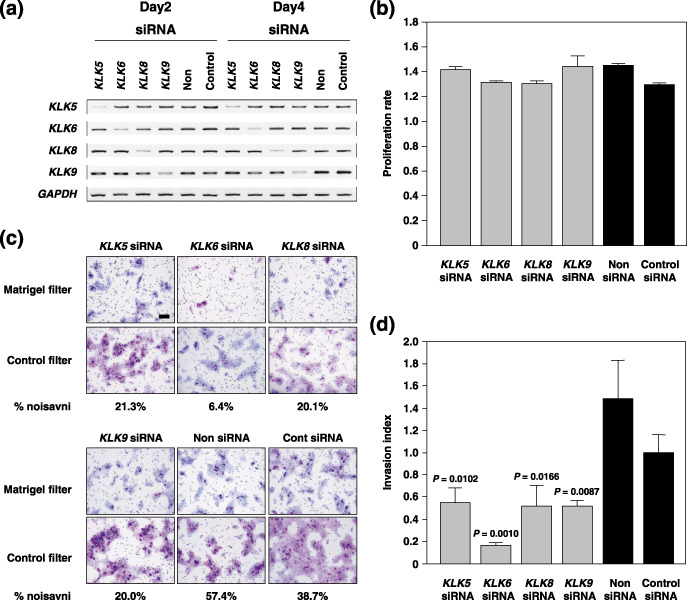
Inhibition of the in vitro invasiveness of Ku1 bladder carcinoma cells by KLK5, ‐6, ‐8 and ‐9‐specific small interfering RNA (siRNA). (a) Reverse transcription–polymerase chain reaction analysis of KLK5, ‐6, ‐8 and ‐9 in siRNA‐transfected Ku1 cells 2–4 days after transfection. Non, transfection of lipofectamine 2000 only; control, transfection of siRNA for the luciferase gene. (b) In vitro growth rate of KLK5, ‐6, ‐8 or ‐9‐suppressed cells in the presence of 5% fetal bovine serum. The cell number was counted 2–4 days after transfection. The proliferation rate was indicated as the ratio of the optical density at 450–650 nM on the second day. (c) Representative phase micrograph of Ku1 cells invading the Matrigel matrix and membrane (upper panel), and membrane only (lower panel). Invading cells were fixed and stained with the Diff‐Quik stain. Scale bar = 100 m. (d) Quantification of the cell invasion shown in (c). Percentage invasion: number of cells invading through Matigel insert membrane/number of cells migrating through control insert membrane ×100. Invasion index: % invasion test cell/% invasion control cell.
Expression of KLK5, ‐6, ‐8 and ‐9 in primary bladder carcinoma cases. Finally, we assessed the frequency and level of expression of these four KLK mRNAs in 42 primary bladder cancers by RT‐PCR. High‐level expression of KLK5, ‐6, ‐8 and ‐9, an increase of more than two‐fold in comparison with normal bladder tissue, was observed in 14.3% (6/42), 2.4% (1/42), 7.1% (3/42) and 19.0% (8/42) of primary tumors, respectively (Fig. 5a). The frequency of KLK5 mRNA expression was significantly higher in invasive tumors (pT2–pT4: 31.6%, 6/19) than in superficial tumors (pTa, pT1: 0%, 0/23; P = 0.0052, Fisher's exact test). Furthermore, this frequency also differed significantly between grade 3 tumors and grade 1–2 tumors (P = 0.0458, Fisher's exact test). The expression levels of KLK5, ‐6, ‐8 and ‐9 were higher in invasive tumors than in superficial tumors (P < 0.0001, P = 0.0043, P = 0.0790, and P = 0.0037, respectively, Mann–Whitney U‐test; Fig. 5b). There was no relationship between the increased expression of these four KLK and sex or past history of bladder carcinoma (Table 1). We could not analyze the prognostic significance because not all of the survival data was available. To confirm the association between overexpression and amplification of four KLK, we used a real‐time quantitative PCR with 16 primary bladder tumors (superficial, eight samples; muscle invasive, eight samples) in which the expression levels of these KLK had been analyzed. However, copy number alterations of these KLK genes were not detected in these primary tumors (Suppl. Fig. 1).
Figure 5.
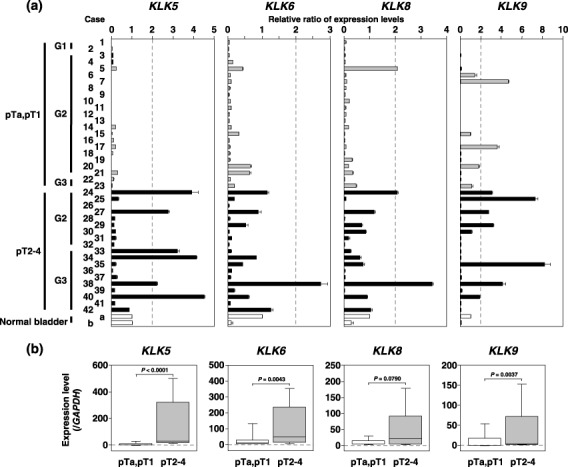
Expression of KLK5, ‐6, ‐8 and ‐9 in primary bladder tumors. (a) Expression of KLK5, ‐6, ‐8 and ‐9 in primary tumors detected by reverse transcription–polymerase chain reaction. Cases 1–23, superficial tumor; cases 24–42, invasive tumor. The expression level of each transcript normalized to glyceraldehyde‐3‐phosphate dehydrogenase was quantified by MultiGauge (Fujifilm). Total RNA of normal bladder was used as the normal counterpart of primary tumors. The horizontal axis shows the relative ratio of KLK for the normal counterpart. (b) We compared the expression levels of KLK5, ‐6, ‐8 and ‐9 in superficial tumors with those in invasive tumors using a non‐parametric Mann–Whitney U‐test. Median values are indicated with horizontal bars in the boxes. The vertical bars indicate the range and the horizontal boundaries of the boxes represent the first and third quartiles.
Table 1.
Correlation between KLK expression and clinicopathological characteristics of bladder carcinoma patients
| KLK5 expression | KLK6 expression | KLK8 expression | KLK9 expression | |||||||||
|---|---|---|---|---|---|---|---|---|---|---|---|---|
| Positive | Negative | P‐value | Positive | Negative | P‐value | Positive | Negative | P‐value | Positive | Negative | P‐value | |
| Total number (%) | 6 (14.3%) | 36 (85.7%) | 1 (2.4%) | 41 (97.6%) | 3 (7.1%) | 39 (92.9%) | 8 (19.0%) | 34 (81.0%) | ||||
| Age median (years) (range) | 74.5 (56–80) | 70.0 (30–86) | 78.0 | 70.0 (30–86) | 61.0 (56–78) | 71.0 (30–86) | 72.0 (56–78) | 69.5 (30–86) | ||||
| Sex | ||||||||||||
| Male | 6 | 26 | 0.3076 | 1 | 31 | >0.9999 | 3 | 29 | >0.9999 | 7 | 25 | 0.6545 |
| Female | 0 | 10 | 0 | 10 | 0 | 10 | 1 | 9 | ||||
| T classification | 0 | 10 | 0.0023 | 0 | 10 | 0.4400 | 0 | 10 | 0.3274 | 0 | 10 | 0.2788 |
| pTa | ||||||||||||
| pT1 | 0 | 13 | 0 | 13 | 1 | 12 | 2 | 11 | ||||
| pT2 | 1 | 8 | 0 | 9 | 0 | 9 | 3 | 6 | ||||
| pT3 | 4 | 5 | 1 | 8 | 2 | 7 | 3 | 6 | ||||
| pT4 | 1 | 0 | 0 | 1 | 0 | 1 | 0 | 1 | ||||
| pTa–pT1 | 0 | 23 | 0.0052 | 0 | 23 | 0.4524 | 1 | 22 | 0.5813 | 2 | 21 | 0.1122 |
| pT2–pT4 | 6 | 13 | 1 | 18 | 2 | 17 | 6 | 13 | ||||
| Grade | ||||||||||||
| G1 | 0 | 2 | 0.0798 | 0 | 2 | 0.2779 | 0 | 2 | 0.9142 | 0 | 2 | 0.7343 |
| G2 | 2 | 26 | 0 | 28 | 2 | 26 | 6 | 22 | ||||
| G3 | 4 | 8 | 1 | 11 | 1 | 11 | 2 | 10 | ||||
| G1–G2 | 2 | 28 | 0.0458 | 0 | 30 | 0.2857 | 2 | 28 | >0.9999 | 6 | 24 | >0.9999 |
| G3 | 4 | 8 | 1 | 11 | 1 | 11 | 2 | 10 | ||||
| Initial/recurrence | ||||||||||||
| Initial | 5 | 31 | >0.9999 | 1 | 35 | >0.9999 | 3 | 33 | >0.9999 | 6 | 30 | 0.3193 |
| Recurrence | 1 | 5 | 0 | 6 | 0 | 6 | 2 | 4 | ||||
Discussion
Genome‐wide screening of DNA copy number aberrations, especially high‐level amplifications and homozygous deletions, that could be landmarks of oncogenes and tumor‐suppressor genes, respectively, in cancer cell genomes is a tremendously efficacious way to identify novel genes contributing to the development and progression of cancers. In the present study, we applied our in‐house MCG Whole Genome Array‐4500, covering the entire human genome with a total of 4523 BAC, and a MCG Cancer Array‐800, containing 800 clones specifically selected to contain important tumor‐associated genes and loci, to scan the genomic aberrations in a panel of bladder carcinoma cell lines.( 5 ) Based on the results of our array‐CGH analysis in bladder carcinoma cell lines, we focused on chromosomal region 19q13.3, which harbored a high‐level amplification in one of the cell lines, because (i) 19q13 is known to contain a chromosomal fragile site, and (ii) human KLK genes located at 19q13.3 had already been demonstrated to be a rich source of tumor biomarkers.
Fragile sites, especially common fragile sites, are highly unstable genomic regions. Although they are characterized utilizing an in vitro assay of chromosomal decondensation and breakage induced by inhibitors of DNA replication, their apparent in vivo significance is that they predispose chromosomes to breakage and rearrangement, especially in developing cancer cells.( 30 ) It was reported that more than half of the chromosomal rearrangements found in bladder carcinomas were consistent with 77 of 118 common or rare fragile sites recognized in several types of human cancers, and that 55% of these fragile sites coincided with regions containing one or more genes associated with human cancers.( 30 ) In bladder carcinoma, the most striking examples of these genes are the MYC oncogene at FRA8C/8E (8q24.1),( 31 ) and the CDKN2A/p16 tumor suppressor gene at FRA9A (9p21).( 32 ) In our array‐CGH analysis, five loci with high‐level amplifications and three loci with homozygous deletions were consistent with fragile sites. Low‐level gains or losses at these loci were also frequently observed in the cell lines used in this study without high‐level amplifications or homozygous losses. These results strongly support the hypothesis that fragile sites contribute to carcinogenesis and cancer progression at least partly through activation or inactivation of target genes in some populations of bladder carcinomas.
Because the common criterion for a putative amplification target is that the amplification leads to consistent overexpression,( 33 ) we compared the expression level of each positional candidate gene mapped to the SRO at 19q13.3 in bladder carcinoma cell lines. Overexpression of KLK5, ‐6, ‐8 and ‐9 was observed in three cell lines with copy number gains, which prompted us to focus on these four KLK genes as candidates for amplification at 19q13.3. Some KLK genes have been studied in terms of their diagnostic and prognostic value in prostate, breast and ovarian cancers.( 11 , 14 ) However, the genetic alterations, overexpression and clinicopathological significance of KLK have never been reported in bladder carcinoma. Although a RT‐PCR‐based analysis with a panel of 42 primary bladder carcinoma cases (pTa, pT1, 23 cases; pT2–pT4, 19 cases) demonstrated that the frequency of KLK5 expression alone was significantly higher in invasive tumors (pT2–pT4) (14.3%, 6/42) than in superficial tumors (pTa, pT1) (0%, 0/42) (P = 0.0052, Fisher's exact test), expression levels of KLK5, ‐6, ‐8 and ‐9 mRNA were markedly increased in invasive tumors compared with superficial tumors (P < 0.0001, P = 0.0043, P = 0.0790 and P = 0.0037, respectively, Mann–Whitney U‐test). Our findings clearly indicate KLK5, ‐6, ‐8 and ‐9 to be the most likely targets of 19q13.3 amplification and suggest that they play an important role in the regulation of cancer‐cell migration and invasion. Previously, hK5 in the serum of patients with breast and ovarian cancer was identified as a potential biomarker.( 34 ) Thus, our data also suggest that KLK5 (hK5) might be a novel biomarker of invasive bladder carcinoma.
We detected significant overexpression of KLK5, ‐6, ‐8 and ‐9 in the Ku1 cell line with the 19q13.3 amplification, and these expression levels were much higher than in the ovarian cancer cell line OVCAR‐3, and the gastric cancer cell lines MKN28 and MKN74, which had already been reported to overexpress these KLK, without genetic alterations at 19q13.3.( 15 , 17 ) However, to date, there is no report about amplification of these genes, except for KLK6, which had shown copy number gains in ovarian cancer.( 27 ) Therefore, these findings as well as previous studies led us to speculate that upregulation of KLK expression occurs in a genomic copy number‐dependent manner in each of these genes. However, as we could not detect copy number alterations of KLK genes in the primary tumors, a large‐scale analysis of the genetic alterations and expression of KLK genes is needed to make the relationship clear.
KLK comprise a family of 15 genes encoding secreted serine proteases.( 9 , 10 ) Recently it was reported that KLK6‐downregulated gastric cancer cells lost invasive potential in an in vitro Matrigel invasion assay.( 15 ) In the present study, we successfully demonstrated that KLK5, KLK6, KLK8 and KLK9 gene silencing clearly reduced the invasive activity of bladder cancer cells in vitro. Because hK5, hK6 and hK8 were capable of degrading in vitro the extracellular matrix (ECM), including fibronectin, laminin and type IV collagen,( 12 , 13 , 29 ) our results suggest that hK9, as well as hK5, hK6 and hK8 expressed in bladder cancer cells, might have the capacity to degrade the ECM in Matrigel components.
In summary, we showed KLK5, ‐6, ‐8 and ‐9 to be the most likely targets of the 19q13.3 amplification in bladder carcinomas. This is the first report to present data on the amplification, overexpression and clinicopathological significance of these KLK in bladder carcinoma. Notably, we found a statistically significant association between KLK5 overexpression and invasive potential in an analysis of primary bladder carcinomas. The in vitro and in vivo data strongly suggest KLK (hK) to be potential molecular markers in invasive bladder carcinoma.
Supporting information
The following supplementary material is available for this article:
Fig. S1. The relative copy number of KLK5, ‐6, ‐8 and ‐9 genes in primary bladder tumors detected by a real‐time quantitative polymerase chain reaction. Ku1 is a bladder carcinoma cell line with 19q13.3 amplification. Cases 1, 3, 5, 7, 9, 12, 13 and 17, superficial tumor; cases 24, 25, 29, 33, 34, 35, 38 and 40, invasive tumor; N1‐6, lymphocytes derived from healthy individuals as a normal counterpart. The horizontal axis shows the relative ratio of the copy number of each KLK gene for the normal counterpart.
Table S1. Loci of high‐level amplification (log2 ratio >2.0) detected in bladder carcinoma cell lines by array‐based comparative genomic hybridization analysis using MCG Whole Genome Array‐4500.
Table S2. Loci of homozygous deletion (log2 ratio <2.0) detected in bladder carcinoma cell lines by array‐based comparative genomic hybridization analysis using MCG Whole Genome Array‐4500.
This material is available as part of the online article from: http://www.blackwell‐synergy.com/doi/abs/10.1111/j.1349‐7006.2007.00491.x (This link will take you to the article abstract).
Please note: Blackwell Publishing are not responsible for the content or functionality of any supplementary materials supplied by the authors. Any queries (other than missing material) should be directed to the corresponding author for the article.
Supporting info item
Supporting info item
Supporting info item
Acknowledgments
We are grateful to Professor Yusuke Nakamura (Human Genome Center, Institute of Medical Science, The University of Tokyo) for continuous encouragement throughout this work. We also thank Ayako Takahashi, Yumi Mori and Yukako Morioka for technical assistance. This study was supported in part by grants‐in‐aid for Scientific Research and Scientific Research on Priority Areas, and a 21st Century Center of Excellence Program for Molecular Destruction and Reconstitution of Tooth and Bone from the Ministry of Education, Culture, Sports, Science, and Technology, Japan; and a grant from Core Research for Evolutional Science and Technology of Japan Science and Technology Corporation.
References
- 1. Donat SM. Evaluation and follow‐up strategies for superficial bladder cancer. Urol Clin North Am 2003; 30: 765–76. [DOI] [PubMed] [Google Scholar]
- 2. Von Der Maase H, Sengelov L, Roberts JT et al . Long‐term survival results of a randomized trial comparing gemcitabine plus cisplatin, with methotrexate, vinblastine, doxorubicin, plus cisplatin in patients with bladder cancer. J Clin Oncol 2005; 23: 4602–8. [DOI] [PubMed] [Google Scholar]
- 3. Veltman JA, Fridlyand J, Pejavar S et al . Array‐based comparative genomic hybridization for genome‐wide screening of DNA copy number in bladder tumors. Cancer Res 2003; 63: 2872–80. [PubMed] [Google Scholar]
- 4. Blaveri E, Brewer JL, Roydasgupta R et al . Bladder cancer stage and outcome by array‐based comparative genomic hybridization. Clin Cancer Res 2005; 11: 7012–22. [DOI] [PubMed] [Google Scholar]
- 5. Inazawa J, Inoue J, Imoto I. Comparative genomic hybridization (CGH)‐arrays pave the way for identification of novel cancer‐related genes. Cancer Sci 2004; 95: 559–63. [DOI] [PMC free article] [PubMed] [Google Scholar]
- 6. Sonoda I, Imoto I, Inoue J et al . Frequent silencing of low density lipoprotein receptor‐related protein 1B (LRP1B) expression by genetic and epigenetic mechanisms in esophageal squamous cell carcinoma. Cancer Res 2004; 64: 3741–7. [DOI] [PubMed] [Google Scholar]
- 7. Izumi H, Inoue J, Yokoi S et al . Frequent silencing of DBC1 is by genetic or epigenetic mechanisms in non‐small cell lung cancers. Hum Mol Genet 2005; 14: 997–1007. [DOI] [PubMed] [Google Scholar]
- 8. Takada H, Imoto I, Tsuda H et al . ADAM23, a possible tumor suppressor gene, is frequently silenced in gastric cancers by homozygous deletion or aberrant promoter hypermethylation. Oncogene 2005; 24: 8051–60. [DOI] [PubMed] [Google Scholar]
- 9. Yousef GM, Diamandis EP. The new human tissue kallikrein gene family: structure, function, and association to disease. Endocr Rev 2001; 22: 184–204. [DOI] [PubMed] [Google Scholar]
- 10. Clements J, Hooper J, Dong Y, Harvey T. The expanded human kallikrein (KLK) gene family: genomic organisation, tissue‐specific expression and potential functions. Biol Chem 2001; 382: 5–14. [DOI] [PubMed] [Google Scholar]
- 11. Borgono CA, Michael IP, Diamandis EP. Human tissue kallikreins: physiologic roles and applications in cancer. Mol Cancer Res 2004; 2: 257–80. [PubMed] [Google Scholar]
- 12. Michael IP, Sotiropoulou G, Pampalakis G et al . Biochemical and enzymatic characterization of human kallikrein 5 (hK5), a novel serine protease potentially involved in cancer progression. J Biol Chem 2005; 280: 14 628–35. [DOI] [PubMed] [Google Scholar]
- 13. Rajapakse S, Ogiwara K, Takano N, Moriyama A, Takahashi T. Biochemical characterization of human kallikrein 8 and its possible involvement in the degradation of extracellular matrix proteins. FEBS Lett 2005; 579: 6879–84. [DOI] [PubMed] [Google Scholar]
- 14. Obiezu CV, Diamandis EP. Human tissue kallikrein gene family: applications in cancer. Cancer Lett 2005; 224: 1–22. [DOI] [PubMed] [Google Scholar]
- 15. Nagahara H, Mimori K, Utsunomiya T et al . Clinicopathologic and biological significance of kallikrein 6 overexpression in human gastric cancer. Clin Cancer Res 2005; 11: 6800–6. [DOI] [PubMed] [Google Scholar]
- 16. Fukuda Y, Kurihara N, Imoto I et al . CD44 is a potential target of amplification within the 11p13 amplicon detected in gastric cancer cell lines. Genes Chromosomes Cancer 2000; 29: 315–24. [DOI] [PubMed] [Google Scholar]
- 17. Harvey TJ, Hooper JD, Myers SA, Stephenson SA, Ashworth LK, Clements JA. Tissue‐specific expression patterns and fine mapping of the human kallikrein (KLK) locus on proximal 19q13.4. J Biol Chem 2000; 275: 37 397–406. [DOI] [PubMed] [Google Scholar]
- 18. Yousef GM, Scorilas A, Katsaros D et al . Prognostic value of the human kallikrein gene 15 expression in ovarian cancer. J Clin Oncol 2003; 21: 3119–26. [DOI] [PubMed] [Google Scholar]
- 19. Hurst CD, Fiegler H, Carr P, Williams S, Carter NP, Knowles MA. High‐resolution analysis of genomic copy number alterations in bladder cancer by microarray‐based comparative genomic hybridization. Oncogene 2004; 23: 2250–63. [DOI] [PubMed] [Google Scholar]
- 20. Baffa R, Gomella LG, Vecchione A et al . Loss of FHIT expression in transitional cell carcinoma of the urinary bladder. Am J Pathol 2000; 156: 419–24. [DOI] [PMC free article] [PubMed] [Google Scholar]
- 21. Bringuier PP, Tamimi Y, Schuuring E, Schalken J. Expression of cyclin D1 and EMS1 in bladder tumours: relationship with chromosome 11q13 amplification. Oncogene 1996; 12: 1747–53. [PubMed] [Google Scholar]
- 22. Shimoyama Y, Gotoh M, Terasaki T, Kitajima M, Hirohashi S. Isolation and sequence analysis of human cadherin‐6 complementary DNA for the full coding sequence and its expression in human carcinoma cells. Cancer Res 1995; 55: 2206–11. [PubMed] [Google Scholar]
- 23. Galang CK, Muller WJ, Foos G, Oshima RG, Hauser CA. Changes in the expression of many Ets family transcription factors and of potential target genes in normal mammary tissue and tumors. J Biol Chem 2004; 279: 11 281–92. [DOI] [PubMed] [Google Scholar]
- 24. Chaib H, Rubin MA, Mucci NR et al . Activated in prostate cancer: a PDZ domain‐containing protein highly expressed in human primary prostate tumors. Cancer Res 2001; 61: 2390–4. [PubMed] [Google Scholar]
- 25. Stamey TA, Yang N, Hay AR, McNeal JE, Freiha FS, Redwine E. Prostate‐specific antigen as a serum marker for adenocarcinoma of the prostate. N Engl J Med 1987; 317: 909–16. [DOI] [PubMed] [Google Scholar]
- 26. McCormack RT, Rittenhouse HG, Finlay JA et al . Molecular forms of prostate‐specific antigen and the human kallikrein gene family: a new era. Urology 1995; 45: 729–44. [DOI] [PubMed] [Google Scholar]
- 27. Ni X, Zhang W, Huang KC et al . Characterisation of human kallikrein 6/protease M expression in ovarian cancer. Br J Cancer 2004; 91: 725–31. [DOI] [PMC free article] [PubMed] [Google Scholar]
- 28. Borgono CA, Diamandis EP. The emerging roles of human tissue kallikreins in cancer. Nat Rev Cancer 2004; 4: 876–90. [DOI] [PubMed] [Google Scholar]
- 29. Magklara A, Mellati AA, Wasney GA et al . Characterization of the enzymatic activity of human kallikrein 6: Autoactivation, substrate specificity, and regulation by inhibitors. Biochem Biophys Res Commun 2003; 307: 948–55. [DOI] [PubMed] [Google Scholar]
- 30. Moriarty HT, Webster LR. Fragile sites and bladder cancer. Cancer Genet Cytogenet 2003; 140: 89–98. [DOI] [PubMed] [Google Scholar]
- 31. Zaharieva B, Simon R, Ruiz C et al . High‐throughput tissue microarray analysis of CMYC amplificationin urinary bladder cancer. Int J Cancer 2005; 117: 952–6. [DOI] [PubMed] [Google Scholar]
- 32. Chapman EJ, Harnden P, Chambers P, Johnston C, Knowles MA. Comprehensive analysis of CDKN2A status in microdissected urothelial cell carcinoma reveals potential haploinsufficiency, a high frequency of homozygous co‐deletion and associations with clinical phenotype. Clin Cancer Res 2005; 11: 5740–7. [DOI] [PubMed] [Google Scholar]
- 33. Imoto I, Yang ZQ, Pimkhaokham A et al . Identification of cIAP1 as a candidate target gene within an amplicon at 11q22 in esophageal squamous cell carcinomas. Cancer Res 2001; 61: 6629–34. [PubMed] [Google Scholar]
- 34. Yousef GM, Polymeris ME, Grass L et al . Human kallikrein 5: a potential novel serum biomarker for breast and ovarian cancer. Cancer Res 2003; 63: 3958–65. [PubMed] [Google Scholar]
Associated Data
This section collects any data citations, data availability statements, or supplementary materials included in this article.
Supplementary Materials
The following supplementary material is available for this article:
Fig. S1. The relative copy number of KLK5, ‐6, ‐8 and ‐9 genes in primary bladder tumors detected by a real‐time quantitative polymerase chain reaction. Ku1 is a bladder carcinoma cell line with 19q13.3 amplification. Cases 1, 3, 5, 7, 9, 12, 13 and 17, superficial tumor; cases 24, 25, 29, 33, 34, 35, 38 and 40, invasive tumor; N1‐6, lymphocytes derived from healthy individuals as a normal counterpart. The horizontal axis shows the relative ratio of the copy number of each KLK gene for the normal counterpart.
Table S1. Loci of high‐level amplification (log2 ratio >2.0) detected in bladder carcinoma cell lines by array‐based comparative genomic hybridization analysis using MCG Whole Genome Array‐4500.
Table S2. Loci of homozygous deletion (log2 ratio <2.0) detected in bladder carcinoma cell lines by array‐based comparative genomic hybridization analysis using MCG Whole Genome Array‐4500.
This material is available as part of the online article from: http://www.blackwell‐synergy.com/doi/abs/10.1111/j.1349‐7006.2007.00491.x (This link will take you to the article abstract).
Please note: Blackwell Publishing are not responsible for the content or functionality of any supplementary materials supplied by the authors. Any queries (other than missing material) should be directed to the corresponding author for the article.
Supporting info item
Supporting info item
Supporting info item