

Abstract
Glioblastoma multiforme (GBM) is the most frequently occurring primary malignant brain tumor; patients with GBM often have a very poor prognosis and differing responses to treatment. Therefore, it is very important to find new biomarkers that can predict clinical outcomes and help in treatment decisions. MicroRNAs are small, non‐coding RNAs that function as post‐transcriptional regulators of gene expression and play a key role in the pathogenesis of GBM. In a group of 38 patients with primary GBM, we analyzed the expression of eight microRNAs (miR‐21, miR‐128a, miR‐181c, miR‐195, miR‐196a, miR‐196b, miR‐221, and miR‐222). In addition, we examined the methylation status of O‐6‐methylguanine‐DNA methyltransferase (MGMT) promoter by high‐resolution melting analysis, as this has been shown to be a predictive marker in GBM. MGMT methylation status correlated with progression‐free survival (P = 0.0201; log–rank test) as well as with overall survival (P = 0.0054; log–rank test). MiR‐195 (P = 0.0124; log–rank test) and miR‐196b (P = 0.0492; log–rank test) positively correlated with overall survival. Evaluation of miR‐181c in combination with miR‐21 predicted time to progression within 6 months of diagnosis with 92% sensitivity and 81% specificity (P < 0.0001). Our data confirmed that the methylation status of MGMT but also miR‐21, miR‐181c, miR‐195, and miR‐196b to be associated with survival of GBM patients. Above all, we suggest that the combination of miR‐181c and miR‐21 could be a very sensitive and specific test to identify patients at high risk of early progression after surgery. (Cancer Sci 2011; 102: 2186–2190)
Glioblastoma multiforme (GBM) is the most frequently occurring primary malignant brain tumor of astrocytic origin.( 1 ) Despite the introduction of modern therapeutic approaches, this cancer remains generally associated with very poor prognosis.( 2 ) A significant benefit of overall survival (OS) has been achieved in patients treated with concomitant chemoradiotherapy with temozolomide (RT/TMZ), an alkylating agent. However, not all patients are sensitive to this therapy.( 3 , 4 ) Because of an extremely short median survival time of glioblastoma patients and diversity in therapy response, it is very important to identify new biomarkers that can be used in prognosis and prediction of therapeutic response and/or clinical outcome in GBM patients in order to rationalize treatment decisions.
MicroRNAs (miRNAs) are highly conserved, small, non‐coding RNAs, 18–25 nucleotides in length, that function as post‐transcriptional regulators of gene expression by silencing their mRNA targets. Bioinformatics tools estimate that miRNAs regulate up to one‐third of human genes including a significant number of oncogenes, tumor suppressor genes, and genes associated with the invasion, dissemination, and chemoresistance of tumors.( 5 ) Therefore, these molecules play significant roles in the pathogenesis of many cancers, including GBM.( 6 , 7 ) In the context of this tumor, recent published reports have proposed that some miRNAs that could be used to predict disease outcome and therapy response. As we previously described, miR‐21, miR‐128a, miR‐181b, miR‐181c, miR‐221, and miR‐222 were significantly altered in glioblastomas. Moreover, miR‐181b and miR‐181c were significantly downregulated in patients who responded to RT/TMZ compared to patients with progressive disease.( 8 ) In another study, miR‐195, miR‐455‐3p, and miR‐10a* were the most upregulated miRNAs in TMZ‐resistant cell lines.( 9 ) MiR‐196a and miR‐196b expression levels are increased in glioblastomas relative to both anaplastic astrocytomas and normal brain tissues. Furthermore, patients with high miR‐196 expression levels showed significantly poorer OS.( 10 )
Another frequently studied predictive marker in GBM is the O‐6‐methylguanine‐DNA methyltransferase (MGMT).( 11 ) This protein with DNA repair activity removes mutagenic O‐6‐alkyl‐guanine induced by alkylating agents. Therefore, MGMT partially contributes to alkylating chemotherapy resistance, and epigenetic silencing of the MGMT gene by a promoter methylation has been shown to be an independent predictor of prognosis and response to RT/TMZ and adjuvant TMZ treatment of GBM patients.( 12 , 13 , 14 )
The aims of this study were to quantify expression levels of eight miRNAs (miR‐21, miR‐128a, miR‐181c, miR‐195, miR‐196a, miR‐196b, miR‐221, and miR‐222) that have been previously described as associated with GBM pathogenesis in the clinical samples, and to determine the methylation status of MGMT gene promoter. The results were correlated to clinical data in order to obtain prognostic and predictive biomarkers for GBM patients treated with RT/TMZ and adjuvant TMZ.
Materials and Methods
Patients and treatment. The retrospective study included 38 patients with primary glioblastomas who were resected at the Department of Neurosurgery (University Hospital Brno, Brno, Czech Republic). After resection, patients underwent adjuvant therapy at the Masaryk Memorial Cancer Institute (Brno, Czech Republic) according to the standard Stupp protocol: radiotherapy (2 Gy per fraction for 6 weeks, total dose of 60 Gy) plus concomitant chemotherapy with RT/TMZ at 75 mg/m2 daily, for 6 weeks. Nineteen patients received an adjuvant treatment with temozolomide (150–200 mg/m2 for 5 days in 4‐week cycles) (Table 1). Informed consent approved by the local Ethical Commission was obtained from each patient before the treatment. Clinical data were retrieved from the hospital’s patient records.
Table 1.
Characteristics of patients with glioblastoma multiforme who participated in this study (n = 38)
| Total n = 38 | % | |
|---|---|---|
| Age (years) | ||
| ≤50 | 14 | 37 |
| >50 | 24 | 63 |
| Median (range) | 53 (28–67) | |
| Gender | ||
| Male | 19 | 50 |
| Female | 19 | 50 |
| ECOG performance status | ||
| 0 and 1 | 36 | 95 |
| 2 | 2 | 5 |
| Extent of resection | ||
| Total | 9 | 24 |
| Subtotal | 29 | 76 |
Tissue sample preparation and nucleic acid extraction. The 38 tumor samples were obtained from surgically resected glioblastomas. As a control, six non‐tumor samples of adult brain tissue were taken from areas surrounding arteriovenous malformations (AVM) and four commercially available RNAs from adult brain tissues (540005, total brain; 540117, frontal cortex; 540137, occipital cortex; 540135, striatum; Agilent‐Stratagene, Santa Clara, CA, USA). Glioblastoma clinical samples were evaluated by two experienced neuropathologists. For subsequent analysis were used dissected formalin‐fixed paraffin‐embedded (FFPE) samples containing more than 90% tumor tissue. Small RNA‐enriched total RNA was isolated using mirVana miRNA Isolation Kit (Ambion, Austin, TX, USA). DNA was extracted using the QIAamp DNA FFPE Tissue Kit (Qiagen, Hilden, Germany). Nucleic acid concentration and purity were controlled by UV spectrophotometry (A260:A280 > 2.0; A260:A230 > 1.8) using Nanodrop ND‐1000 (Thermo Fisher Scientific, Waltham, MA, USA).
Real‐time quantification of miRNAs by stem‐loop RT‐PCR. Complementary DNA was synthesized from 10 ng small RNA‐enriched total RNA using gene‐specific primers and TaqMan MicroRNA Reverse Transcription kit according to the TaqMan MicroRNA Assay protocol (Applied Biosystems, Foster City, CA, USA). Real‐Time PCR was carried out using the Applied Biosystems 7500 Real‐Time PCR System in accordance with the TaqMan MicroRNA Assay protocol. The threshold cycle data were determined using the default threshold settings. All real‐time PCR reactions were run in triplicate and average Ct and SD values were calculated.
Bisulfite conversion of DNA and high‐resolution melting (HRM) analysis of MGMT promoter. Bisulfite conversion was carried out using the EpiTect Bisulfite Kit (Qiagen) with 1000 ng DNA per reaction. High‐resolution melting was carried out on the LightCycler 480 (Roche, Mannheim, Germany) using a LightCycler 480 High Resolution Melting Master kit (Roche) with 30 ng bisulfite converted DNA on each reaction, 4 nM Mg2+, and previously described primers MGMT MS‐HRM2.( 15 ) CpGenome Universal Methylated DNA and CpGenome Universal Unmethylated DNA set (Millipore, Darmstadt, Germany) were used for dilution of standard samples (0, 10, 25, 50, 75, 90, and 100% methylated DNA). All HRM reactions were run in triplicate.
Statistical analysis. Expression data were normalized according to the expression of RNU6B (Assay no. 4373381; Applied Biosystems). Statistical analysis of differences between miRNA levels in glioblastomas and non‐tumor adult brain tissues, and differences in therapy response and time to progression in relation to miRNA levels, were evaluated using the non‐parametric Mann–Whitney U‐test between two groups. Survival analyses were carried out by the Kaplan–Meier method and significance was calculated by the log–rank test. Sensitivity and specificity were evaluated and significance of the patient stratification according to a particular miRNA marker was assessed by Fischer’s exact test. For all calculations we used MedCalc version 11.4.2.0 (MedCalc Software, Mariakerke, Belgium).
Results
Methylation status of MGMT promoter. Twenty‐five percentage methylation status of MGMT promoter was used as cut‐off for stratification of GBM patients into (un)methylated groups. The MGMT promoter was unmethylated in 26 cases (68%) and methylated in 12 cases (32%) (Table 2). In patients with methylated promoter of the MGMT gene, there was an observed benefit in OS (hazard ratio [HR] 0.4012; 95% confidence interval [CI] 0.2068–0.7783; P = 0.0054, log‐rank test) as well as in progression‐free survival (HR 0.4799; 95% CI 0.2516–0.9153; P = 0.0201, log–rank test) (Fig. 1). The MGMT methylation status was not associated with any of the miRNA expression levels analyzed in this study (Table 3).
Table 2.
Characteristics of patients with glioblastoma multiforme (n = 38), based on methylguanine‐DNA methyltransferase methylation status
| Promoter status | ||
|---|---|---|
| Unmethylated | Methylated | |
| No. of patients | 26 (68%) | 12 (32%) |
| Progression‐free survival | ||
| Median duration (months) | 8.0 (3.0–24.0) | 14.5 (3.0–27.0) |
| Rate at 6 months (%) | 61.5 | 83.3 |
| Overall survival | ||
| Median duration (months) | 13.0 (3.0–33.0) | 22.5 (6.0–62.0) |
| Rate at 24 months (%) | 11.5 | 58.3 |
Figure 1.
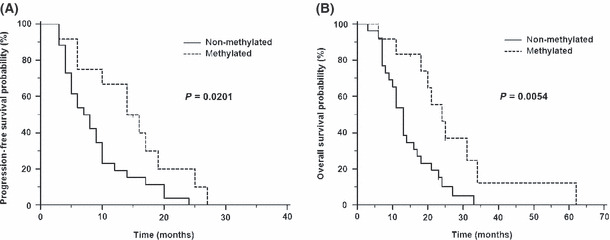
Kaplan–Meier survival curves estimating progression‐free survival (A) and overall survival (B) in patients with glioblastoma multiforme, according to methylguanine‐DNA methyltransferase promoter methylation status.
Table 3.
Comparison of normalized microRNA expression levels in glioblastoma multiforme and non‐tumor brain tissues and their association with methylation status of methylguanine‐DNA methyltransferase (MGMT) promoter
| MicroRNA | Glioblastoma n = 38 | Non‐tumor brain tissue† n = 10 | Fold change | P‐value‡ | MGMT association§ (P) |
|---|---|---|---|---|---|
| miR‐21 | 78.5814¶ (33.1469–237.7333) | 22.7989 (19.2862–30.8386) | 3.45 | 0.02550 | 0.4142 |
| miR‐128a | 0.01534 (0.005892–0.05036) | 1.1798 (0.7614–7.7713) | 0.01 | <0.0001 | 0.8494 |
| miR‐181c | 0.4805 (0.1345–0.9141) | 2.2363 (0.6974–3.1595) | 0.21 | 0.0005 | 0.4232 |
| miR‐195 | 5.4032 (0.8845–33.2029) | 38.5964 (17.8927–46.8118) | 0.14 | 0.0290 | 0.2928 |
| miR‐196a | 0.14790 (0.06040–0.7335) | 0.01511 (0.00022–0.04707) | 9.79 | 0.0021 | 0.2573 |
| miR‐196b | 0.09182 (0.01690–0.57340) | 0.01978 (0.00022–0.11020) | 4.64 | 0.0330 | 0.4795 |
| miR‐221 | 2.3737 (1.0943–6.7427) | 23.2871 (8.2249–67.7547) | 0.10 | 0.0001 | 0.9749 |
| miR‐222 | 7.0326 (3.2716–14.4534) | 46.1839 (18.2944–99.2503) | 0.15 | 0.0010 | 0.1092 |
†Non‐tumor brain tissue from arteriovenous malformation surgeries (×6) and commercially available adult brain RNAs (×4). ‡Mann–Whitney U‐test (bold indicates significance at P < 0.05). §Association with methylation status of MGMT promoter (Mann–Whitney U‐test). ¶Median of expression level related to RNU6B with 25th and 75th percentiles.
Comparison of miRNA expression levels in GBM tissues and non‐tumor brain tissue samples. Medians of relative expression levels of all examined miRNAs with their 25th and 75th percentile ranges, GBM samples and non‐tumor brain tissue samples, as well as P‐values indicating statistical significance of differences, are summarized in Table 3. Our data indicated significant overexpression of miR‐21 and miR‐196a/b in GBM samples compared to control non‐malignant brain tissues, and downregulation of miR‐181c, miR‐221, miR‐222, miR‐195, and miR‐128a. Of these, miR‐128a showed the most significant change (P < 0.0001).
Correlation of miRNA expression levels with prognosis and prediction of response to RT/TMZ treatment in GBM patients. Higher levels of miR‐195 (HR 0.4249; 95% CI 0.2167–0.8332; P = 0.0124, log‐rank test) and miR‐196b (HR 0.5470; 95% CI 0.2776–1.0776; P = 0.0492, log–rank test) expression have been significantly associated with longer OS of GBM patients. For these analyses, the 75th percentile range and median of relative expression levels have been used as cut‐offs for miR‐195 and miR‐196b, respectively (Fig. 2). Significantly higher miR‐181c expression levels were observed in the group of patients with time to progression shorter than 6 months (TPP6) (P = 0.0010, Mann–Whitney U‐test) (Fig. 3A). Identically, miR‐21 was significantly upregulated in this high risk group of patients (P = 0.0143, Mann–Whitney U‐test) (Fig. 3B). Analysis of the miR‐181c in combination with miR‐21 (cut‐offs were median and 25th percentile, respectively) predicted significantly TPP6 (sensitivity = 92%, specificity = 81%, P < 0.0001; see Table 4). However, neither prognostic nor predictive associations were found for miR‐128a, miR‐196a, miR‐221, or miR‐222.
Figure 2.

Kaplan–Meier survival curves estimating overall survival in patients with glioblastoma multiforme, according to miR‐195 (A) and miR‐196b (B) expression levels.
Figure 3.
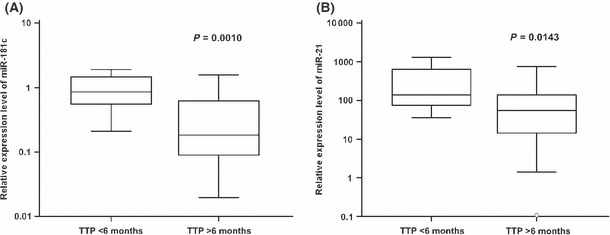
Time to progression (TTP) up to 6 months in patients with glioblastoma multiforme, based on miR‐181c (A) and miR‐21 (B) expression levels. Central box represents values from the lower to upper quartiles (25th to 75th percentiles), and the middle line represents the median (Mann–Whitney U‐test). Vertical line extends from minimum to maximum values.
Table 4.
Contingency table of glioblastoma patients stratified according to time to progression (TTP) and miR‐21/miR‐181c positivity
| No. of patients with TTP > 6 months | No. of patients with TTP < 6 months | |
|---|---|---|
| miR‐21 and miR‐181c positivity | 5 | 11 |
| miR‐21 and/or miR‐181c negativity | 21 | 1 |
Discussion
In this study, we have confirmed the impact of MGMT promoter methylation status on the favorable outcome after RT/TMZ therapy in GBM patients. Patients with MGMT promoter hypermethylation in >25% tumor DNA showed significantly longer OS as well as progression‐free survival. These observations fully correlate with the results of many authors.( 12 , 16 , 17 , 18 ) The percentage of MGMT methylated samples has been smaller in our cohort (32%) than in other studies, where it ranged from 35% to 47%.( 8 , 12 , 17 ) However, we analyzed MGMT methylation status using the HRM method, which is a more suitable approach for methylation analysis in routine practice compared to methylation‐specific PCR, used in most of the other published studies, which can easily generate PCR false‐positive results.
There are several reports that discuss the use of miRNAs as potential predictive and prognostic factors in GBM.( 6 ) In this study, we analyzed the expression of eight miRNAs in primary GBM and we correlated the obtained data with clinical characteristics of GBM patients. In concordance with Guan et al.,( 10 ) we observed significantly lower levels of miR‐196a,b in normal brain compared to glioblastoma tissue. This group also described a significant correlation between higher expression of miR‐196a,b with poor survival in a group of GBM and anaplastic astrocytoma patients.( 10 ) Another study described miR‐195 as one of the most upregulated miRNAs in TMZ‐resistant GBM cell lines, and their knockdown led to reversal of TMZ resistance and increased cytotoxicity of TMZ.( 9 ) Accordingly, we expected a negative correlation between miR‐195 and miR‐196a,b expression and OS. However, our analyses suggest that there is more likely an opposite association between miR‐195 and miR‐196b and OS in GBM patients, which is in agreement with several other reports in colorectal, hepatocellular, and adrenocortical cancers.( 19 , 20 , 21 , 22 ) The number of GBM patients in Guan’s study was 39, which is comparable to the size of our group. Larger studies need to be carried out to establish the prognostic significance of miR‐196b in glioblastoma. Interestingly, miR‐196a showed no significance in OS in our study.
The miR‐181 family has many predicted targets and some of these have been verified by in vitro functional analysis (HOXA11, TCL1, TGFBR1, and MAPK1).( 8 ) Therefore, it is a robust translational regulator and can mediate a number of genes in response to an acute cellular stress caused by a drug treatment or radiation. In this study, we have shown that higher levels of miR‐181c is significantly associated with disease progression within 6 months. In fact, we confirmed results from our previous pilot study where we described positive correlation between lower miR‐181c levels and the response to RT/TMZ in GBM.( 8 ) We did not observe an association between MGMT methylation status and miR‐181c levels, nor with any other examined miRNAs. Our study also confirmed the upregulation of miR‐21 in glioblastoma tissue, noted previously by others.( 8 , 23 , 24 , 25 , 26 ) MiR‐21 is the most frequently explored miRNA in GBM, and it has been found to act as an oncogene. It is evident that this molecule influences multiple important components of oncogenic signaling pathways.( 6 ) Similar to miR‐181c, we found that higher expression of miR‐21 is associated with early progression. Moreover, the combination of miR‐181c and miR‐21 predicted progression within 6 months with 92% sensitivity and 81% specificity. This study also partially confirmed the downregulation of miR‐221 and miR‐222, described in our previous publication.( 8 ) In the current study, significant downregulation of miR‐221, and a similar trend for miR‐222, were observed. However, results from both of our studies conflict with another report showing miR‐221 and miR‐222 as overexpressed in primary GBM.( 23 ) In our study, we combined tissue from AVM surgeries and commercially available RNAs from adult brain tissue as the control group. The miRNA expression changes tended to have identical trends in total RNA from AVM samples and commercially available adult brain RNAs, therefore, we integrated them together in further statistical analyses. In the study by Ciafre et al.,( 23 ) which reported opposite changes in miR‐221/222 expression levels, peripheral tissue of glioblastomas were used as the control tissue. We suggest that this is not an ideal control tissue, and could partially explain the contradiction in results. Our data did not indicate the potential of miR‐221/222 for survival prediction in GBM patients, as observed by Srinivasan et al. ( 27 )
In conclusion, we have verified two previous reports describing miR‐128a deregulation in GBM compared to non‐tumor adult brain tissue.( 8 , 23 ) Interestingly, this miRNA showed approximately 50‐fold higher expression in non‐tumor brain tissue than in GBM (P < 0.0001), suggesting its role in glioblastoma pathogenesis. Both miR‐195 and miR‐196b demonstrated prognostic significance, showing a positive correlation with OS. We suggest that the combination of miR‐181c and miR‐21 expression levels is a highly sensitive and specific indicator for identification of early progressing (high risk) patients, who would require specific attention, in order to improve their survival, through the use of more intensive therapy immediately after surgery. This fact is all the more important when bevacizumab is introduced for glioblastoma patients and evaluated in clinical trials combined with concomitant chemoradiotherapy.
Disclosure Statement
The authors have no conflict of interest.
Acknowledgements
This work was supported by grants IGA NT/11214‐4/2010 and IGA NR 9875‐4 from the Czech Ministry of Health (project no. MZ0MOU2005) and by the project CEITEC – Central European Institute of Technology (CZ.1.05/1.1.00/02.0068) from the European Regional Development Fund. The infrastructure of this project (Institute of Molecular and Translational Medicine) was supported by the Operational Program Research and Development for Innovations (project CZ.1.05/2.1.00/01.0030 and project CZ.1.07/2.4.00/17.0100).
References
- 1. Schwartzbaum JA, Fisher JL, Aldape KD et al. Epidemiology and molecular pathology of glioma. Nat Clin Pract Neurol 2006; 2: 494–503; quiz 1 p following 16. [DOI] [PubMed] [Google Scholar]
- 2. Ohgaki H, Dessen P, Jourde B et al. Genetic pathways to glioblastoma: a population‐based study. Cancer Res 2004; 64: 6892–9. [DOI] [PubMed] [Google Scholar]
- 3. Stupp R, Mason WP, van den Bent MJ et al. Radiotherapy plus concomitant and adjuvant temozolomide for glioblastoma. N Engl J Med 2005; 352: 987–96. [DOI] [PubMed] [Google Scholar]
- 4. Stupp R, Hegi ME, Mason WP et al. Effects of radiotherapy with concomitant and adjuvant temozolomide versus radiotherapy alone on survival in glioblastoma in a randomised phase III study: 5‐year analysis of the EORTC‐NCIC trial. Lancet Oncol 2009; 10: 459–66. [DOI] [PubMed] [Google Scholar]
- 5. Esquela‐Kerscher A, Slack FJ. Oncomirs – microRNAs with a role in cancer. Nat Rev Cancer 2006; 6: 259–69. [DOI] [PubMed] [Google Scholar]
- 6. Sana J, Hajduch M, Michalek J et al. MicroRNAs and glioblastoma: roles in core signaling pathways and potential clinical implications. J Cell Mol Med 2011; 15: 1636–44. [DOI] [PMC free article] [PubMed] [Google Scholar]
- 7. Novakova J, Slaby O, Vyzula R et al. MicroRNA involvement in glioblastoma pathogenesis. Biochem Biophys Res Commun 2009; 386: 1–5. [DOI] [PubMed] [Google Scholar]
- 8. Slaby O, Lakomy R, Fadrus P et al. MicroRNA‐181 family predicts response to concomitant chemoradiotherapy with temozolomide in glioblastoma patients. Neoplasma 2010; 57: 264–9. [DOI] [PubMed] [Google Scholar]
- 9. Ujifuku K, Mitsutake N, Takakura S et al. miR‐195, miR‐455‐3p and miR‐10a(*) are implicated in acquired temozolomide resistance in glioblastoma multiforme cells. Cancer Lett 2010; 296: 241–8. [DOI] [PubMed] [Google Scholar]
- 10. Guan Y, Mizoguchi M, Yoshimoto K et al. MiRNA‐196 is upregulated in glioblastoma but not in anaplastic astrocytoma and has prognostic significance. Clin Cancer Res 2010; 16: 4289–97. [DOI] [PubMed] [Google Scholar]
- 11. Hegi ME, Liu L, Herman JG et al. Correlation of O6‐methylguanine methyltransferase (MGMT) promoter methylation with clinical outcomes in glioblastoma and clinical strategies to modulate MGMT activity. J Clin Oncol 2008; 26: 4189–99. [DOI] [PubMed] [Google Scholar]
- 12. Brandes AA, Franceschi E, Tosoni A et al. MGMT promoter methylation status can predict the incidence and outcome of pseudoprogression after concomitant radiochemotherapy in newly diagnosed glioblastoma patients. J Clin Oncol 2008; 26: 2192–7. [DOI] [PubMed] [Google Scholar]
- 13. Sadones J, Michotte A, Veld P et al. MGMT promoter hypermethylation correlates with a survival benefit from temozolomide in patients with recurrent anaplastic astrocytoma but not glioblastoma. Eur J Cancer 2009; 45: 146–53. [DOI] [PubMed] [Google Scholar]
- 14. Blanc JL, Wager M, Guilhot J et al. Correlation of clinical features and methylation status of MGMT gene promoter in glioblastomas. J Neurooncol 2004; 68: 275–83. [DOI] [PubMed] [Google Scholar]
- 15. Wojdacz TK, Dobrovic A. Methylation‐sensitive high resolution melting (MS‐HRM): a new approach for sensitive and high‐throughput assessment of methylation. Nucleic Acids Res 2007; 35: e41. [DOI] [PMC free article] [PubMed] [Google Scholar]
- 16. Hegi ME, Diserens AC, Gorlia T et al. MGMT gene silencing and benefit from temozolomide in glioblastoma. N Engl J Med 2005; 352: 997–1003. [DOI] [PubMed] [Google Scholar]
- 17. Eoli M, Menghi F, Bruzzone MG et al. Methylation of O6‐methylguanine DNA methyltransferase and loss of heterozygosity on 19q and/or 17p are overlapping features of secondary glioblastomas with prolonged survival. Clin Cancer Res 2007; 13: 2606–13. [DOI] [PubMed] [Google Scholar]
- 18. Weller M, Felsberg J, Hartmann C et al. Molecular predictors of progression‐free and overall survival in patients with newly diagnosed glioblastoma: a prospective translational study of the German Glioma Network. J Clin Oncol 2009; 27: 5743–50. [DOI] [PubMed] [Google Scholar]
- 19. Wang X, Wang J, Ma H et al. Downregulation of miR‐195 correlates with lymph node metastasis and poor prognosis in colorectal cancer. Med Oncol 2011; DOI: 10.1007/s12032‐011‐9880‐5 [Epub ahead of print]. [DOI] [PubMed] [Google Scholar]
- 20. Xu T, Zhu Y, Xiong Y et al. MicroRNA‐195 suppresses tumorigenicity and regulates G1/S transition of human hepatocellular carcinoma cells. Hepatology 2009; 50: 113–21. [DOI] [PubMed] [Google Scholar]
- 21. Liu L, Chen L, Xu Y et al. microRNA‐195 promotes apoptosis and suppresses tumorigenicity of human colorectal cancer cells. Biochem Biophys Res Commun 2010; 400: 236–40. [DOI] [PubMed] [Google Scholar]
- 22. Soon PS, Tacon LJ, Gill AJ et al. miR‐195 and miR‐483‐5p Identified as Predictors of Poor Prognosis in Adrenocortical Cancer. Clin Cancer Res 2009; 15: 7684–92. [DOI] [PubMed] [Google Scholar]
- 23. Ciafre SA, Galardi S, Mangiola A et al. Extensive modulation of a set of microRNAs in primary glioblastoma. Biochem Biophys Res Commun 2005; 334: 1351–8. [DOI] [PubMed] [Google Scholar]
- 24. Papagiannakopoulos T, Shapiro A, Kosik KS. MicroRNA‐21 targets a network of key tumor‐suppressive pathways in glioblastoma cells. Cancer Res 2008; 68: 8164–72. [DOI] [PubMed] [Google Scholar]
- 25. Chen Y, Liu W, Chao T et al. MicroRNA‐21 down‐regulates the expression of tumor suppressor PDCD4 in human glioblastoma cell T98G. Cancer Lett 2008; 272: 197–205. [DOI] [PubMed] [Google Scholar]
- 26. Chan JA, Krichevsky AM, Kosik KS. MicroRNA‐21 is an antiapoptotic factor in human glioblastoma cells. Cancer Res 2005; 65: 6029–33. [DOI] [PubMed] [Google Scholar]
- 27. Srinivasan S, Patric IR, Somasundaram K. A ten‐microRNA expression signature predicts survival in glioblastoma. PLoS ONE 2011; 6: e17438. [DOI] [PMC free article] [PubMed] [Google Scholar]