

Abstract
Various dendritic cell subsets are induced from bone marrow cells under different cytokine conditions. We have demonstrated previously that the Th1‐cytokine‐conditioned bone marrow‐derived dendritic cell (BMDC) subset BMDC1 (generated in the presence of granulocyte‐macrophage colony‐stimulating factor [GM‐CSF] + interleukin [IL]‐3 + interferon [IFN]‐γ+ IL‐12) induces a much stronger type 1 immune response than BMDC0 (GM‐CSF + IL‐3). In the present study, we investigated the effect of 1α,25‐dihydroxyvitamine D3 (VitD3), which is a known immunomodulating drug, on the differentiation of BMDC subsets. The addition of VitD3 significantly influenced the functional differentiation of BMDC1 compared with BMDC0. Specifically, the addition of VitD3 greatly decreased the expression levels of MHC class I, CD80, CD40 and leukocyte function‐associated antigen (LFA)‐1 molecules on BMDC1. In addition, VitD3‐treated BMDC1 (VD3‐BMDC1) almost completely lost their immunostimulating activity for inducing type 1 immunity and cytotoxic T lymphocyte generation. A failure in the induction of type 1 immunity by VD3‐BMDC1 appeared to be due to the following: (i) the expression of co‐stimulatory molecules on VD3‐BMDC1 was strongly downmodulated compared with BMDC1 generated without VitD3; and (ii) VD3‐BMDC1 showed significantly lower mRNA expression of IFN‐γ and IFN‐β, factors that are essential for cytotoxic T lymphocyte induction. VitD3 inhibited the differentiation of functionally competent BMDC1 during the early phase of differentiation but not during the late differentiation period. A possible reason for the inhibition of BMDC1 differentiation by VitD3 is reduced phosphorylation of STAT1 during early differentiation. Taken together, VitD3 strongly suppressed T‐cell responses by inhibiting functional differentiation of precursor dendritic cells into functional BMDC1 that are feasible for inducing Th1‐dependent cellular immunity. (Cancer Sci 2006; 97: 139 –147)
Abbreviations:
- BM
bone marrow
- BMDC
bone marrow‐derived dendritic cell
- BMDC0
BMDC subset generated under neutral conditions
- BMDC1
BMDC subset generated from BM cells under Th1‐biasing conditions
- CTL
cytotoxic T lymphocyte
- DC
dendritic cell
- EDTA
ethylenediaminetetracetic acid
- FITC
fluorescein‐isothiocyanate
- GM‐CSF
granulocyte‐macrophage colony‐stimulating factor
- IFN
interferon
- IL
interleukin
- LFA
leukocyte function‐associated antigen
- LPS
lipopolysaccharide
- MLR
mixed lymphocyte reaction
- PE
phycoerythrin
- TGF
transforming growth factor
- RXR
retinoid X receptor
- VDR
vitamin D receptor
- VitD3
1α,25‐dihydroxyvitamin D3.
Dendritic cells play a critical role in both innate and adaptive immunity by producing chemokines and cytokines, and by presenting antigens to antigen‐specific T cells.( 1 , 2 ) Recently, it has been demonstrated that there are functionally different DC subsets. We have reported that a BMDC subset generated from BM cells under Th1‐biasing conditions (BMDC1, induced by GM‐CSF, IL‐3, IL‐12 and IFN‐γ) enhances type 1 immunity to a greater extent than a BMDC subset generated under neutral conditions (BMDC0, induced by GM‐CSF and IL‐3).( 3 ) CD8+ T cells stimulated with allogeneic BMDC1 showed much higher IFN‐γ production and cytotoxic activity than T cells co‐cultured with BMDC0. In addition, vaccination of tumor‐bearing mice with tumor antigen‐pulsed BMDC1 strongly enhanced therapeutic effect by tumor‐antigen‐specific Th1 cells.( 4 ) Moreover, it has also been reported that regulatory DC subset can be induced from mouse BM cells in the presence of suppressive drugs such as IL‐10 and TGF‐β.( 5 , 6 , 7 ) From these findings, it is speculated that heterogeneous DC subsets with quite different functions are generated from BM precursor cells under different culture conditions. Therefore, it is of great importance to investigate the effect of immunomodulating drugs on functional differentiation of BMDC subsets.
1α,25‐Dihydroxyvitamin D3 (the active form of vitamin D3) is a well‐known pro‐hormone‐like vitamin, and is involved in calcium metabolism. Recent investigations have demonstrated that VitD3 has a potent immunomodulating function.( 8 ) Namely, mice fed or treated with VitD3 showed low occurrence and severity of experimental autoimmune encephalomyelitis, which is a Th1‐dependent autoimmune disease.( 9 ) Moreover, naïve T cells that are treated with VitD3 alone or a combination of VitD3 and dexamethasone differentiate into IL‐10‐producing T cells in vitro.( 10 , 11 ) In addition, VitD3 influences the differentiation and functions of DC.( 12 , 13 , 14 , 15 ) Thus, VitD3 is considered as one of the important immunomodulating drugs that inhibit Th1‐dependent immune responses through regulating the function of DC and T cells. Some molecular mechanisms for inhibition of type 1 immunity by VitD3 have been reported.( 16 , 17 ) However, though it has been shown that VitD3 suppresses the production of Th1 cytokines, it is not yet known whether VitD3 modulates the effect of Th1 cytokines on immune cells. Thus, it is important to investigate the effect of VitD3 on the differentiation and function of Th1 cytokine‐conditioned cells.
In the present study, we have investigated the effect of VitD3 on the differentiation of BM cells to BMDC subsets. VitD3 was found to significantly inhibit Th1‐cytokine‐derived BMDC1 differentiation, but not BMDC0 differentiation. Moreover, BMDC1 treated with VitD3 caused a great inhibition of allogeneic CTL generation. Taken together, VitD3 is an effective immunomodulating reagent that acts by inhibiting the differentiation of BMDC1, which is a critical antigen‐presenting cell for inducing type 1 acquired T‐cell immunity.
Materials and Methods
Animals
Female BALB/c and C57BL/6 mice were obtained from Charles River Japan (Yokohama, Japan). All animals were used at 5–8 weeks of age and maintained in specific pathogen‐free conditions.
Induction of DC from BM cells
BMDC subsets were generated as described previously.( 3 ) Briefly, BM cells of BALB/c mice were cultured under two different cytokine conditions in 12‐well plates (Costar, New York, NY, USA) for 5 days. BMDC0 was induced by culturing BM cells (5 × 10⁶ cells/well) in the presence of GM‐CSF (30 ng/mL) and IL‐3 (30 ng/mL). In addition to GM‐CSF and IL‐3 (BMDC0 conditions), BMDC1 was induced in the presence of IFN‐γ (15 ng/mL) and IL‐12 (40 U/mL). After 3 days, non‐adherent cells were removed from the culture and fresh medium containing cytokines was added. After a further 2 days, BMDC were harvested by vigorous pipetting after treatment with 0.25% trypsin + 0.5 mM EDTA solution. To study the influence of VitD3 on the differentiation to BMDC subsets, BMDC were generated with or without 40 nM 1α,25‐dihydroxyvitamin D3 analog, Rocaltrol® (Calcitriol; 9,10‐seco(5Z,7E)‐5,7,10(19)‐cholestatriene‐1α, 3β, 25‐triol; Roche Pharmaceuticals, Nutley, NJ, USA). As described previously, most (> 95%) of the harvested cells expressed CD11c under all conditions.( 3 ) In some experiments, we further purified (> 99%) CD11c+ BMDC by cell sorting using a FACSVantage instrument (BD Biosciences, San Jose, CA, USA). Recombinant murine IL‐3, IFN‐γ and GM‐CSF were purchased from Pepro Tech EC (London, UK). Recombinant murine IL‐12 was kindly donated from Wyeth Research (Cambridge, MA, USA).
Flow cytometry
The phenotypic characterization of BMDC was carried out by flow cytometry using a FACSCalibur instrument (BD Biosciences) and CellQuest software. The monoclonal antibodies (mAb) used in our experiments (PE‐conjugated anti‐CD11c and anti‐CD8 mAb and FITC‐conjugated anti‐H‐2d, anti‐I‐Ad, anti‐CD40, anti‐CD80, anti‐CD86 and anti‐CD69 mAb) were purchased from PharMingen (San Diego, CA, USA). Anti‐LFA‐1 mAb was purified from the supernatant of hybridoma (KBA) and was labeled with FITC‐I (Dojindo Laboratories, Kumamoto, Japan). Detailed procedures for staining have been described previously.( 18 ) For BMDC, CD11c+ populations were analyzed.
Generation of CTL in MLR
C57BL/6 mouse spleen cells (5 × 10⁶ cells) were co‐cultured with one of the BMDC subsets derived from BALB/c mice (2 × 10⁵ cells) that were pretreated with mitomycin C (60 mg/mL; Kyowa Hakko Kogyo, Tokyo, Japan). In some experiments, CD8+ T cells and CD8− cells were separated using CD8+ iMag beads (BD Biosciences) and used as responder cells for MLR. The purity of the each population was > 95%. Cells were cocultured for 4 days in round‐bottomed 5‐mL tube (Falcon; BD Biosciences). After culture, cells were collected and used for analysis.
Analysis of cytoplasmic cytokine production
For the detection of cytoplasmic cytokine expression of T cells, cells stimulated with immobilized anti‐CD3 mAb for 6 h (last 2 h in the presence of Brefeldin A) were first stained with CyChrome‐conjugated anti‐CD8 mAb, fixed with 4% paraformaldehyde, treated with permeabilizing solution (50 mM NaCl, 5 mM EDTA, 0.02% NaN3 and 0.5% Triton X‐100, pH 7.5), and stained with PE‐conjugated anti‐IL‐4 mAb and FITC‐conjugated anti‐IFN‐γ mAb for 45 min at 4°C. The percentage of cells producing cytoplasmic IL‐4 or IFN‐γ was determined using a FACSCalibur. Purified anti‐CD3, CyChrome‐conjugated anti‐CD8, PE‐conjugated anti‐IL‐4 and FITC‐conjugated anti‐IFN‐γ mAb were purchased from PharMingen.
Cytotoxicity assay
The cytotoxicity of CTL generated by allogeneic MLR was measured using a 4‐h 51Cr‐release assay. H‐2d‐specific cytotoxicity was determined using P815 mastocytome cells as a target. As a control target cell, syngeneic MBL‐2 T lymphoma cells (H‐2b) were used. The percentage cytotoxicity was calculated as described previously.( 19 )
Reverse transcription–polymerase chain reaction
Total RNA was extracted from purified CD11c+ BMDC using Isogen reagent (Nippon Gene, Tokyo, Japan), and was reverse transcribed to cDNA using Superscript II RNaseH− Reverse Transcriptase (Invitrogen, Carlsbad, CA, USA). Subsequently, cDNAs were amplified using Taq DNA polymerase (Promega, Madison, WI, USA) and specific primer pairs for: IFN‐α (forward, 5′‐AAT GAC CTC CAC CAG CAG CT‐3′; and reverse, 5′‐TCT CAG GTA CAC AGT GAT CCG‐3′), IFN‐β (forward, 5′‐GAA AAG CAA GAG GAA AGA TT‐3′; and reverse, 5′‐AAG TCT TCG AAT GAT GAG AA‐3′), IFN‐γ (forward, 5′‐CGA CTC CTT TTC CGC TTC CTG AG‐3′; and reverse, 5′‐TGA ACG CTA CAA CTG CAT CTT GG‐3′), TGF‐β (forward, 5′‐CCT GAG TGG CTG TCT TTT GA‐3′; and reverse, 5′‐CAG GGT CCC AGA CAG AAG TT‐3′), IL‐12p35 (forward, 5′‐GTC AAT CAC GCT ACC TCC TCT T‐3′; and reverse, 5′‐CTC TGT AAG GGT CTG CTT CTC C‐3′), IL‐12p40 (forward, 5′‐CAG AAG CTA ACC ATC TCC TGG TTT G‐3′; and reverse, 5′‐TCC GGA GTA ATT TGG TGC TTC ACA C), IL‐10 (forward, 5′‐CAT ACT GCT AAC CGA CTC CT‐3′; and reverse, 5′‐GAG TCC AGC AGA CTC AAT ACA C‐3′) and β‐actin (forward, 5′‐GTG ATG GTG GGA ATG GGT CAG‐3′; and reverse, 5′‐TTT GAT GTC ACG CAC GAT TTC C‐3′). The expression of IL‐12 and IL‐10 mRNA was investigated after 1 µg/mL LPS stimulation for 48 h. In the time‐course study of gene expression, BM precursor cells were isolated using Sheep anti‐Rat IgG Dynabeads (Dynal Biotech ASA, Oslo, Norway) after incubation with rat antimouse CD4, CD8, B220, CD11b and Gr‐1 IgG mAb (PharMingen), and were differentiated to BMDC subsets. Polymerase chain reaction products were separated on an ethidium bromide‐containing agarose gel, and were visualized with a ultraviolet transilluminator.
Western blot analysis of STAT1
Bone marrow cells depleted of CD4‐positive cells, CD8‐positive cells, B220‐positive cells, CD11b‐positive cells and Gr‐1‐positive cells were stimulated under BMDC1 conditions with or without VitD3 and after incubation at 37°C for 1, 3 or 6 h. They were then digested in lysis buffer (20 mM Tris‐HCl, pH 7.4, 1% Triton X‐100, 0.5% sodium deoxycholate, 10% glycerol, 137 mM NaCl, 2 mM EDTA, 50 mM β‐glycerophosphate, 2 mM Na3VO4, 10 mM NaF, 1 mM dithiothreitiol, 1 mM phenylmethylsulfonylfluoride, 10 µg/mL leupeptin and 10 µg/mL aprotinin) (Sigma, St. Louis, MO, USA). These samples were electrophoresed on an 8% acrylamide/bis‐sodium dodecylsulfate gel and transferred to a polyvinylidene fluoride (PVDF) membrane (ImmunobilonTM‐P, Millipore, Bedford, MA, USA). The blots were blocked with 5% non‐fat milk powder, incubated first with antiphospho‐STAT1 polyclonal antibody (Cell Signaling Technology, St Louis, MO, USA) and then with horseradish perxoidase‐conjugated antirabbit IgG (Chemicon International, Temecula, CA, USA), and developed using the ECL‐Plus western blot detection reagents (Amersham Bioscience, Piscataway, NJ, USA). The blot was exposed to X‐ray film (Kodak, Rochester, NY, USA). The membrane was washed, reblocked, and used for the detection of total‐STAT1 using anti‐STAT1 mAb (BD Transduction Laboratories, San Diego, CA, USA).
Results
Immunomodulating effect of VitD3 on the function of BMDC subsets
To examine the effect of VitD3 on the differentiation and function of the Th1 cytokine‐conditioned BMDC subset, BM cells were cultured under BMDC0 or BMDC1 conditions for 5 days with or without VitD3. As described previously, BMDC1 expressed high levels of cell surface functional molecules compared with the BMDC0 subset (Fig. 1).( 3 ) However, the addition of VitD3 to BMDC1 culture conditions (VD3‐BMDC1) resulted in a great reduction in the expression levels of functional molecules (H‐2d, CD80, CD40 and LFA‐1). Though some cell surface molecules (H‐2d, CD80, LFA‐1) were downmodulated by VitD3 in the BMDC0 subset, such a strong immunomodulating effect of VitD3 was not observed. After maturation by stimulation with LPS, the difference in expression levels among BMDC subsets had the same tendency as before stimulation becanse these surface molecules were equally upregulated (data not shown). Thus, VitD3 strongly affected the differentiation of BMDC1, whereas differentiation of BMDC0 was only weakly influenced by VitD3. It was also shown that VitD3 treatment of BMDC1 culture caused a great inhibition of mRNA expression of IFN‐γ and IFN‐β, which are critical cytokines for inducing type 1 acquired T‐cell immunity. In contrast, no significant inhibition of TGF‐β, IL‐12 or IL‐10 mRNA expression was induced by VitD3 (Fig. 2).
Figure 1.
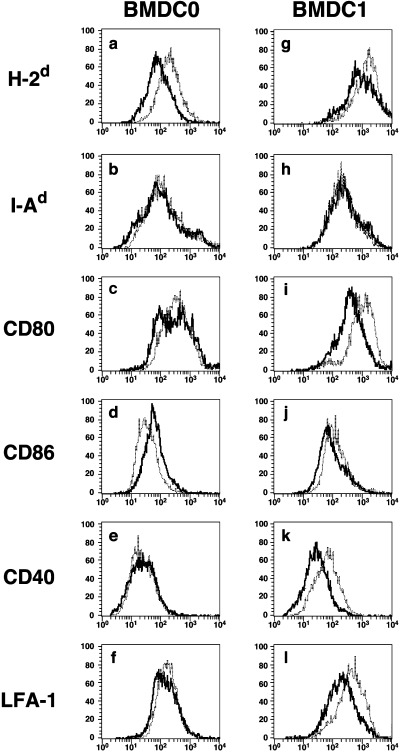
The expression of functional cell surface molecules on BMDC1 was greatly downmodulated by VitD3. (a–f) BMDC0 and (g–l) BMDC1 were generated from bone marrow cells by culture under distinct culture conditions with or without VitD3. Expression of cell surface molecules ([a,g] H‐2d, [b,h] I‐Ad, [c,i] CD80, [d,j] CD86, [e,k] CD40 and [f,l] leukocyte function‐associated antigen [LFA]‐1) was determined by flow cytometry. The data indicate the staining profile of BMDC subsets generated in the presence (–––) or absence (. . .) of VitD3. Similar results were obtained in three different experiments.
Figure 2.
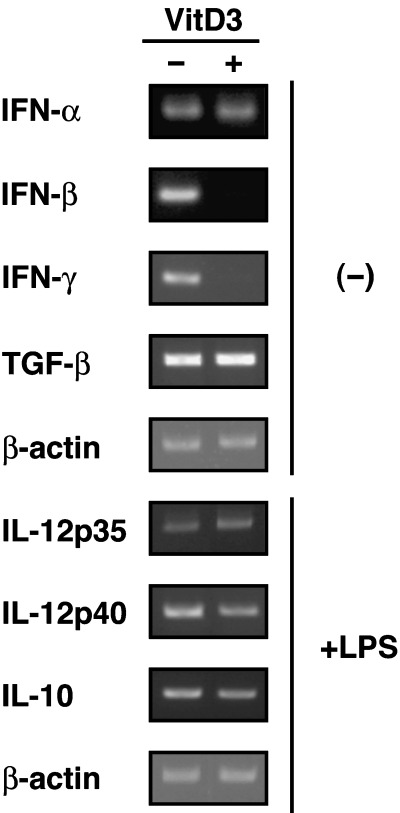
VitD3 inhibited mRNA expression of interferon (IFN)‐β and IFN‐γ in the BMDC1 subset. The mRNA expression of cytokines (IFN‐α, IFN‐β, IFN‐γ and transforming growth factor (TGF)‐β) in BMDC1 and VD3‐BMDC1 was determined by reverse transcription–polymerase chain reaction. After lipopolysaccharide (LPS) stimulation for 48 h, the expression of interleukin (IL)‐12p35, IL‐12p40 and IL‐10 mRNA was analyzed. To exclude mRNA expression by other cells types, CD11c+ cells were purified by cell sorting before extraction of total RNA. Similar results were obtained in three different experiments.
Immunomodulating effect of VitD3 on BMDC function for inducing IFN‐γ production and CTL induction in allogeneic MLR
C57BL/6 (H‐2b) mouse spleen cells were stimulated with mytomicin C (MMC)‐treated BMDC subsets derived from BALB/c mice (H‐2d) for 4 days. As reported previously, BMDC1 showed a strong stimulating capability to induce the activation of CD8+ T cells compared with BMDC0.( 3 ) Because activation of alloantigen‐specific CD4+ T cells was barely detectable under our experimental conditions, we focused on the activation of CD8+ T cells in the present study. Induction of IFN‐γ‐producing CD8+ T cells was investigated by staining of cytoplasmic cytokines (IL‐4 and IFN‐γ) after stimulation with allogeneic BMDC subsets. A higher percentage of IFN‐γ‐producing CD8+ T cells was induced by stimulation with allogeneic BMDC1 compared with BMDC0 (Fig. 3A). However, IFN‐γ‐producing CD8+ T cells were rarely induced when spleen cells were cultured with VD3‐BMDC1. Such a significant difference in the number of IFN‐γ‐producing cells was not observed when BMDC0‐stimulated and VD3‐BMDC0‐stimulated CD8+ T cells were compared. The percentage of IL‐4‐producing T cells was not affected by VitD3 treatment. As shown in Fig. 3B, the proliferation activity of spleen cells stimulated with BMDC1 was higher than with BMDC0, but it was significantly decreased by culture with VD3‐BMDC1. There was no difference in cell proliferation activity between spleen cells stimulated with BMDC0 or VD3‐BMDC0.
Figure 3.
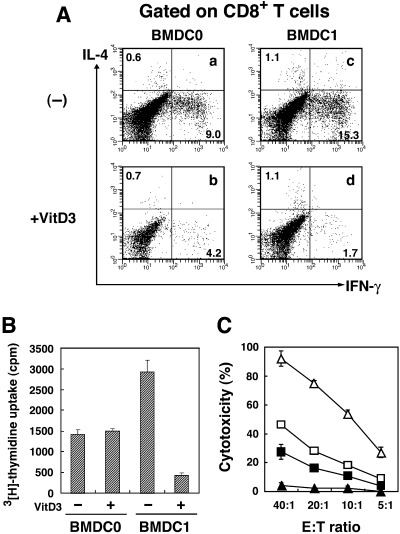
VitD3 reduced the capability of BMDC1 to induce alloantigen‐specific cytotoxic T lymphocytes (CTL) in a mixed lymphocyte reaction (MLR). Spleen cells of C57BL/6 were stimulated with mytomicin C (MMC)‐treated allogeneic BMDC0 or BMDC1 generated with or without VitD3 for 4 days. (A) The production of interleukin (IL)‐4 and interferon (IFN)‐γ from CD8+ T cells stimulated with BMDC0 (a,b) or BMDC1 (c,d) generated in the absence (a,c) or in the presence (b,d) of VitD3 was determined by intracellular cytokine staining. Numbers represent the percentage of cells in each quadrant. The same results were obtained in three separate experiments. (B) After 4 days of MLR, cells were pulsed with 3[H]‐thymidine for 4 h and harvested on a glass filter. Proliferation of spleen cells stimulated with BMDC subsets was determined by counting incorporated 3H using a β‐counter. The bars represent the mean ± SE of triplicate samples. (C) Alloantigen‐specific CTL activity of C57BL/6 mouse spleen cells was measured after 4 day culture with BALB/c BMDC subsets generated in the presence or absence of VitD3. After 4 days of MLR, cells were harvested and their cytotoxicity against P815 mastocytoma cells (H‐2d) was measured using a 4‐h 51Cr‐release assay. The bars represent the mean ± SE of triplicate samples. □, BMDC0; ▵, BMDC1; ▪, VD3‐BMDC0; ▴, VD3‐BMDC1.
Next, we investigated whether VitD3 inhibited the CTL‐inducing capability of BMDC1 in parallel with their reduction of capability to induce IFN‐γ production. CTL induced by stimulation with BMDC1 exhibited a strong cytotoxicity against H‐2d‐positive P815 mastocytoma cells (Fig. 3C). The cytotoxicity was demonstrated to be H‐2d‐specific because syngeneic H‐2b‐positive MBL‐2 lymphoma cells were not destroyed by those CTL (data not shown). In sharp contrast, VD3‐BMDC1‐stimulated allogeneic spleen cells did not show any cytotoxicity against P815. BMDC0‐induced and VD3‐BMDC0‐induced CTL showed similar levels of H‐2d‐specific cytotoxic activity. Therefore, VD3‐BMDC1 almost completely lost its ability to induce alloantigen‐specific CTL, but BMDC0 appeared to be less influenced by VitD3 in comparison to BMDC1.
Loss of antigen presenting ability to CD8+ T cells by VD3‐BMDC1
Although it was shown that CTL induction by VD3‐BMDC1 was significantly reduced, it was still unclear whether direct antigen presentation to CTL precursors by VD3‐BMDC1 was impaired or whether other cell types inhibited the CTL induction. Therefore, we investigated the main target cells in allogeneic MLR. Both CD8+ T cells and CD8− cells separated from spleen cells of C57BL/6 mice were stimulated with BMDC1 or VD3‐BMDC1 derived from BALB/c mice for 4 days. As shown in Fig. 4a, the supernatant of CD8+ T cells co‐cultured with BMDC1 contained much higher IFN‐γ levels than that of whole spleen cells or CD8− cells. In contrast, the IFN‐γ level was significantly lower in the supernatant of CD8+ T cells stimulated with VD3‐BMDC1 compared with BMDC1. There was no significant reduction in IFN‐γ production from CD8− cells stimulated with VD3‐BMDC1 compared with BMDC1. Similarly, CD8+ T cells but not CD8− cells exhibited alloantigen‐specific CTL activity when they were stimulated with BMDC1 in allogeneic MLR (Fig. 4b). CTL activity of CD8+ T cells was significantly decreased by co‐culture with VD3‐BMDC1. Thus, impaired activation of CD8+ T cells by VD3‐BMDC1 was attributed to the loss of antigen presenting and functionally differentiating capabilities of VD3‐BMDC1.
Figure 4.
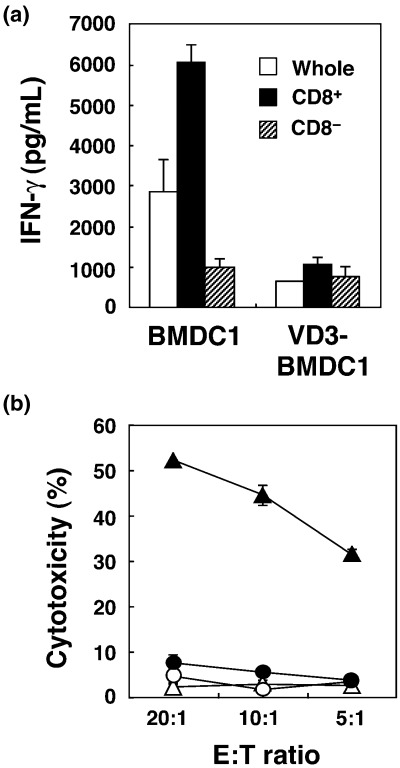
BMDC1 generated with VitD3 failed to generate cytotoxic T lymphocytes (CTL) from isolated CD8+ T cells. CD8+ or CD8− cells separated from spleen cells of C57BL/6 mice were stimulated with BMDC1 or VD3‐BMDC1 induced from bone marrow cells of BALB/c mice. (a) Interferon (IFN)‐γ levels of the supernatant of culture at day 4 were determined by ELISA. The bars represent the mean ± SE of triplicate samples. (b) Alloantigen‐specific CTL activity was measured using a 4‐h 51Cr‐release assay against P815 mastocytoma cells. The bars represent the mean ± SE of triplicate samples. ▴, CD8+ (BMDC1); ▵, CD8− (BMDC1); •, CD8+ (VD3‐BMDC1); ○, CD8− (VD3‐BMDC1).
VitD3 influence at the early stage of BMDC1 differentiation
The results shown above suggest that VitD3 significantly prevents the functional differentiation of BMDC1. To examine when VitD3 inhibits the differentiation to BMDC1, VitD3 was added at different stages of BMDC1 differentiation. That is, in the course of the generation of BMDC1, VitD3 was added during days 0–3, days 3–5 or days 0–5 (VD3‐BMDC1). These BMDC subsets were then used as stimulator cells in MLR. As shown in Fig. 5, BMDC1 that were treated with VitD3 during days 3–5 exhibited strong antigen presenting ability to stimulate allogeneic CTL, as in normal BMDC1 generated without VitD3. In contrast, BMDC1 induced with VitD3 during days 0–3 significantly lost its capability to stimulate allogeneic CTL, compared with BMDC1 without VitD3. Thus, VitD3 mainly inhibited the functional differentiation of BMDC1 at the early stage of differentiation.
Figure 5.
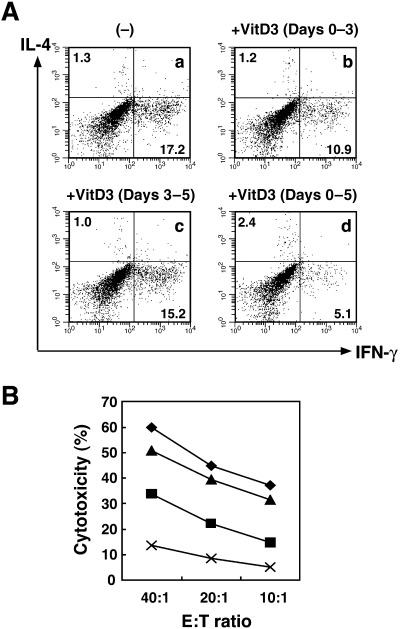
The inhibitory effect of VitD3 was exhibited during the early stage but not the late stage of BMDC1 differentiation. BMDC1 were generated from bone marrow cells in the absence or presence of VitD3. VitD3 was added during days 0–3, days 3–5 or days 0–5 (VD3‐BMDC1). (A) CD8+ T cells stimulated with allogeneic BMDC1 for 4 days were further activated by plate‐bound anti‐CD3 monoclonal antibody for 6 h, and cytoplasmic interleukin‐4 and interferon‐γ production were assessed by flow cytometry. (B) Cytotoxic T lymphocyte activity of alloantigen‐specific T cells against P815 cells (H‐2d) was measured using a 4‐h 51Cr‐release assay. Bars represent the mean ± SE from three separate experiments. ◆, (–); ▪, +VitD3 (days 0–3); ▴, +VitD3 (days 3–5); ×, +VitD3 (days 0–5).
Finally, we investigated the mechanism of the suppression of differentiation to BMDC1 by VitD3. Because VitD3 affected BMDC1 differentiation at an early stage, we analyzed IFN‐γ signaling of BM cells at early time points of differentiation using BMDC1 with or without VitD3. In a preliminary experiment, we had confirmed that BMDC1 or VD3‐BMDC1 were generated from CD4−CD8−B220−CD11b−Gr‐1− BM cell populations (data not shown). These cells were therefore used in this experiment to exclude the expression of signaling molecules by other cell populations. There was no significant difference between the mRNA expression of T‐bet, an important molecule in IFN‐γ signaling, and GATA‐3, an inhibitory molecule of IFN‐γ signaling, during the differentiation of BMDC1 in the presence or absence of VitD3 (Fig. 6A). Next, we analyzed the effect of VitD3 on phosphorylation of STAT1. As a result, the addition of VitD3 to BMDC1 culture conditions inhibited phosphorylation of STAT1α at 1 h; however, no significant differences were observed thereafter. Thus, one of the possible reasons for the inhibition of BMDC1 differentiation by VitD3 could be the inhibition of STAT1 phosphorylation at an early stage in the differentiation of BM precursor cells.
Figure 6.
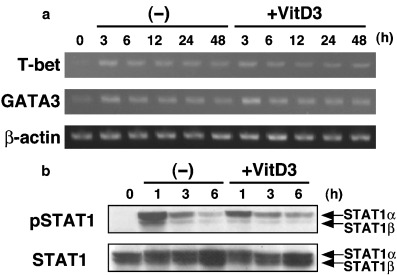
VitD3 inhibited phosphorylation of STAT1 at the early stage of BMDC1 differentiation. CD4−CD8−B220−CD11b−Gr‐1− precursor bone marrow cells were stimulated under BMDC1 conditions with or without VitD3. (a) T‐bet and GATA‐3 mRNA expression was analyzed by reverse transcription–polymerase chain reaction at different times. As an internal control, expression of β‐actin was also analyzed. (b) Expression of phospho‐STAT1 and STAT1 was determined by western blot analysis.
Discussion
Dendritic cells are known as the most potent antigen‐presenting cells of the immune system.( 20 ) In the present study, we initially demonstrated an immunosuppressive effect of VitD3 on the functional differentiation of a BM‐derived DC subset, BMDC1, which was induced under Th1‐cytokine conditions. As reported previously, BMDC1 exhibited a strong stimulating activity for inducing allogeneic CTL compared with BMDC0.( 3 ) Moreover, we demonstrated that BMDC1 was beneficial for application to DC‐based tumor vaccine therapy.( 4 ) However, VitD3 showed a strong immunomodulating effect on the function of BMDC1 but not on BMDC0. Culture of BM cells with Th1‐cytokine resulted in differentiation of BMDC1 expressing high levels of functional cell surface molecules, including MHC and co‐stimulating molecules.( 3 ) However, VitD3 inhibited the augmented expression of functional cell surface molecules on BMDC1 (Fig. 1). It is acknowledged that MHC and co‐stimulating molecules on DC are essential for triggering immune responses.( 20 , 21 ) Therefore, VitD3 may inhibit the immunostimulating activity of BMDC1 via downmodulation of cell surface functional molecules to create anergic DC (Fig. 3). In a previous paper, we demonstrated that BMDC1‐derived IFN‐β is a critical factor for inducing type 1 immunity and allogeneic CTL.( 22 ) IFN‐γ‐producing BMDC1 cells have also been shown to be beneficial for inducing type 1 immunity and CTL induction.( 3 , 4 , 5 ) BMDC1 expressed high levels of mRNA for IFN‐γ and IFN‐β, but VitD3‐treated BMDC1 showed no significant mRNA expression of IFN‐β and IFN‐γ (Fig. 2). Therefore, downmodulation of the type 1 cytokine‐producing ability of BMDC1 by VitD3 may be another crucial cause of the inhibition of IFN‐γ‐producing CTL generated by CD8+ T cells (3, 4).
It has been reported that VitD3 inhibits the functional maturation of human monocyte‐derived DC and mouse BMDC induced by differentiation factor (GM‐CSF and IL‐4) and maturation stimulation (LPS, TNF‐α or anti‐CD40 mAb).( 12 , 13 , 14 , 15 ) In the present study, when VitD3 was added into culture at the differentiation stage, though the addition of VitD3 showed slight inhibition of BMDC0 differentiation and function, it strongly inhibited the expression of cell surface molecules on BMDC1. Thus, VitD3 also appeared to exhibit an immunomodulating effect on the differentiation of Th1‐cytokine biasing BMDC1.
Some molecular mechanisms for suppression of Th1‐type immune responses by VitD3 have been reported previously.( 16 , 17 , 23 , 24 , 25 ) After binding of VitD3 to the vitamin D receptor, that is, a nuclear receptor, VDR associates with RXR. This VDR/RXR heterodimer prevents transcription of cytokine genes such as IFN‐γ, IL‐12, IL‐2 and GM‐CSF by binding to the vitamin D responsive element or nuclear factor of activated T cells (NFAT) site, or by downmodulating NF‐κB activation. As NF‐κB activation is required for induction of the IFN‐β gene,( 26 , 27 , 28 ) it is reasonable that VD3‐BMDC1 didn't express IFN‐β mRNA. However, it remains unclear what signaling is involved in VitD3‐induced downmodulation of functional cell surface molecules on BMDC1.
In contrast to our observation that VitD3 inhibits the function of IFN‐γ‐induced BMDC1, VitD3 was reported to enhance the function of a macrophage cell line by treatment with IFN‐γ.( 29 ) The mechanism for this enhancement was found to be the formation of a VDR/STAT1 complex. The VDR/STAT1 complex inhibits VDR/RXR binding to the vitamin D responsive element and promotes STAT1‐mediated transcription by maintaining STAT1 phosphorylation. Though VD3‐BMDC1 was also generated in the presence of IFN‐γ, at an early stage in the differentiation of BM cells, VitD3 inhibited phosphorylation of STAT1 (Fig. 6b). However, we could not detect any significant difference in the expression of both total and phosphorylated STAT1 between BMDC1 and VD3‐BMDC1 at day 5 (data not shown). Therefore, VitD3 and IFN‐γ exhibit differential effects on the function of antigen‐presenting cells, dependent on cell lineage and differentiation stage.
Thus, VitD3 exhibits a strong immunosuppressive effect on the function of BMDC1, which is beneficial for inducing type 1 immune responses and CTL generation. The immunosuppressive effect of VitD3 was demonstrated even in the presence of Th1‐cytokine (IFN‐γ). Therefore, VitD3 could become a suitable immunomodulating drug for application to Th1‐type immune diseases such as psoriasis, multiple sclerosis and graft versus host disease.( 30 , 31 , 32 )
Acknowledgments
We thank Dr Steve Herrmann (Wyeth Research, Cambridge, MA) for his kind donation of IL‐12.
References
- 1. Banchereau J, Steinman RB. Dendritic cells and the control of immunity. Nature 1998; 392: 245–52. [DOI] [PubMed] [Google Scholar]
- 2. Palucka K, Banchereau J. Dendritic cells: a link between innate and adaptive immunity. J Clin Immunol 1999; 19: 12–25. [DOI] [PubMed] [Google Scholar]
- 3. Sato M, Iwakabe K, Ohta A et al. Functional heterogeneity among bone marrow‐derived dendritic cells conditioned by Th1‐ and Th2‐biasing cytokines for the generation of allogeneic cytotoxic T lymphocytes. Int Immunol 2000; 12: 335–42. [DOI] [PubMed] [Google Scholar]
- 4. Sato M, Chamoto K, Nishimura T. A novel tumor‐vaccine cell therapy using bone marrow‐derived dendritic cell type 1 and antigen‐specific Th1 cells. Int Immunol 2003; 15: 837–43. [DOI] [PubMed] [Google Scholar]
- 5. Steinbrink K, Wolfl M, Jonuleit H, Knop J, Enk AH. Induction of tolerance by IL‐10‐treated dendritic cells. J Immunol 1997; 159: 4772–80. [PubMed] [Google Scholar]
- 6. Sato K, Yamashita N, Yamashita N, Baba M, Matsuyama T. Regulatory dendritic cells protect mice from murine acute graft‐versus‐host disease and leukemia relapse. Immunity 2003; 18: 367–79. [DOI] [PubMed] [Google Scholar]
- 7. Sato K, Yamashita N, Baba M, Matsuyama T. Modified myeloid dendritic cells act as regulatory dendritic cells to induce anergic and regulatory T cells. Blood 2003; 101: 3581–9. [DOI] [PubMed] [Google Scholar]
- 8. Abe J, Takita Y, Nakano T, Miyaura C, Suda T, Nishi Y. A synthetic analogue of vitamin D3, 22‐oxa‐1α,25‐dihydroxyvitamin D3, is a potent modulator of in vivo immunoregulating activity without inducing hypercalcemia in mice. Endocrinology 1989; 124: 2645–7. [DOI] [PubMed] [Google Scholar]
- 9. Nashold FE, Hoag KA, Goverman J, Hayes CE. Rag‐1‐dependent cells are necessary for 1,25‐dihydroxyvitamin D3 prevention of experimental autoimmune encephalomyelitis. J Neuroimmunol 2001; 119: 16–29. [DOI] [PubMed] [Google Scholar]
- 10. Boonstra A, Barrat FJ, Crain C, Heath VL, Savelkoul HF, O'Garra A. 1α,25‐Dihydroxyvitamin D3 has a direct effect on naïve CD4+ T cells to enhance the development of Th2 cells. J Immunol 2001; 167: 4974–80. [DOI] [PubMed] [Google Scholar]
- 11. Barrat FJ, Cua DJ, Boonstra A et al. In vitro generation of interleukin 10‐producing regulatory CD4+ T cells is induced by immunosuppressive drugs and inhibited by T helper type 1 (Th1)‐ and Th2‐inducing cytokines. J Exp Med 2002; 195: 603–16. [DOI] [PMC free article] [PubMed] [Google Scholar]
- 12. Penna G, Adorini L. 1α,25‐Dihydroxyvitamin D3 inhibits differentiation, maturation, activation, and survival of dendritic cells leading to impaired alloreactive T cell activation. J Immunol 2000; 164: 2405–11. [DOI] [PubMed] [Google Scholar]
- 13. Piemonti L, Monti P, Sironi M et al. Vitamin D3 affects differentiation, maturation, and function of human monocyte‐derived dendritic cells. J Immunol 2000; 164: 4443–51. [DOI] [PubMed] [Google Scholar]
- 14. Griffin MD, Lutz W, Phan VA, Bachman LA, McKean DJ, Kumar R. Dendritic cell modulation by 1α,25 dihydroxyvitamin D3 and its analogs: a vitamin D receptor‐dependent pathway that promotes a persistent state of immaturity in vitro and in vivo . Proc Natl Acad Sci USA 2001; 98: 6800–5. [DOI] [PMC free article] [PubMed] [Google Scholar]
- 15. Berer A, Stockl J, Majdic O et al. 1,25‐Dihydroxyvitamin D3 inhibits dendritic cell differentiation and maturation in vitro . Exp Hematol 2000; 28: 575–83. [DOI] [PubMed] [Google Scholar]
- 16. Cippitelli M, Santoni A. Vitamin D3: a transcriptional modulator of the interferon‐γ gene. Eur J Immunol 1998; 28: 3017–30. [DOI] [PubMed] [Google Scholar]
- 17. D’Ambrosio D, Cippitelli M, Cocciolo MG et al. Inhibition of IL‐12 production by 1,25‐dihydroxyvitamin D3. Involvement of NF‐κB downregulation in transcriptional repression of the p40 gene. J Clin Invest 1998; 101: 252–62. [DOI] [PMC free article] [PubMed] [Google Scholar]
- 18. Nishimura T, Santa K, Yahata T et al. Involvement of IL‐4‐producing Vβ8.2+CD4+CD62L−CD45RB−T cells in non‐MHC gene‐controlled predisposition toward skewing into T helper type‐2 immunity in BALB/c mice. J Immunol 1997; 158: 5698–706. [PubMed] [Google Scholar]
- 19. Nishimura T, Brakoff SJ, Herrmann SH. Inhibition of lymphokine‐activated killer cell‐mediated cytotoxicity by phorbol ester. J Immunol 1989; 142: 2155–61. [PubMed] [Google Scholar]
- 20. Banchereau J, Briere F, Caux C et al. Immunobiology of dendritic cells. Annu Rev Immunol 2000; 18: 767–811. [DOI] [PubMed] [Google Scholar]
- 21. Viola A, Lanzavecchia A. T cell activation determined by T cell receptor number and tunable thresholds. Science 1996; 273: 104–6. [DOI] [PubMed] [Google Scholar]
- 22. Sato M, Chamoto K, Tsuji T et al. Th1 cytokine‐conditioned bone marrow‐derived dendritic cells can bypass the requirement for Th functions during the generation of CD8+ CTL. J Immunol 2001; 167: 3687–91. [DOI] [PubMed] [Google Scholar]
- 23. Takeuchi A, Reddy GS, Kobayashi T, Okano T, Park J, Sharma S. Nuclear factor of activated T cells (NFAT) as a molecular target for 1α,25‐dihydroxyvitamin D3‐mediated effects. J Immunol 1998; 160: 209–18. [PubMed] [Google Scholar]
- 24. Alroy I, Towers TL, Freedman LP. Transcriptional repression of the interleukin‐2 gene by vitamin D3: direct inhibition of NFATp/AP‐1 complex formation by a nuclear hormone receptor. Mol Cell Biol 1995; 15: 5789–99. [DOI] [PMC free article] [PubMed] [Google Scholar]
- 25. Towers TL, Staeva TP, Freedman LP. A two‐hit mechanism for vitamin D3‐mediated transcriptional repression of the granulocyte‐macrophage colony‐stimulating factor gene: Vitamin D receptor competes for DNA binding with NFAT1 and stabilizes c‐Jun. Mol Cell Biol 1999; 19: 4191–9. [DOI] [PMC free article] [PubMed] [Google Scholar]
- 26. Kirchhoff S, Wilhelm D, Angel P, Hauser H. NFκB activation is required for interferon regulatory factor‐1‐mediated interferon β induction. Eur J Biochem 1999; 261: 546–54. [DOI] [PubMed] [Google Scholar]
- 27. Nourbakhsh M, Hauser H. Constitutive silencing of IFN‐β promoter is mediated by NFR (NF‐κB‐repressing factor), a nuclear inhibitor of NF‐κB. EMBO J 1999; 18: 6415–25. [DOI] [PMC free article] [PubMed] [Google Scholar]
- 28. Rani MR, Asthagiri AR, Singh A et al. A role for NF‐κB in the induction of β‐R1 by interferon‐β. J Biol Chem 2001; 276: 44 365–8. [DOI] [PubMed] [Google Scholar]
- 29. Vidal M, Ramana CV, Dusso AS. Stat1‐vitamin D receptor interactions antagonize 1,25‐dihydroxyvitamin D transcriptional activity and enhance Stat1‐mediated transcription. Mol Cell Biol 2002; 22: 2777–87. [DOI] [PMC free article] [PubMed] [Google Scholar]
- 30. Van Amerongen BM, Dijkstra CD, Lips P, Polman CH. Multiple sclerosis and vitamin D: an update. Eur J Clin Nutr 2004; 58: 1095–109. [DOI] [PubMed] [Google Scholar]
- 31. Adorini L, Penna G, Casorati M, Davalli AM, Gregori S. Induction of transplantation tolerance by 1,25‐dihydroxyvitamin D3. Transplant Proc 2001; 33: 58–9. [DOI] [PubMed] [Google Scholar]
- 32. Lehmann B, Querings K, Reichrath J. Vitamin D and skin: new aspects for dermatology. Exp Dermatol 2004; 13: 11–15. [DOI] [PubMed] [Google Scholar]