

Abstract
Margin status, a major prognostic parameter in oral cancer, was analyzed vis‐à‐vis the histopathologic parameters of risk scores and stromal myofibroblasts. Specimens of tongue carcinoma (n = 50) were submitted to a risk score assignment consisting of the worst pattern of invasion, lymphocytic infiltration, and perineural invasion. Frequency of stromal myofibroblasts (alpha‐smooth muscle actin stain) was assessed. A triple immunostaining assay with E‐cadherin, Ki‐67 and alpha‐smooth muscle actin was used to identify carcinoma cells undergoing epithelial–mesenchymal transition. Margins were considered ‘clean’ if the tumor was ≥5 mm away from them. Patients ≤60 years were considered as ‘young’. Kaplan–Meier survival analysis with univariate and Cox multivariate regression model with stepwise forward selection, and Fisher’s exact tests were used. Abundant myofibroblasts were found in 27 (54%) cases. Carcinoma cells devoid of E‐cadherin but amalgamated with the stromal myofibroblasts were identified in 18 (36%) cases. Local recurrence and overall survival were negatively influenced by abundance of stromal myofibroblasts (P = 0.004 and P = 0.008, respectively). High‐risk scores (P = 0.011), positive margins, and ‘young’ age (P = 0.027, each) had an unfavorable impact on recurrence. Multivariate analysis revealed that only abundance of stromal myofibroblasts had an independent adverse effect on local recurrence (hazard ratio [HR] 4.369; P = 0.014; 95% confidence interval [CI], 1.356–14.074). It seems that abundant stromal myofibroblasts (camouflaging some malignant cells) and high‐risk scores have an unfavorable impact on the risk of recurrence in particular in ‘young’ patients. Therefore, the treatment concept should be adjusted accordingly and target concomitantly the epithelial malignancy and its allied stroma. (Cancer Sci 2009)
The recently defined histopathologic risk score (RS) system for oral squamous cell carcinoma (SCC) is composed of three variables that reflect tumor–host inter‐relationships: worst pattern of invasion (WPOI), lymphocytic infiltration (LI), and perineural invasion (PNI).( 1 ) This RS system has been shown to be significantly predictive of recurrence and overall survival. The advantage of the RS has also been validated by a retrospective analysis of patients with small (T1 stage) tongue cancers for whom recurrent disease could be predicted by the RS but not by the margin status of the tumors.( 1 )
Stromal myofibroblasts (SMF) represent an additional histopathologic feature that plays a key role in the complex tumor milieu. These cells are now known to emerge from stromal normal fibroblasts under the direct impact of cancer cell‐derived cytokines and are aimed to further facilitate tumor local and distant invasion as well as aid in the suppression of the host immune response.( 2 , 3 , 4 ) In addition, there is also emerging evidence that the malignant epithelial cells themselves may be a significant source for SMF.( 2 , 5 ) This phenomenon is termed epithelial–mesenchymal transition (EMT), during which epithelial cells lose their specific markers and acquire the characteristics of mesenchymal cells.( 6 , 7 ) In a recent study on human tongue carcinogenesis, we showed that SMF emerged concomitant with the development of carcinomas, but were practically absent in the dysplastic, pre‐malignant lesions.( 8 ) Furthermore, in that study we found that in 41% of the tumors, there were carcinoma cells at the tumor–host interface, which demonstrated gradual morphological and immunohistochemical modifications toward a mesenchymal phenotype, most likely representing the EMT process.
The aim of the present study was to assess the frequency of SMF in a large series of cases of tongue carcinomas, to classify these cases according to the RS system and their margin status, to determine the interrelations between these histopathologic variables, and to further analyze their impact on disease recurrence and patients’ survival. In addition, we examined the likelihood of EMT at the tumor–host interface using a triple immunostaining assay with antigens for E‐cadherin and alpha‐smooth muscle actin (epithelial and SMF immunophenotype, respectively) and Ki‐67 (cell proliferation).
Materials and Methods
Consecutive patients with oral carcinoma of the tongue who were diagnosed, treated, and followed at the Department of Oral and Maxillofacial Surgery and the Department of Otorhinolaryngology‐Head and Neck Surgery at the Chaim Sheba Medical Center, Tel Hashomer, Israel, between 1981 and 2006, were recruited for the present study. Inclusion criteria were primary resection and a concomitant neck dissection, no prior treatment for tongue cancer, and the availability of all the histopathologic slides of the resection specimens. This study was conducted with the approval of the Institutional Review Board.
Data collected included age at diagnosis, gender, clinical TNM staging, margin status, pathological N stage, adjuvant treatment modality (radiotherapy, chemotherapy), date of recurrent disease, and disease state at last contact (alive free of disease, alive with recurrent disease, dead of/with disease, dead free of disease or of unrelated causes). For the purposes of the present study, only data on age, gender, margin status, recurrent disease, and disease state were used. Patients were classified as ‘young’ if they were <60 years of age and ‘old’ if they were ≥60 years of age. This cut‐off point was selected because 60 years is the mean age of the patient population of oral SCC.( 9 ) The clinical outcomes were measured by two endpoints: locoregional disease control expressed by local recurrence (LR) and overall survival (OS). Recurrence was calculated as the time between the date of diagnosis and first sign of treatment failure at the primary tumor site, at the site of cervical metastases or both. All disease‐free patients had a minimum of 18 months of follow‐up.
Histopathologic assessment.
For assessing myofibroblast frequency, 3‐μm‐wide sections were cut from the 50 blocks containing a representative specimen of the study cases and stained with α‐smooth muscle actin (αSMA) antigen (clone 1A4, 1:100; Dako, Glostrup, Denmark).
The immunohistochemically stained slides were examined for the SMF pattern of distribution throughout the entire tumor stroma. Quantitatively, the frequency of SMF was assessed on a 5‐scale scoring system: 0, devoid of SMF; 0.5, a few SMF with a spindle‐shaped morphology tightly adhering to the periphery of the SCC islands/nests; 1, SMF surround the tumor in a few concentric layers in several foci; 2, SMF with both spindle‐shaped and plump morphology in many areas of the tumor; and 3, similar to the former score but SMF were exceptionally abundant throughout the section, occasionally exceeding the carcinomatous component (Fig. 1). For purposes of statistical analysis, cases with low scores (0, 0.5, and 1) were combined and compared to cases with high scores (2 and 3).
Figure 1.

Stromal myofibroblasts (SMF) of score 0.5 are scarce (A). The area in the dashed rectangle seen at a higher magnification shows a few spindle‐shaped cells arranged in one layer at the tumor–stroma interface (arrow, B). SMF of score 1 are denser (C). At a higher magnification, the area marked by the dashed rectangle exhibits a concentric layout of a few layer width of SMF tightly surrounding the tumor (arrow, D). SMF of score 2 are present in large numbers in some regions of the tumor (right side), while in others they are nearly absent (left side) (E); this interchangeable pattern is not associated with the tumor depth. SMF of score 3 are remarkably abundant throughout the stroma of the entire thickness of the tumor (F). At a higher magnification of the region demarcated by the dashed rectangle, overlapping of the SMF with the tumor cells is conspicuous (G). (αSMA immunostain; A, C, E, F – scale bar 500 μm; B, D, G – scale bar 50 μm).
For the triple immunostaining, one additional section from each case was submitted to a procedure which combined three markers: αSMA, Ki‐67, and E‐cadherin. Sections were pre‐treated with EDTA, pH 9, in a pressure cook and exposed to a mixture of antibodies against Ki‐67 (polyclonal, 1:50; Dako) and αSMA for 1 h at room temperature. Then sections were treated with MACH 2 double stain polymer detection kit #2 (mouse‐HRP+ rabbit− alkaline phosphatase [ALP]) (Biocare Medical, Concord, CA, USA), followed by 3,3′‐diamino‐benzidine (DAB), Vulcan Fast Red chromagen kit 2 (Biocare Medical), and denaturing solutions A and B (Biocare Medical). Afterwards, sections were exposed to the antibody against E‐cadherin (clone NCH‐38, 1:50; DakoCytomation, Glostrup, Denmark) and then treated with MACH2 polymer‐ALP conjugate (goat antimouse polymer‐ALP secondary antibody) (Biocare Medical). This was followed by treatment with Ferangi Blue chromagen system (Biocare Medical). Finally, the slides were covered by GVA mounting medium (Zymed, San Francisco, CA, USA). As a result, the nuclear staining with Ki‐67 was visualized as a red fuchsin color, cytoplasmic αSMA as brown, and E‐cadherin as a bright blue color. Preserved E‐cadherin expression was regarded as a distinct, continuous membranous staining, as demonstrated by the normal‐appearing lining epithelium adjacent to the tumor, which served as an internal control.( 10 ) The sections were evaluated qualitatively for loss of the membranous E‐cadherin immnunoreactivity within the carcinomas. Reduced membranous E‐cadherin and/or cytoplasmic or complete absence of stain were regarded as non‐preserved expression. In addition, special emphasis was given to the assessment of the relationships between the tumor cells and the adjacent collageneous stroma and/or SMF at the tumor–host interface. Whenever the tumor cells showed irregular outlines and appeared to ‘melt’ into the stroma to create a continuum with the αSMA‐positive SMF it was considered as an indication of EMT.( 4 , 5 , 6 ) If this was observed in regions where the tumor lost E‐cadherin expression, presence of Ki‐67 helped to identify the carcinomatous cells.
In order to determine histopathologic RSs, all the hematoxylin–eosin‐stained slides of the resection specimens were examined and scored according to the system established by Brandwein‐Gensler et al. ( 1 ) and included the WPOI, the LI, and PNI. The first two parameters were assessed at the tumor/host interface. The ‘type 1’ pattern of invasion was allocated to a tumor with broad pushing borders, ‘type 2’ to a tumor with broad pushing ‘fingers’ or separate large tumor islands, ‘type 3’ to a tumor with invading islands >15 cells per island, ‘type 4’ to a tumor with invading islands <15 cells per island and up to single cell invasion, and ‘type 5’ to tumor satellites of any size with a ≥1 mm distance of intervening normal tissue (not fibrosis) at the tumor/host interface. The WPOI was taken as the highest score, even if it was only focal. LI was classified as having a ‘type 1’ when a continuous and dense rim of lymphoid tissue was present, as ‘type 2’ when there were intermittent patches of dense lymphoid tissue along the interface, and as ‘type 3’ when there was limited or no lymphocytic response. PNI, defined as carcinoma proceeding alongside or within a nerve, was classified as involving either large nerves of ≥1 mm in diameter or small nerves <1 mm in diameter. A score of ‘0’ was assigned to WPOI of types 1, 2, or 3, LI of type 1 and absence of PNI. A score of ‘1’ was given to WPOI of type 4, LI of type 2, and PNI that involved small nerve fibers. A score of 3 was allocated to WPOI of type 5, LI of type 3, and PNI that involved large nerve fibers. The RS for each case was calculated as the sum of the highest number of points assigned to each of the parameters after examination of all the slides. An RS of ‘0’ was considered as representing a low risk for recurrence and good survival probability. RSs of 1 or 2 indicated an intermediate risk for recurrence and survival, while RSs between 3 to 9 were indicative of a high risk for recurrence and poor survival.( 1 ) For purposes of statistical analysis, the cases with an RS between 0 and 2 were grouped together and defined as low‐to‐intermediate, and they were compared to cases with an RS of ≥3 which were defined as having a high RS.
For assessment of margin status, we selected only T1 and T2 tumors which were included in a single block. Larger tumors, i.e., T3–T4, had to be sampled extensively, and required multiple representative slides from all of the specimen’s margins. Margin status was based on the criteria suggested by Batsakis,( 11 ) defined as ‘clean’ when the tumor was ≥5 mm away from the inked surgical margin. All the others (‘close’ = tumor < 5 mm and ‘positive’ = tumor involving the surgical margin) were considered as being ‘positive’. This definition for the tumor‐margin distance was applied to all the aspects of the resection specimen, both at the mucosal (epithelial) and submucosal (deep) margins. All patients included in the study underwent surgical resection of the primary tumor with the exception of one patient who denied surgery at the site of the primary tumor but underwent necessary neck dissection.
Statistical analysis.
The Kaplan–Meier method was applied for survival analysis. The statistical significance was evaluated using the log‐rank test. Univariate analysis was used to analyze the prognostic potential of the parameters age, gender, RS, SMF, and margin status with respect to LR and OS. A Cox multivariate regression model with stepwise forward selection (likelihood ratio) was performed. Cox hazards ratios with 95% confidence intervals and P‐values were obtained for each covariate analyzed. The covariates analyzed included RSs (high vs low‐to‐intermediate), SMF (‘high’vs‘low’), margin status (positive vs‘clean’), and age (≤60 years vs >60 years). Fisher’s exact test was used to analyze associations between the various examined parameters. In all analyses, P‐values <0.05 were considered to be statistically significant. Statistical analyses were performed by the SPSS software, version 15 (Chicago, IL, USA).
Results
The stringent entry criteria resulted in a sample of 50 patients whose clinicopathologic characteristics are listed in Table 1.
Table 1.
Clinicopathological characteristics of the study group (n = 50)
| Characteristics | Number of patients (%) |
|---|---|
| Age | |
| Range, 20–80 years | |
| Mean, 57.9 ± 15.2 years | 24 (48) |
| Young (≤60 years) | 26 (52) |
| Old (>60 years) | |
| Gender | |
| Female | 24 (48) |
| Male | 26 (52) |
| Clinical Staging (TNM) | |
| Early (stages 1 + 2) | 33 (66) |
| Late (stages 3 + 4) | 17 (34) |
| Adjuvant treatment | |
| Radiotherapy | 34 (68) |
| Chemotherapy | 1 (2) |
| Chemoradiotherapy | 7 (14) |
| Pathologic N status | |
| Positive | 15 (30) |
| Extra capsular spread | 4 (8) |
| Margin status (final pathologic report) | |
| ‘Clean’ | 32 (65.3) |
| Positive | 17 (34.7) |
| Follow‐up | |
| 3–230 months | |
| Mean, 46.7 ± 41.4 months | |
| Recurrence | |
| Local | 9 (18) |
| Regional | 7 (14) |
| Locoregional | 1 (2) |
| Distant | 0 |
| Death | |
| Dead of disease | 13 (26) |
| Dead of other causes | 3 (6) |
All the cases demonstrated SMF within the tumor stroma with one exception (98%). Twenty‐seven (54%) cases were given scores of 2 and 3 for frequency of SMF, indicating total predominance or a high proportion of these cells. The remaining 23 (46%) cases were given scores 1, 0.5, and 0 for SMF indicating a spindle pattern, a focal distribution, or the absence of SMF, respectively.
The triple immunostaining assay showed that the membranous expression of E‐cadherin was reduced in all tumors at an extent that ranged from focal to complete loss. This reduction was seen in tumors with both high and low SMF. ‘Melting’ of the tumor cells into the adjacent stroma or intermingling with the abundant flanking SMF was observed, either in restrained regions or at many sites, in 18 (36%) cases. This trend was more frequently found in high SMF tumors. In most of these tumors, ‘melting’ occurred mainly in the carcinoma cells which lost expression of E‐cadherin, but in a few cases even cells with preserved E‐cadherin staining amalgamated with the adjacent αSMA‐positive SMF (Fig. 2).
Figure 2.

(A) The tumor cells show a preserved membranous E‐cadherin staining (blue color). Arrows point to a cell located among the tumor cells at the tumor–stroma interface. This cell is Ki‐67‐positive (purple nuclear color), similar to the adjacent neoplastic cells and features alpha‐smooth muscle actin (αSMA) positively stained cytoplasmic processes (brown color), which directly link it to the network of αSMA‐stained stromal myofibroblasts (brown color). (scale bar – 50 μm). (B) The tumor cells are negative for E‐cadherin; some of them are Ki‐67‐positive (purple nuclear color). The arrows indicate a zone where the interface between the tumor cells and the adjacent αSMA positively stained stromal myofibroblasts (brown color) is indistinct, and the tumor and the stromal compartments become one entity (scale bar – 50 μm).
Figure 3(A,B) presents two examples of tumors that demonstrate how the RSs were calculated on a practical basis. The tumor in Figure 3(A) was assigned a score of ‘0’ for WPOI, since it had a type 3 pattern of invasion (invading islands >15 cells per island). The tumor was given an LI a score of ‘1’ since it displayed discontinuous lymphoid tissue along the interface. It had a PNI a score of ‘0’, since there was no observable perineural invasion of any type in any of its parts. The final RS for this case was 1. Figure 3(B) is an example of a tumor with a RS of 7: it had a WPOI score of 1 (type 4 pattern of invasion characterized by invading islands <15 cells per island, up to single cell invasion), an LI score of 3 (limited or no lymphocytic response), and a PNI score of 3 (involving large nerves of ≥1 mm in diameter).
Figure 3.

(A) Assignment of risk score (RS) in a case of tongue carcinoma: worst pattern of invasion (WPOI) score = 0, lymphocytic infiltrate (LI) score = 1, perineural invasion (PNI) score = 0; total RS = 1 (hematoxylin–eosin; scale bar – 500 μm). (B) Assignment of RS in a case of tongue carcinoma: WPOI score = 1, LI score = 3, PNI score = 3; total RS = 7 (hematoxylin–eosin; scale bar – 500 μm).
Table 2 shows the distribution of cases between those with high scores of SMF (2 and 3) and low scores (0, 0.5, and 1) by age, margin status, risk score, recurrence, and death. Low scores of SMF were more frequent among the ‘old’ than the ‘young’ patients (65.2%vs 34.5%, respectively), but high SMF scores were more common among the ‘young’ than the ‘old’ patients (55.5%vs 44.5%, respectively). ‘Clean’ margins were achieved in 70% cases with low SMF scores and in 59% with high scores. With respect to the RSs, among cases with low SMF, there were slightly more cases with high RSs than low‐to‐intermediate RSs (56.5%vs 43.5%, respectively). In contrast, among cases with high SMF, high RSs predominated (92.6%). There was a significant association between SMF and RS (P = 0.006). No significant associations were found between SMF and age (P = 0.272), RS and margins (P = 0.175), or RS and age (P = 0.514).
Table 2.
Distribution of cases between ‘low’ (0–1) and ‘high’ scores (2–3) of SMF by age, margin status, risk score, disease recurrence, and dead of disease state
| SMF | Age | Margin status† | Risk score | Recurrence (%) | Dead of disease (%) | |||
|---|---|---|---|---|---|---|---|---|
| ‘Young’≤60 years (%) | ‘Old’ >60 years (%) | ‘Clean’ (%) | Positive (%) | Low‐to‐intermediate (0–2) (%) | High (≥3) (%) | |||
| Low (0–1) (n = 23) | 8 (34.8) | 15 (65.2) | 16 (69.6) | 6 (26.1) | 10 (43.5) | 13 (56.5) | 3 (13) | 2 (8.7) |
| High (2–3) (n = 27) | 15 (55.5) | 12 (44.5) | 16 (59.3) | 11 (40.7) | 2 (7.4) | 25 (92.6) | 14 (51.8) | 11 (40.7) |
†n = 49. SMF, stromal myofibroblasts.
The parameters of age, RS, SMF, and margin status were submitted to a univariate analysis (Table 3), which revealed that ‘young’ age, high RSs, high SMF scores, and positive margins had a negative impact on LR (P = 0.027, P = 0.011, P = 0.004 and P = 0.027, respectively). In regard to OS, only high SMF scores were found to have an adverse impact (P = 0.008), but not the other parameters. The Kaplan–Meier survival curve (Figure 4) shows that 82.3% patients with low SMF scores were free of recurrent disease 5 years after diagnosis vs 37.6% patients with high SMF scores. The Kaplan–Meier survival curve (Fig. 5) shows that 90.6% patients with low SMF scores were alive 5 years after the diagnosis in contrast to 61.2% patients with high SMF scores.
Table 3.
Univariate analysis by risk parameter
| Parameter (n) | LR | OS |
|---|---|---|
| P‐values | P‐values | |
| Age | ||
| ≤60 years (24) | 0.027 | 0.293 |
| >60 years (26) | ||
| RS | ||
| ≥3 (38) | 0.011 | 0.087 |
| 0–2 (12) | ||
| SMF | ||
| 2–3 (27) | 0.004 | 0.008 |
| 0–1 (23) | ||
| Margin status | ||
| Positive (17) | 0.027 | 0.264 |
| ‘Clean’ (32)† | ||
†One patient denied surgery at the primary site. LR, local recurrence; OS, overall survival; RS, risk score; SMF, stromal myofibroblasts.
Figure 4.
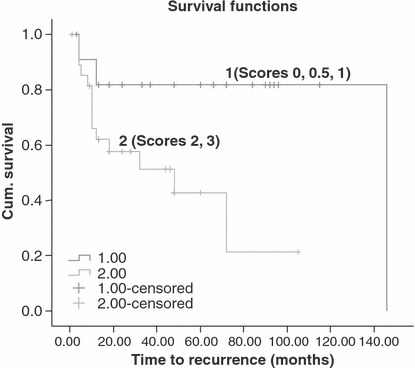
Kaplan–Meier analysis for local recurrence (LR) per frequency of stromal myofibroblasts (1 – scores of 0, 0.5, 1; 2 – scores of 2 and 3) (P = 0.004).
Figure 5.
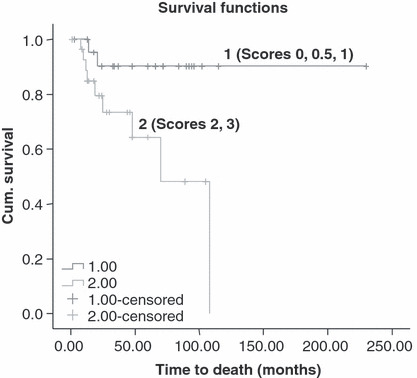
Kaplan–Meier analysis for overall survival (OS) per frequency of stromal myofibroblasts (1 – scores of 0, 0.5, 1; 2 – scores of 2 and 3) (P = 0.008).
We also carried out a multivariate analysis, which revealed that the high SMF scores were unfavorable prognostic factors for the 5‐year LR. The relative risks of recurrence for patients with high SMF scores was 4.369 (P = 0.014; 95% confidence interval [CI], 1.356–14.074). These results are relative to patients with low SMF scores. Age, RSs, and margin status were statistically insignificant with respect to their impact on LR.
Discussion
The present study focused on carcinomas from a single oral site, the tongue, and analyzed a series of cases at three different histopathologic levels: (i) the SMF; (ii) the RS according to the system proposed by Brandwein‐Gensler et al.,( 1 ) which itself is a combination of both tumor‐ and host‐related variables; and (iii) the margin status of the specimens, which continues to be regarded as one of the most important factors with respect to treatment strategies and impact on patient outcome. We found that high risk scores had an unfavorable impact on disease recurrence, which was in accordance to the study of Brandwein‐Gensler et al. ( 1 ) However, in contrast to their study, in which margin status had no prognostic potential on either recurrence or survival, we found that ‘positive margins’ had a negative influence on recurrence, albeit only by univariate analysis. In addition, we found that ‘young’ age was a determinant of recurrence. In general, oral cancer is a disease affecting individuals whose average age is 60 years.( 9 ) Several recent reports, however, have suggested that there has been an increasing incidence among young persons in many regions of the world.( 12 , 13 ) Interestingly, the oral site with the highest increase among the young patients is usually the tongue.( 12 , 14 ) Whether carcinomas of the oral tongue differ in their biological behavior and clinical outcomes compared to other oral sites is still controversial.( 15 , 16 ) Our results can serve as a baseline data for future analysis of histopathologic parameters and their association with clinical outcomes per oral site in order to provide evidence‐based differences in the biological behavior of the tumors among oral sites.
Most clinicians and pathologists consider the ‘positive/negative’ status of the margin as being the most significant predictor of tumor recurrence.( 17 , 18 ) A number of findings, however, raised several reservations about the unconditional domination of margin status on clinical outcomes. In particular, one study in head and neck cancer showed that one‐third of their reported patients with positive margins who were followed for 5 years and longer were alive and disease free, and that over half of them did not have recurrent disease.( 19 ) Conversely, another study showed that patients with small (T1 stage) tongue cancers with negative margins had an unexpectedly high recurrence rate of 25%.( 1 ) This prompted the designing of the modified multiparameter histopathologic RS system, which not only has been shown to be significantly predictive of recurrence and survival in oral SCC, but apparently more reliable than margin status with regard to these endpoints. It can be assumed that the selected histopathologic parameters of the RS system apparently reflected the biological characteristics of the tumor. As such, it could be assumed that it may have the potential to predict clinical outcome with a higher degree of reliability than the arbitrarily set and continuously changing parameter of tumor margin.
SMF have recently been shown to be associated with poor prognosis in several types of carcinomas, including breast( 20 ) and colorectal.( 21 ) There are only a few studies in the English literature in which SMF were examined in cases of oral cancer and it was found that a high frequency was significantly associated with poor survival.( 22 , 23 ) The findings of our study, which showed a significant association between frequency of these cells and the clinical outcomes of both recurrence and survival, are in general accordance with the previous works.
The current concept of the oncological surgery is primarily to remove all local malignant disease and leave no residual viable tumor cells.( 24 ) Thus far, this has been considered to be curative surgery. Accumulating recent findings that the tumor is not acting on its own but is rather surrounded by a ‘milieu’ of malignancy made up by the tumor‐associated stroma, which is created by and acts for the tumor itself, may lead to re‐thinking of this concept. SMF are now recognized to be the main effectors of tumor needs in terms of angiogenesis, production of metalloproteinases for collagen breakdown, and further invasion and suppression of the host immune response.( 3 , 4 , 5 ) One of the current evidence‐based theories is that at least some of the SMF actually represent malignant cells that have undergone epithelial–mesenchymal transformation (EMT).( 25 , 26 , 27 ) In our recent study, we were able to demonstrate the presence of tumor cells undergoing EMT in cases of human tongue carcinoma by using a double immunostaining technique.( 8 ) This was further supported by the triple immunostaining procedure, which showed that loss of expression of E‐cadherin, the milestone of the epithelial differentiation, was a frequent event among the carcinoma cells. It seemed that this process further advanced when tumor cells, usually devoid of E‐cadherin immunoreactivity, were in direct contact with the adjacent SMF and created an inseparable unit of tumor and stroma. Furthermore, the high plasticity of the neoplastic phenotype can produce an inverse process of mesenchymal‐to‐epithelial transition (MET)( 27 ) whereby the carcinoma‐derived stromal cells regain epithelial characteristics and establish new foci of tumor. These processes could provide a reasonable explanation for our observation that an abundance of SMF was found to be significantly associated with disease recurrence and patient survival. On practical grounds, even if the epithelial malignancy is entirely removed with ‘clean margins’, but part of the tumor‐associated stroma harboring EMT‐derived SMF is left behind, then the latter can act as a reservoir of malignant cells responsible for locoregional recurrent disease. These observations may serve as a basis for modifying the current calculation of the distance between the surgical margins and the tumor needed for what is considered to be a ‘clean’ margin. This should be more accurately defined as the distance between the surgical margins and the deepest aspect of the tumor stroma rather than the deepest aspect of the epithelial tumor. In addition, the current treatment modalities, aimed to combat only the epithelial malignancy, need to be fortified by anti‐stromal therapeutic agents.( 28 , 29 , 30 )
In light of the impact that both SMF and RS were found to have on disease recurrence and the significant inter‐relations between these parameters, it seems that a patient aged ≤60 years with a tumor characterized by abundant SMF and a high RS will have a significantly higher risk for recurrence than a patient >60 years with a tumor that features only a few SMF and a low RS. We suggest that further similar large‐scale studies should be performed in order to enable us to assemble a ‘tumor profile’ specific to each case. Such a profile should be the additive impact that SMF, RS, and age have on disease recurrence and patient survival. This will most likely modify both the surgical and the oncological treatment planning by switching from a universal, non‐discriminating protocol to an individually tailored approach.
Abbreviations
- EMT
epithelial‐mesenchymal transition
- LI
lymphocytic infiltrate
- LR
local recurrence
- OS
overall survival
- PNI
perineural invasion
- RS
risk score
- SMF
stromal myofibroblasts
- SCC
squamous cell carcinoma
- WPOI
worst pattern of invasion
References
- 1. Brandwein‐Gensler M, Teixeira MS, Lewins CM et al. Oral squamous cell carcinoma. Histologic risk assessment, but not margin status, is strongly predictive of local disease‐free and overall survival. Am J Surg Pathol 2005; 29: 167–78. [DOI] [PubMed] [Google Scholar]
- 2. De Wever O, Mareel M. Role of tissue stroma in cancer cell invasion. J Pathol 2003; 200: 429–47. [DOI] [PubMed] [Google Scholar]
- 3. Jewett A, Head C, Cacalano NA. Emerging mechanisms of immunosuppression in oral cancers. J Dent Res 2006; 85: 1061–73. [DOI] [PubMed] [Google Scholar]
- 4. De Wever O, Demetter P, Mareel M, Bracke M. Stromal myofibroblasts are drivers of invasive cancer growth. Int J Cancer 2008; 123: 2229–38. [DOI] [PubMed] [Google Scholar]
- 5. Voulgari A, Pintzas A. Epithelial–mesenchymal transition in cancer metastasis: mechanisms, markers and strategies to overcome drug resistance in the clinic. Biochimica Biophysica Acta 2009; 1796: 72–90. [DOI] [PubMed] [Google Scholar]
- 6. Thiery JP, Sleeman JP. Complex networks orchestrate epithelial‐mesenchymal transitions. Nat Rev Mol Cell Biol 2006; 7: 131–42. [DOI] [PubMed] [Google Scholar]
- 7. Nawshad A, LaGamba D, Polad A et al. Transforming growth factor‐β signaling during epithelial‐mesenchymal transformation: implications for embryogenesis and tumor metastasis. Cells Tissues Organs 2005; 179: 11–23. [DOI] [PubMed] [Google Scholar]
- 8. Vered M, Allon I, Buchner A, Dayan D. Stromal myofibroblasts accompany modifications in the epithelial phenotype of tongue dysplastic and malignant lesions. Cancer Microenviron 2009; doi: DOI: 10.1007/s12307-009-0020-0. [DOI] [PMC free article] [PubMed] [Google Scholar]
- 9. Johnson N, Francheschi S, Ferlay J et al. Squamous cell carcinoma. In: Barnes LB, Eveson JW, Reichart P, Sidransky D, eds. World Health Organization Classification of Tumors, Head and Neck Tumours, Pathology and Genetics. Lyon: IARCPress, 2005; 168–75. [Google Scholar]
- 10. Bankfalvi A, Krassort M, Vegh A, Felszeghi E, Piffko J. Deranged expression of the E‐cadherin/beta‐catenin complex and the epidermal growth factor receptor in the clinical evolution and progression of oral squamous cell carcinomas. J Pathol Med 2002; 31: 450–7. [DOI] [PubMed] [Google Scholar]
- 11. Batsakis JC. Surgical excision margins: a pathologist’s perspective. Adv Anat Pathol 1999; 6: 140–8. [DOI] [PubMed] [Google Scholar]
- 12. Muller S, Pan Y, Li R, Chi AC. Changing trends in oral squamous cell carcinoma with particular reference to young patients: 1971‐2006. The Emory University experience. Head Neck Pathol 2008; 2: 60–6. [DOI] [PMC free article] [PubMed] [Google Scholar]
- 13. Conway DI, Stockton DL, Warnakulasuriya KA, Ogden G, Macpherson LM. Incidence of oral and oropharyngeal cancer in United Kingdom (1990‐1999) – recent trends and regional variation. Oral Oncol 2006; 42: 586–92. [DOI] [PubMed] [Google Scholar]
- 14. Schantz SP, Yu GP. Head and neck cancer incidence in young Americans, 1973‐1997, with a special analysis of tongue cancer. Arch Otolaryngol Head Neck Surg 2002; 128: 268–74. [DOI] [PubMed] [Google Scholar]
- 15. Sathyan KM, Sailasree R, Jayasurya R et al. Carcinoma of tongue and the buccal mucosa represent different biological subentities of the oral carcinoma. J Cancer Res Clin Oncol 2006; 132: 601–9. [DOI] [PubMed] [Google Scholar]
- 16. Bell RB, Kademani D, Homer L, Dierks EJ, Potter BE. Tongue cancer: is there a difference in survival compared with other subsites in the oral cavity? J Oral Maxillofac Surg 2007; 65: 229–36. [DOI] [PubMed] [Google Scholar]
- 17. Sutton DN, Brown JS, Rogers SN, Vaughan ED, Woolgar JA. The prognostic implications of the surgical margins in oral squamous cell carcinoma. Int J Oral Maxillofac Surg 2003; 32: 30–4. [DOI] [PubMed] [Google Scholar]
- 18. Woolgar JA, Triantafyllou A. Pitfalls and procedures in the histopathological diagnosis of oral and oropharyngeal squamous cell carcinoma and a review of the role of pathology in prognosis. Oral Oncol 2009; 45: 361–85. [DOI] [PubMed] [Google Scholar]
- 19. Smeele LE, Leemans CR, Langendijk JA et al. Positive surgical margins in neck dissection specimens in patients with head and neck squamous cell carcinoma and the effect of radiotherapy. Head Neck 2000; 22: 559–63. [DOI] [PubMed] [Google Scholar]
- 20. Surowiak P, Murawa D, Materna V et al. Occurrence of stromal myofibroblasts in the invasive ductal breast cancer tissue is an unfavorable prognostic factor. Anticancer Res 2007; 27 (4C): 2917–24. [PubMed] [Google Scholar]
- 21. Tsujino T, Seshimo I, Yamamoto H et al. Stromal myofibroblasts predict disease recurrence for colorectal cancer. Clin Cancer Res 2007; 3: 2082–90. [DOI] [PubMed] [Google Scholar]
- 22. Kellermann MG, Sobral LM, Da Silva SD et al. Myofibroblasts in the stroma of oral squamous cell carcinoma are associated with poor prognosis. Histopathology 2007; 51: 849–53. [DOI] [PubMed] [Google Scholar]
- 23. Kawashiri S, Tanaka A, Noguchi N et al. Significance of stromal dsmoplasia and myofibroblast appearance at the invasive front in squamous cell carcinoma of the oral cavity. Head Neck in press 2009; 31: 1346–53. [DOI] [PubMed] [Google Scholar]
- 24. Baum M. Breast cancer – a challenge to the contemporary paradigm. Acta Oncol 1996; 35 (Suppl.): 3–6. [DOI] [PubMed] [Google Scholar]
- 25. Guarino M. Epithelial‐mesenchymal transition and tumor invasion. Int J Biochem Cell Biol 2007; 39: 2153–60. [DOI] [PubMed] [Google Scholar]
- 26. Yang J, Weinberg RA. Epithelial‐mesenchymal transition: at the crossroads of development and tumor metastasis. Dev Cell 2008; 14: 818–29. [DOI] [PubMed] [Google Scholar]
- 27. Hugo H, Ackland ML, Blik T et al. Epithelial‐mesenchymal and mesenchymal‐epithelial transitions in carcinoma progression. J Cell Physiol 2007; 213: 374–83. [DOI] [PubMed] [Google Scholar]
- 28. Tlsty TD, Coussens LM. Tumor stroma and regulation of cancer development. Annu Rev Pathol 2006; 1: 119–50. [DOI] [PubMed] [Google Scholar]
- 29. Micke P, Ostman A. Tumour‐stroma interaction: cancer‐associated fibroblasts as novel targets in anti‐cancer therapy? Lung Cancer 2004; 45 (Suppl. 2): S163–75. [DOI] [PubMed] [Google Scholar]
- 30. Hanna E, Quick J, Libutti SK. The tumor microenvironment: a novel target for cancer therapy. Oral Dis 2009; 15: 8–17. [DOI] [PubMed] [Google Scholar]