

Abstract
Anaplastic thyroid carcinoma (ATC) is among the most aggressive human malignancies, being responsible for the majority of thyroid cancer‐related deaths. Despite multimodal therapy including surgery, chemotherapy, and radiotherapy, the outcome of ATC is poor. The human ATC cell line MB1, derived from tumor tissue of a 57‐year‐old man with thyroid cancer and pronounced neutrophilia, was established from surgically excised tumor tissue. The karyotype of the cell line shows many chromosomal abnormalities. Preclinical investigations have shown antitumor activity and effectiveness of the BRAF kinase inhibitor Sorafenib and the proteasome inhibitor Bortezomib. After establishment of the MB1 cell line these agents were applied in vitro and, showing activity in a cell culture model, were also used for in vivo treatment. Sorafenib had some clinical effect, namely normalization of leucocytosis, but had no sustained impact on subsequent tumor growth and development of distant metastasis. Molecular diagnostics of the tumor demonstrated no BRAF mutations in exons 11 and 15 concordant with a rather modest effect of Sorafenib on MB1 cell growth. Clinical benefit was seen with subsequent bortezomib therapy inducing a temporary halt to lymph node growth and a progression‐free interval of 7 weeks. Our observations together with previous data from preclinical models could serve as a rationale for selecting those patients suffering from ATC most likely to benefit from targeted therapy. A prospective controlled randomized trial integrating kinase and proteasome inhibitors into a therapeutic regime for ATC is warranted. (Cancer Sci 2008; 99: 1847–1852)
Thyroid cancers affect approximately 33 000 patients newly diagnosed each year in the USA. Increasing incidence makes thyroid malignancies accountable for 4% of all new diagnosed cancer cases in woman, surpassing the incidence of ovarian cancer, kidney cancer, and leukemia.( 1 ) Anaplastic carcinoma of the thyroid (ATC) is a rare but very aggressive form of this cancer. Arising in the thyroid gland it accounts for less than 2% of all thyroid malignancies.
Well‐differentiated thyroid cancers have excellent clinical outcomes, with relative 5‐year survival rates above 95% despite their tendency for early metastasis. In this entity contemporary treatment strategies are focused on de‐escalation of therapy to protect patients from overtreatment. The less‐differentiated forms of thyroid cancers, most notably ATC, are among the most aggressive human tumors. Despite multimodal therapy, including surgery, chemotherapy, and radiotherapy, the mean survival is only 6 months.( 2 ) This discrepancy in clinical outcomes is most likely due to the quality and amount of genetic damage acquired by the anaplastic cancer cell during its malignant evolution.
The best‐examined pathway in thyroid cancer is the RTK–RAS–RAF–MAPK pathway. Pathogenesis of ATC is closely linked to mutational activation of proteins in this pathway. RAS mutations, conferring thyroid‐stimulating hormone (TSH)‐independent growth, are more frequent in poorly differentiated and anaplastic carcinomas (>50%) than in follicular or papillary carcinomas (5–10%).( 3 ) Among the RAF family members BRAF plays an exceptional role, being genetically altered in 29–83% of thyroid cancer cases.( 4 ) BRAF alterations are restricted to papillary thyroid cancers and their undifferentiated progeny, whereas well‐differentiated follicular neoplasms and dedifferentiated carcinomas arising from them do not bear BRAF mutations.( 5 , 6 ) In the latter case, the PI3K–AKT pathway seems to play a more important role in its pathogenesis.( 7 )
In the absence of sufficiently active conventional chemotherapy, novel approaches for the treatment of thyroid cancer, especially for the more aggressive subgroups, are needed. With an activated MAP kinase pathway identified as a key event in initiation and progression of thyroid cancers, substances targeting this pathway represent an attractive new option, but reports of so‐called ‘targeted therapeutics’ in ATC in vitro and especially in vivo are sparse.
To understand the biology of the heterogeneous group of ATC, cancer cell lines are valuable models, but only a few ATC cell lines have been reported and made available for research. We report the establishment of MB1, a cell line derived from tumor tissue of a patient with ATC, and the subsequent characterization of this cell line with comparison to hitherto known thyroid cancer cell lines. We also describe a novel therapeutic approach in the case of this patient, tailored according to knowledge derived from autologous cell culture experiments.
Materials and Methods
Tumor tissue. A biopsy of a large retrosternal mass in a 57‐year‐old male patient was diagnosed by three independent pathologists as ATC. Tissue was obtained with written informed consent and in accordance with the local ethical committee. An ATC cell line was derived from a 12 × 6 × 4‐cm tumor mass that was partially removed by open thoracotomy. The tissue was dissected under sterile conditions and immersed in culture medium and frozen in liquid nitrogen, or fixed in formalin for histopathological diagnosis.
Immunohistochemistry of the tumor showed strong positivity for vimentin and negativity for cytokeratin. Weak positivity of CD45, CD4, CD68, and CD163 was most likely due to antigen diffusion from bystander cells. No positivity was found for Melan A, Thyrosinase, myeloperoxidase (MPO), CD34, CD1, CD20, CD30, anaplastic lymphome kinase (ALK)‐1, placental alkaline phosphatase (PLAP), CD117, CD56, CD138, terminal desoxynucleotid transferase, Myogenin, MyoD, Desmin, smooth muscle actin (SMA), and carcinoembryonic antigen (CEA).
The residual tumor was treated with conventional radiotherapy of 55 Gy in 20 fractions starting 13 days after operation. After the occurrence of lymph node metastasis 7 weeks after operation, these were assessed repeatedly by fine‐needle aspiration biopsy for diagnosis confirmation and to monitor treatment.
Cell lines. Material from the tumor was prepared according to a previously described tumor dissection protocol( 8 ) and a cell line, designated MB1, was cultured from it. MB1 cells, epithelial‐like cells growing in monolayers, were propagated in RPMI medium supplemented with 10% fetal calf serum and 5% glutamine. Initially the culture was split every 7 days. After the sixth passage, splits became necessary every 3–4 days. At this time point the majority of cells began to change their shape from a large polygonal and spindle shape to a rounder appearance with a smaller nucleus : cytoplasm ratio. The contemporary cell line grows rapidly and the population doubling time is approximately 36 h. At passage 40 the MB1 cell line resembles ARO cells in appearance and cells are currently stable in culture for more than 6 months. The immunophenotypic features of the primary tumor (e.g. vimentin positivity and cytokeratin negativity) have been retained in the MB1 cells.
The cell lines FRO and ARO were generous gifts of Drs G. Salvatore and M. Santoro (Dipartimento di Biologia e Patologia Cellulare e Molecolare, Università di Napoli Federico II, Naples, Italy). MB1 cells were deposited at the DSMZ (German Collection of Microorganisms and Cell Cultures, Imhoffenstr. 7B, D‐38124 Braunschweig, Germany).
Reagents and drugs. For in vitro administration, doxorubicin (Doxorubicin; Ebewe, Unterach, Austria), docetaxel (Taxotere; Sanofi‐Aventis, Geneva, Switzerland), and bortezomib (Velcade; Cilag‐Janssen, Switzerland) were dissolved in sterile water, and sorafenib (Nexavar; Bayer, Germany) was dissolved in dimethyl‐sulfoxide (DMSO) (Sigma‐Aldrich) and stored at 4°C and –20°C, respectively, until further use. DMSO in the final solution did not exceed 0.2% (v/v). The final in vitro concentrations of drugs are indicated in the figure legends.
The treatment of the patient was as follows: sorafenib, 800 mg/day, was started on day 11 after surgery and continued for 3 months until there was pronounced disease progression. At this point bortezomib treatment was initiated according to a scheme with four applications per cycle of 1.5 mg/m2 on days 1, 8, 11, and 15, repeated every 3 weeks. Bortezomib treatment was terminated after two completed cycles following a severe gastrointestinal bleeding event.
Crystal violet colorimetric survival assay. Cell survival was examined using the colorimetric crystal violet assay.( 9 ) Briefly, cells were cultured in the presence of DMSO‐containing medium without or with sorafenib, doxorubicin, or bortezomib in a 96‐well microtiter plate. In each assay, DMSO‐containing medium and the respective drugs were left for 18 h. After removal of the medium, cells were fixed with methanol and stained with 50 mL crystal violet solution (0.5%) for 5 min. Next, cells were rinsed 10 times in tap water and the plates were dried on paper. After 1 h, 100 µL equal volume mixtures of ethanol and 0.1 M sodium phosphate were added and the absorbance at 570 nm was measured using an Emax microplate reader (Molecular Device, Sunnyvale, CA, USA) and analyzed with Softmax Pro V3.0 software. All experiments were repeated at least three times, and each experimental condition was repeated at least in triplicate wells in each experiment. Data reported are average values.
BRAF mutational status. Tumor DNA was extracted and examined for mutations in exons 11 and 15 (V600E mutation) with polymerase chain reaction–denaturant gradient gel electrophoresis as described by Perren et al.( 10 )
Cytokine measurements. Cytokines secreted by cell lines (granulocyte colony‐stimulating factor [G‐CSF], granulocyte‐macrophage colony stimulating factor [GM‐CSF]), with or without previous cytokine stimulation, were measured in duplicate using the bioplex cytokine multiplex assay (Bio‐Rad, Hercules, CA, USA), in accordance with the manufacturer's instructions.
Chromosomes. Cell culture cells at passage 36 were processed for cytogenetic analysis using standard methods (colcemid exposure, in 0.1 µg/mL for 1 h, 15 min in prewarmed hypotonic solution, KCl 0.56%, and fixation with methanol–glacial acetic acid, 3:1). Chromosomal changes were classified as clonal if present in at least two metaphases.
Ultrasound. The in vivo effect of bortezomib was monitored by sequential high‐frequency B‐Mode sonography and color‐power Doppler sonography (Nemio SSA‐550A; Toshiba) of axillary lymph node metastasis. A right axillary lymph node was chosen as the index node and sequential photographs were taken.
Statistical methods. Data were collected from triplicate independent experiments. For the evaluation of growth, the paired Student's t‐test was used to assess intragroup differences in vitro in the cells under treatment. Differences with P‐values less than 0.05 were considered to be significant. For calculations, the GraphPad QuickCalcs tools (GraphPad Software, San Diego, CA, USA) were used.
Results
Clinical course. The patient died 21 weeks after diagnosis of ATC. Marked leucocytosis accompanied the first phases of tumor development. Elevated serum G‐CSF levels were found. Reduction of tumor mass at day 24 transiently reduced leukocytes, but a rebound was seen within 10 days. Sorafenib and radiation therapy eradicated G‐CSF‐secreting cells leading to normal white blood cells from day 55 onward (Fig. 1).
Figure 1.

Total white blood cell (WBC) count and serum granulocyte colony‐stimulating factor (G‐CSF) values (gray boxes, pg/mL right ordinate) over time. Day 0 marks the first biopsy and time of initial diagnosis. At day 25 (highest WBC point, leukocytes = 116 000/µL, circulating CD34+ stem cells 0.11%, measured by fluorescence activated cell sorting [FACS]) a debulking operation was carried out. At day 36 sorafenib was introduced, 2 days later radiotherapy was initiated. At day 88 bortezomib was first given. From then on no abnormal WBC or elevated serum G‐CSF were recorded until death.
Histology. A biopsy of the cervical mass was taken. Histology revealed a mostly solid, partly necrotic malignant tumor invading the thyroid and adjacent soft tissue without any obvious component of a highly differentiated thyroid tumor component. Tumor cells showed anaplastic features with solid growth and epitheloid as well as spindle morphology with high nuclear pleomorphism and multifocal histiocyte‐like features (Fig. 2). In addition, there was a dense inflammatory infiltrate with numerous neutrophils and histiocytes. Tumor cells were focally positive for keratin, but negative for thyroid transcription factor 1 (TTF1) and thyreoglobulin. The proliferation rate, assayed by MB‐1 immunohistochemistry, was close to 100%.
Figure 2.
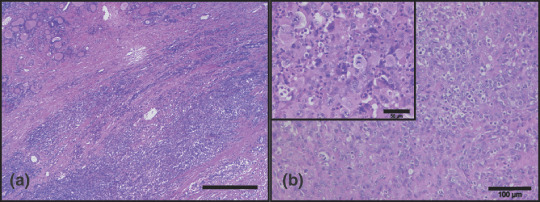
Histology of the tumor specimen. (a) Overview showing a mostly solid, partly necrotic tumor invading the thyroid (residual atrophic thyroid tissue on the upper left) and adjacent soft tissue without any obvious highly differentiated tumor component (original magnification, ×25; scale bar = 500 µm). (b) High power revealing an anaplastic malignant tumor with solid growth and epitheloid as well as spindle cells with high nuclear pleomorphism and focally a dense inflammatory infiltrate with numerous neutrophils (original magnification, ×100; scale bar = 100 µm). Inset shows a part of the tumor with increased mitotic activity and histiocyte‐like features of the tumor cells (original magnification, ×200).
Establishment and treatment of the ATC cell line MB1. Dissection of tumor cells led to the establishment of the MB1 cell line. During establishment of MB1 clonal evolution in the form of cells with varying morphology and karyograms was noted. Further, conditioned media of early cultures showed higher levels of G‐CSF compared to later cultures. The MB1 cells in later passages did not secrete significant amounts of G‐CSF (8 pg/mL) but could be stimulated to secrete G‐CSF (360 pg/mL) by the addition of interleukin‐1β (1 nmol/L). Tumor necrosis factor (TNF)‐α did not provoke G‐CSF secretion in MB1 cells (data not shown). This phenomenon reflected the clinical course of the patient with high serum levels of G‐CSF initially and normalized G‐CSF levels under treatment.
The MB1 cell line supplied valuable information with regard to the therapeutic management of this patient. MB1 cells were less sensitive to treatment with sorafenib compared to the existing lines ARO and FRO. At the time these experiments were done in vitro, the patient had developed distant metastases under treatment with sorafenib. The drug was stopped due to its low efficacy in vitro (3, 4). Of the variety of conventional and novel drugs tested, bortezomib showed the most promising efficacy against MB1 growth (Fig. 3)
Figure 3.

MB1, ARO, and FRO cells were treated with the drugs indicated for 36 h and cell viability was measured using the crystal violet assay. *P < 0.05; MB1 compared to the values of ARO or FRO.
Figure 4.
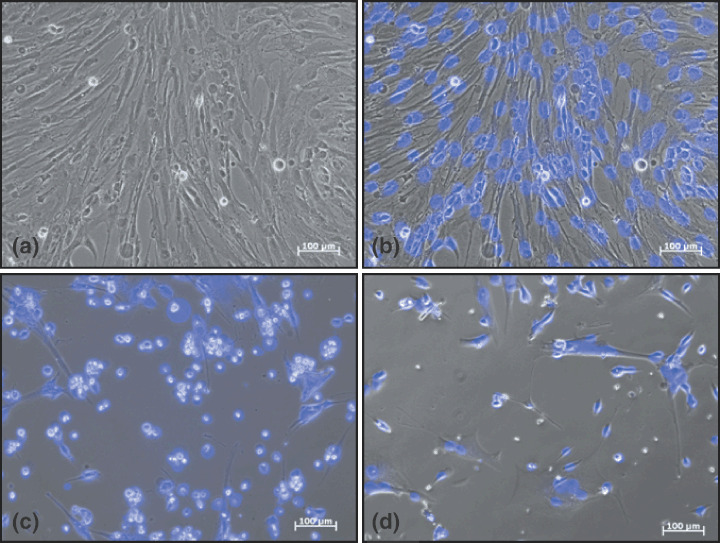
Photographs showing morphology of MB1 cells before and after treatment. (a) MB1 cells at early passage, large polygonal cells, few small rounded cells, few dead cells. (b) Overlay of (a) with blue DAPI staining of the nuclei. (c) Morphology of MB1 cells treated with sorafenib (10 µmol/L, 36 h). (d) Morphology of MB1 cells treated with bortezomib (20 µmol/L, 36 h).
Chromosome analysis. The modal chromosomal number in vitro ranged between 45 and 50. Near‐tetraploid cells with 90–95 chromosomes were also observed. The in vitro stem line was defined as: 45~50,X,der(1),der(1;4)(q10;p10),i(8)(q10),‐16,der(16)t(16;1;4) (q11.1;p12p36;q?28),der(18)t(12;18)(q24;q22),+20,+2mar,inc[7]/ 90~95, slx2[13] (Fig. 5).
Figure 5.
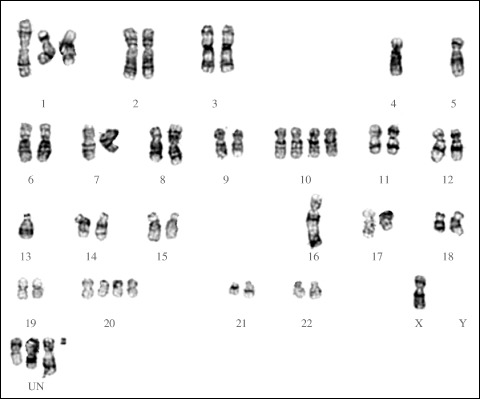
G‐banded karyogram of a cell from the MB1 cell line, showing absence of chromosome 4, alterations or loss of chromosomes 1, 9, 10, and 16, nullisomy Y, and four unclassifiable chromosomes. Details described in the text.
Sonography and cytology. Five weeks after completion of radiotherapy and under continued treatment with sorafenib, distant metastases developed. Pronounced and most visible were symmetrically painless axillary lymph nodes, but visceral metastases (liver, lung) and intra‐abdominal lymph node bulks were also present. Leukocyte counts remained within the normal range and serum G‐CSF was low (Fig. 2, day 120). In appreciation of the dismal prognosis the patient chose to be started on an experimental treatment with bortezomib instead of undergoing palliative treatment with conventional chemotherapy. Before and during therapy accessible lymph nodes were monitored weekly by ultrasound for size and morphology. Initially, pathological lymph nodes were hypoechogenic without microcalcifications (see Fig. 6b).
Figure 6.
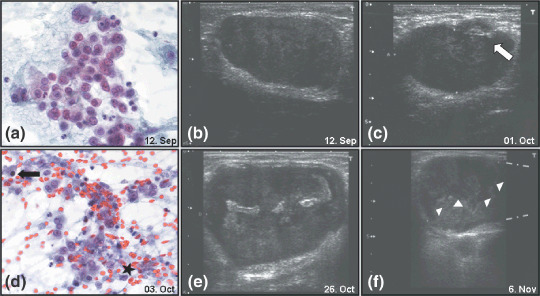
(a) Representative fine‐needle aspiration smear of axillary lymph node with isolated, highly pleomorphic tumor cells. Many polylobulated nuclei and dense, partially vacuolated cytoplasm (Papanicolau stain; original magnification, ×400). (b) The index lymph node before initiation of bortezomib therapy. (c) The index lymph node after the first cycle of bortezomib therapy, arrow indicating early morphological changes. (d) Representative fine‐needle aspiration smear of axillary lymph node under velcade therapy. Some vital tumor cells besides occasional apoptotic nuclei (arrow) and abundant necrotic debris (asterisk). (Papanicolau stain; original magnification, ×400). (e) Hyperechogenic zone within the center of the index lymph node, after the second cycle of bortezomib, with possible necrotic alterations. (f) The index lymph node after cessation of therapy, arrowheads demark the border of the presumed necrosis zone and apical renewed tumor formation. Gray dotted lines at the right picture margin denote size extension of the lymph node beyond the margin.
A fine‐needle aspiration of the lymph node carried out at that time showed an abundance of vital tumor cells (Fig. 6a). Three weeks after initiation of bortezomib treatment the stationary size of the index lymph node was recorded. In addition, early morphological changes and possible regressive changes in the tumor lymph nodes were documented (Fig. 6c). At that time another fine‐needle aspiration was carried out (Fig. 6d) showing many necrotic and apoptotic malignant cells and only a few vital tumor cells.
Three weeks later even more pronounced echogenicity within the tumor‐infiltrated lymph node was seen by ultrasound (Fig. 6e). At this point progression of the disease had been slowed, but a subsequent interruption of bortezomib therapy due to a bleeding complication led to reaccelerated growth of the tumor (Fig. 6f). A new hypoechogenic zone in the apical part of the lymph node was seen (area above the white arrowheads, Fig. 6f) and superseded the necrosis zone.
Discussion
Several ‘molecular‐targeted drugs’ have potential use in the treatment of ATC. Some have been introduced recently into the clinical setting for other diseases and now have a well‐known safety and efficacy profile.( 11 , 12 , 13 )
We report here our preclinical and clinical experience with the use of sorafenib and bortezomib in the treatment of ATC. The preclinical and early clinical data for sorafenib led us to use it in a case of a rapidly progressive ATC with dismal prognosis. The concomitant use with radiotherapy was found to be safe and a rapid normalization of paraneoplastic leucocytosis (within 10 days) indicated some clinical benefit. Serum G‐CSF levels were normalized under sorafenib treatment. No relevant side effects were noted, making the addition of sorafenib in the treatment of ATC feasible and safe. An early relapse in the form of lymph node metastasis reflected sorafenib's limited efficacy in this BRAF exons 11 and 15 unmutated tumor. With conventional chemotherapy adding no survival time after operation and radiation in metastasized ATC,( 14 ) bortezomib was chosen for second‐line therapy. Bortezomib showed an in vitro effect on the newly established cell line of this patient. This treatment led to a phase of stable disease for 7 weeks without notable clinical toxicity. A colorectal bleeding event, leading to the discontinuation of therapy, was more likely attributable to the patient's pre‐existing condition of diverticulosis and concomitant use of aspirin than to the bortezomib treatment. The patient died 4 months and 24 days after diagnosis and 2 months after the establishment of multiple distant metastasis and respiratory failure due to disease burden. Three cycles of bortezomib as a single‐agent therapy were effective and well tolerated, but ultimately did not have the potential to control this metastasized ATC. A recent study of bortezomib in squamous cell cancer has shown that proteasome inhibition has a profound effect on cell adhesion and migration.( 15 ) Thus, earlier usage of proteasome inhibitors in the course of ATC to prevent this tumor's notorious ability for metastatic spread should be considered. However, besides increasing adhesion and decreasing migration, bortezomib treatment led to an upregulation of epidermal growth factor receptor (EGFR) in squamous cell cancer cells. The authors suggested a combination of bortezomib with EGFR inhibitors to compensate for this unwanted side effect. The same might apply for ATC, where EGFR is overexpressed in 58% of cases.( 16 )
Another rationale for the use of bortezomib in ATC treatment is its potential to restore apoptosis by inhibition of the activation of nuclear factor‐κB in tumor cells and their microenvironment. Bortezomib has been previously tested in vitro alone and in combination with Apo2L/tumor necrosis factor‐related apoptosis‐inducing ligand (TRAIL).( 17 ) The drug had a sensitizing effect on TRAIL‐dependent apoptosis. As TRAIL has not yet been approved for clinical use, we had to apply bortezomib as a single agent. Given the efficacy of bortezomib in a monotherapy setting, future studies should focus on testing combination therapies that could have synergistic effects and potentially enhance bortezomib efficacy. Doxorubicin, a drug that activates the CD95–CD95 ligand system, was not very active in MB1 cells but remains a potential candidate for bortezomib combination therapy in ATC.
Although current knowledge of the pathogenic steps in ATC is incomplete, several contributing factors have been identified. The main events in the development of ATC appear to be activation of the RTK–RAS–RAF–MAPK pathway, p53 mutations, and EGFR overexpression. These insights allow for the following points of therapeutic intervention:
-
1
Multiple tyrosine kinase inhibitors against mainly BRAF‐driven proliferation.
-
2
Proteasome inhibition to overcome defects in apoptotic pathways (nuclear factor‐κB, p53, Bcl‐2)( 18 ) and decrease in metastatic potential.( 15 )
-
3
Targeting of EGFR signaling using monoclonal antibodies (cetuximab) or EGFR kinase inhibitors (erlotinib, gefitinib).( 19 )
The development of ATC is an acquisition of several sequential genetic defects; therefore, targeting of single pathways will often be insufficient to control tumor progression. Patient stratification according to their individual pathway defects will be the key to therapeutic success. In the complex scenario of ATC clinicians need a concise profile of the molecular defects underlying a given case to tailor the composition of a ‘targeted’ therapy. By incorporating gene mutation analysis and DNA and tissue arrays pathologists can provide vital information for improving outcomes in ATC. Efficient drugs against ATC are most likely already at hand, but studies to determine their most appropriate usage in this disease are needed.
In conclusion, the new ATC cell line MB1 can serve as an important in vitro model in the search for new therapeutic approaches against this extremely aggressive neoplasia. In the present study sorafenib and bortezomib have shown activity against anaplastic thyroid cancer in vitro and in vivo. Concomitant radiation therapy under sorafenib treatment was feasible and safe. Monotherapy of sorafenib was not enough to alter the course of the disease significantly, most likely due to clonal evolution. Bortezomib as second‐line therapy was well tolerated and induced necrosis of the tumor, as documented by imaging and histology.
Integration of sorafenib and bortezomib into a multimodal treatment of ATC should be further explored. Conducting a controlled randomized trial including bortezomib and sorafenib, the latter possibly depending on the individual tumor's BRAF status, could lead to a valuable new option for patients affected by this aggressive tumor.
Due to the rarity of this tumor such a trial will be hard to accomplish. In the absence of controlled data our approach of culturing autologous ATC cells for individual testing of drug responses may be the best possible alternative to support clinicians in their difficult decision making for this tumor entity.
Acknowledgments
We thank Norbert Markuly for excellent technical assistance.
References
- 1. Jemal A, Siegel R, Ward E, Murray T, Xu J, Thun MJ. Cancer statistics, 2007. CA A Cancer J Clin 2007; 57: 43–66. [DOI] [PubMed] [Google Scholar]
- 2. Are C, Shaha AR. Anaplastic thyroid carcinoma: biology, pathogenesis, prognostic factors, and treatment approaches. Ann Surg Oncol 2006; 13: 453–64. [DOI] [PubMed] [Google Scholar]
- 3. Garcia‐Rostan G, Zhao H, Camp RL et al . Ras mutations are associated with aggressive tumor phenotypes and poor prognosis in thyroid cancer. J Clin Oncol 2003; 21: 3226–35. [DOI] [PubMed] [Google Scholar]
- 4. Xing M. BRAF mutation in thyroid cancer. Endocr Relat Cancer 2005; 12: 245–62. [DOI] [PubMed] [Google Scholar]
- 5. Riesco‐Eizaguirre G, Gutierrez‐Martinez P, Garcia‐Cabezas MA, Nistal M, Santisteban P. The oncogene BRAF V600E is associated with a high risk of recurrence and less differentiated papillary thyroid carcinoma due to the impairment of Na+/I− targeting to the membrane. Endocr Relat Cancer 2006; 13: 257–69. [DOI] [PubMed] [Google Scholar]
- 6. Nikiforova MN, Nikiforov YE. Molecular genetics of thyroid cancer: implications for diagnosis, treatment and prognosis. Expert Rev Mol Diagn 2008; 8: 83–95. [DOI] [PubMed] [Google Scholar]
- 7. Riesco‐Eizaguirre G, Santisteban P. New insights in thyroid follicular cell biology and its impact in thyroid cancer therapy. Endocr Relat Cancer 2007; 14: 957–77. [DOI] [PubMed] [Google Scholar]
- 8. Oka Y, Kobayashi T, Fujita S et al . Establishment of a human anaplastic thyroid cancer cell line secreting granulocyte colony‐stimulating factor in response to cytokines. In Vitro Cell Dev Biol 1993; 29A: 537–42. [DOI] [PubMed] [Google Scholar]
- 9. Arizono Y, Yoshikawa H, Naganuma H, Hamada Y, Nakajima Y, Tasaka K. A mechanism of resistance to TRAIL/Apo2L‐induced apoptosis of newly established glioma cell line and sensitisation to TRAIL by genotoxic agents. Br J Cancer 2003; 88: 298–306. [DOI] [PMC free article] [PubMed] [Google Scholar]
- 10. Perren A, Schmid S, Locher T et al . BRAF and endocrine tumors: mutations are frequent in papillary thyroid carcinomas, rare in endocrine tumors of the gastrointestinal tract and not detected in other endocrine tumors. Endocr Relat Cancer 2004; 11: 855–60. [DOI] [PubMed] [Google Scholar]
- 11. Salvatore G, De Falco V, Salerno P et al . BRAF is a therapeutic target in aggressive thyroid carcinoma. Clin Cancer Res 2006; 12: 1623–9. [DOI] [PubMed] [Google Scholar]
- 12. Kim S, Yazici YD, Calzada G et al . Sorafenib inhibits the angiogenesis and growth of orthotopic anaplastic thyroid carcinoma xenografts in nude mice. Mol Cancer Ther 2007; 6: 1785–92. [DOI] [PubMed] [Google Scholar]
- 13. Mitsiades CS, McMillin D, Kotoula V et al . Antitumor effects of the proteasome inhibitor bortezomib in medullary and anaplastic thyroid carcinoma cells in vitro . J Clin Endocr Metab 2006; 91: 4013–21. [DOI] [PubMed] [Google Scholar]
- 14. O’Neill JP, O’Neill B, Condron C, Walsh M, Bouchier‐Hayes D. Anaplastic (undifferentiated) thyroid cancer: improved insight and therapeutic strategy into a highly aggressive disease. J Laryngol Otol 2005; 119: 585–91. [DOI] [PubMed] [Google Scholar]
- 15. Lorch JH, Thomas TO, Schmoll HJ. Bortezomib inhibits cell–cell adhesion and cell migration and enhances epidermal growth factor receptor inhibitor‐induced cell death in squamous cell cancer. Cancer Res 2007; 67: 727–34. [DOI] [PubMed] [Google Scholar]
- 16. Elliott DD, Sherman SI, Busaidy NL et al . Growth factor receptors expression in anaplastic thyroid carcinoma: potential markers for therapeutic stratification. Hum Pathol 2008; 39: 15–20. [DOI] [PubMed] [Google Scholar]
- 17. Poulaki V, Mitsiades CS, Kotoula V et al . Regulation of Apo2L/tumor necrosis factor‐related apoptosis‐inducing ligand‐induced apoptosis in thyroid carcinoma cells. Am J Pathol 2002; 161: 643–54. [DOI] [PMC free article] [PubMed] [Google Scholar]
- 18. Ishii Y, Waxman S, Germain D. Targeting the ubiquitin–proteasome pathway in cancer therapy. Anticancer Agents Med Chem 2007; 7: 359–65. [DOI] [PubMed] [Google Scholar]
- 19. Zwick E, Bange J, Ullrich A. Receptor tyrosine kinases as targets for anticancer drugs. Trends Mol Med 2002; 8: 17–23. [DOI] [PubMed] [Google Scholar]