

Abstract
Treatment of animals bearing multidrug resistant (MDR) tumor cells with P‐glycoprotein (P‐gp) substrates could worsen host survival. It is assumed that this is due to increased tumor metastasis. To clarify the mechanism(s) underlying this observation, the MDR human breast cancer cell line, MCF‐7/AdrR, and its sensitive parental line, MCF‐7, was treated with various concentrations of P‐gp substrate drugs (vincristine, paclitoxel, adriamycin) and a P‐gp non‐substrate drug (bleomycin) in serum‐free media. Increased production of CD147, and matrix metalloproteinases (MMP)‐2, ‐9 was observed only in MDR cancer cells exposed to P‐gp substrates, as determined using real‐time polymerase chain reaction, western blotting and zymography. Correspondingly, P‐gp substrates significantly enhanced the in vitro invasion abilities of MCF‐7/Adr cells. It was also found that the drug‐induced promotion of CD147, and MMP‐2, ‐9 was consistent with increased expression of epidermal growth factor receptor (EGFR) and that inhibition of either EGFR or P‐gp activity could significantly interrupt the downstream effects, and so inhibit in vitro invasion abilities motivated by P‐gp substrates. These results imply that treatment of MDR tumors with P‐gp substrates could adversely affect therapeutic outcomes through modulating the production of CD147, MMP‐2, ‐9, and EGFR, and suggest that this effect may be initiated by the transporter function of P‐gp. (Cancer Sci 2007; 98: 1767–1774)
Both multidrug resistant (MDR) cells and tumor metastasis remain formidable obstacles to the effective treatment of human cancer. These two properties of malignant tumors have been studied extensively and there is evidence suggesting a functional linkage between the two phenotypes.( 1 , 2 , 3 ) P‐glycoprotein (P‐gp), the MDR‐1 gene product, functions as the energy‐dependent efflux pump for a variety of structurally diverse chemotherapeutic agents, which are called P‐gp substrates, and so decreases the intracellular drug accumulation.( 4 ) Yang et al. observed that treatment of animals bearing MDR‐1‐transfected leukemic cells with P‐gp substrates worsened host survival, which was closely associated with increased metastasis, compared with treatment with vehicle or non‐P‐gp substrates.( 5 ) In the authors’ previous research, significant up‐regulation of CD147 and matrix metalloproteinases (MMP)‐2, ‐9 accompanied by the acquisition of MDR in breast cancer cells has been detected. CD147 is overexpressed in many MDR cancer cell lines.( 6 ) Because one of the many functions of CD147 is to regulate the production of certain MMP, the expression of CD147 correlates with the invasiveness of tumor cells.( 7 ) To elucidate the molecular mechanism(s) underlying Yang's observation, the effects of P‐gp substrate drugs on the production of CD147 and MMP‐2, ‐9 were investigated. As a result, promotion of CD147 and MMP‐2, ‐9 that was induced by P‐gp substrates in MDR breast cancer cells was observed. In the past, epidermal growth factor receptor (EGFR) has been described as the major regulatory effector that is able to stimulate the production of CD147.( 8 ) Moreover, one characteristic of MDR cell lines is an increased expression of EGFR compared with that of the parental line.( 9 ) Because of this, EGFR and its relationship with P‐gp was further explored, due to their possible involvement in elevated production of CD147 and MMP‐2, ‐9 induced by P‐gp substrates.
Materials and Methods
Chemicals and reagents. P‐gp substrates, which are paclitaxel (Sigma, St Louis, MO, USA), vincristine (Sigma) and adriamycin (Sigma), and a non‐P‐gp substrate, bleomycin, (Alexis Biochemicals, San Diego, CA, USA), were dissolved in either sterile dimethylsulfoxide (DMSO; paclitaxel) or in sterile distilled water (vincristine, adriamycin and bleomycin). They were stored frozen as stock solutions and were thawed prior to use. The peak plasma concentrations (PPC) of bleomycin, paclitaxel, vincristine and adriamycin are 3 µg/mL, 4.5 µg/mL, 0.5 µg/mL and 0.4 µg/mL, respectively. AG1478 was from Calbiochem‐Novabiochem (La Jolla, CA, USA) and the monoclonal anti‐P‐gp neutralizing antibody was purchased from Calbiochem (Darmstadt, Germany). All other reagents were of analytical grades and obtained from commercial sources.
Cell culture. The human mammary carcinoma cell line, MCF‐7, was established from pleural effusion, and its MDR counterpart, MCF‐7/Adr,( 10 ) was further derived for high P‐gp expression. Cells were cultured in RPMI 1640 (Gibco BRL, Karlsruhe, Germany) containing 10% fetal bovine serum (FBS; PAA), 100 U/mL penicillin, and 100 µg/mL streptomycin at 37°C in a humidified atmosphere containing 5% CO2. For consistent MDR‐1 gene expression, MCF‐7/Adr cells were maintained in the presence of adriamycin. All cell lines were discarded after 3 months and new lines were obtained from frozen stocks.
Reverse transcription and quantitative real‐time polymerase chain reaction. Total RNA of cells were extracted using Tripure isolation reagent (Sangon, Shanghai, China). The RNA samples were subjected to reverse transcription (RT) with 2 µg RNA, Oligo (dT)18, dNTP, and reaction buffer supplied with M‐MLV reverse transcriptase (Promega, Madison, WI, USA). Real‐time polymerase chain reaction (PCR) reactions were then performed in 20 µL solution with 2 µg cDNA and 1 mM of each forward and reverse primer and 2 × SYBR green mix (Takara, Shuzo, Kyoto, Japan). Changes in the mRNA expression level were calculated following normalization with glyceraldehyde‐3‐phosphate dehydrogenase (GAPDH). Relative gene expression was determined by the fluorescence intensity ratio of the target gene to GAPDH. The primers used in the real‐time PCR reactions were designed based on information from the human genomic data base. The following are the primers used for the specific amplification of GAPDH, CD147, MMP‐2, MMP‐9 and EGFR: GAPDH forward primer: 5′‐CATCAAGAAGGTGGTGAAGC‐3′, and reverse primer: 5′‐GGAAATTGTGAGGGAGATGC‐3′; CD147 forward primer: 5′‐CGAGATCCAGTGGTGGTTTG‐3′, and reverse primer: 5′‐TCGTAAGTGCCCGTGTCC‐3′; MMP‐2 forward primer: 5′‐GGCCTCTCCTGACATTGACCTT‐3′, and reverse primer: 5′‐GGCCTCGTATACCGCATCAATC‐3′; MMP‐9 forward primer: 5′‐TTTGACAGCGACAAGAAGTGG‐3′, and reverse primer: 5′‐A GGGCGAGGACCATAGAGG‐3′; EGFR forward primer: 5′‐CCAAGGCACGAGTAACAAGC‐3′; and reverse primer: 5′‐CCAAATTCCCAAGGACCACC‐3′.
Western blot. Cells were harvested and lysed in lysis buffer (0.5% Nonidet P (NP)‐40, 10 mM Tris, pH 7.4, 150 mM NaCl, 1mM ethylene diamine tetra‐acetic acid [EDTA], 1 mM Na3VO4) containing protease inhibitors (1 mM phenylmethylsulfonyl fluoride [PMSF]). Proteins (50 µg/well) were then subjected to standard sodium dodecyl sulfate–polyacrylamide gel electrophoresis (SDS‐PAGE). For western blotting analysis, proteins were transferred to polyvinylidene fluoride (PVDF) membranes, then blocked in 8% non‐fat milk in 10 mM Tris, pH 7.5, 100 mM NaCl, 0.1% (w/v) Tween 20 for 1 h. The membranes were first incubated with antibodies against β‐actin (Sigma), CD147 (Santa Cruz Biotechnology, Santa Cruz, CA, USA), MMP‐2 (Neomarkers, Fremont, CA, USA), MMP‐9 (Santa Cruz Biotechnology) and EGFR (Santa Cruz Biotechnology), respectively, overnight at 4°C, followed by 1 h incubation with the appropriate secondary antibody. For quantification of protein expression levels, AlexaFluor‐700/800 nm secondary conjugates were used and PVDF membranes were analyzed using the Odyssey Infra‐Red Imaging System and software (Li‐Cor Biosciences, Lincoln, NE, USA) according to the manufacturer's instructions. The relative intensity ratio of all immunoblots were quantified using the Odyssey system.
Zymographic analysis. MMP‐2 and MMP‐9 enzymatic activities were assayed using gelatin zymography. Conditioned media from cells cultured in the absence of serum for 48 h were collected and concentrated 20‐fold using Centriprep YM‐30 (Millipore, Bedford, MA, USA). Samples were then mixed with Laemmli loading buffer and electrophoresed on a gelatin containing 8% SDS polyacrylamide gel. After electrophoresis, the gel was washed twice with washing buffer (50 mM Tris‐HCl, pH 7.5, 100 mM NaCl, 2.5% Triton X‐100), followed by a brief rinsing in washing buffer without Triton X‐100. The gel was then incubated with incubation buffer (50 mM Tris‐HCl, pH 7.5, 150 mM NaCl, 10 mM CaCl2, 0.02% NaN3, 1 µM ZnCl2) at 37°C. After incubation, the gel was stained and destained. A clear zone of gelatin digestion was represented with the MMP activity.
In vitro invasion assay. Cell invasion assays were performed using Transwells (8 mm pore size, Corning Costar Corp., Acton, MA, USA). Matrigel was diluted to a concentration of 2 mg/mL, and 50 µL of this solution was placed on the lower surface of a polycarbonate filter and air‐dried. After being rinsed with phosphate‐buffered saline (PBS), the filters were placed into wells and 700 µL of Dulbecco's modified Eagle's medium (DMEM) containing 10% bovine serum was added into the lower compartment. Freshly trypsinized and washed cells (MCF‐7/Adr) were suspended at 2 × 10⁵/mL in DMEM containing 1% bovine serum and preincubated for 10 min with or without blocking antibodies. Then the cell suspensions (150 µL) with various concentrations of chemotherapeutic agents were placed in the upper compartments and the cells were allowed to invade for 24 h at 37°C in a 5% CO2 humidified incubator. After incubation, cells were removed from the upper surface of the filter with cotton swabs; cells that had invaded the bottom surface of the filter were fixed with methanol and stained with hematoxylin and eosin. The invasiveness was determined by counting the penetrating cells under a microscope at ×200 magnification of 10 random fields in each well. Each experiment was performed in triplicate.
Statistical analysis. Statistics were conducted using SPSS software. The results were presented with mean ± standard errors (SEM). anova, Student's t‐test analysis and Dunnett's multiple comparison tests were used to compare mean values. A P‐value <0.05 was defined as statistically significant.
Results
Resistant cell line has diverse metastasis‐related characteristics compared with parental cell line. In order to study the mechanism underlying Yang's observation, two human mammary carcinoma cell lines were chosen. One was selected for resistance to adriamycin (MCF‐7/Adr) and the other was sensitive to chemotherapeutic agents (MCF‐7). The resistant cell line exhibited significantly elevated production of CD147, MMP‐2, ‐9 and EGFR (Fig. 1), and much higher invasion activity compared with its parental cells (data not shown), as determined using real‐time PCR, western blot, zymography and in vitro invasion assay, respectively.
Figure 1.
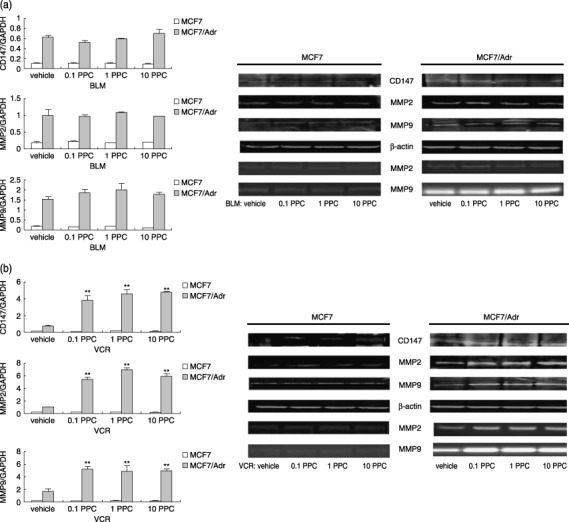
Production of CD147 and matrix metalloproteinase (MMP)‐2, ‐9 in MCF‐7 and MCF‐7/Adr cells when treated with various drugs. After cells were treated with drugs for 24 h, total RNA were extracted, and lysates were electrophoresed on 8% sodium dodecyl sulfate (SDS)‐polyacrylamide gel or on gelatin containing 8% SDS‐polyacrylamide gel. Endogenous CD147 and MMP‐2, ‐9 were measured using real‐time polymerase chain reaction, western blot and zymography, respectively. (a) CD147 and MMP‐2, ‐9 mRNA, protein and MMP‐2, ‐9 activities in MCF‐7, MCF‐7/Adr cells exposed to bleomycin (0.1 peak plasma concentration [PPC], 1.0 PPC, 10.0 PPC). (b) CD147 and MMP‐2, ‐9 mRNA, protein and MMP‐2, ‐9 activities in MCF‐7, MCF‐7/Adr cells exposed to vincristine (0.1 PPC, 1.0 PPC, 10.0 PPC). (c) CD147 and MMP‐2, ‐9 mRNA, protein and MMP‐2, ‐9 activities in MCF‐7, MCF‐7/Adr cells exposed to paclitaxel. (d) CD147 and MMP‐2, ‐9 mRNA, protein and MMP‐2, ‐9 activities in MCF‐7, MCF‐7/Adr cells exposed to adriamycin (0.1 PPC, 1.0 PPC, 10.0 PPC). ADM, adriamycin; BLM, bleomycin; Toxel, paclitoxel; VCR, vincristine. Bar graphs represent mean ± SEM of three independent experiments. Results are representative of three similar experiments. **P < 0.05 versus vehicle group.
Only MCF‐7/Adr cells treated with P‐gp substrates produced more CD147 and MMP‐2, ‐9. As CD147 overexpression has been reported in many MDR cancers and is shown to increase tumor cell invasion,( 6 , 7 ) it was hypothesized whether P‐gp substrates accelerated cancer progression through inducing CD147 and MMP‐2, ‐9 production. For this purpose, the resistant cells and the parental cells were cultured in the presence of various concentrations of chemotherapeutic agents (0.1 PPC, 1.0 PPC and 10.0 PPC) for 24 h. After cells were treated with bleomycin, production of CD147 and MMP‐2, ‐9 in both MCF‐7 and MCF‐7/Adr cells remained unchanged (P > 0.05), as shown in Fig. 1a and Table 1. However, incubation with vincristine, paclitoxel and adriamycin resulted in remarkable promotion of CD147 and MMP‐2, ‐9 on transcription, expression and gelatinase levels in MCF‐7/Adr cells (P < 0.05), while MCF‐7 cells showed no similar responses (Fig. 1b–d, Table 1). Moreover, it was also interesting to note that there were no differences in the extent to which CD147 and MMP‐2, ‐9 were promoted between various drug doses (0.1 PPC → 1.0 PPC → 10.0 PPC) in the resistant cell line, suggesting that the P‐gp substrate‐induced effects were not dose‐dependent (Fig. 1b–d). To further explore the possible role of CD147 and MMP‐2, ‐9 in the in vivo phenomena of Yang's study, the invasion activities of tumor cells were assayed in vitro in trans‐well chambers. As shown in Fig. 2, only MCF‐7/Adr cells exposed to P‐gp substrates showed much higher activities when compared with corresponding controls (P < 0.05); similarly, no dose‐dependent effects were observed.
Table 1.
Statistical quantification and comparison of the relative immunoblot intensities
| MCF‐7 | MCF‐7/Adr | ||||||||
|---|---|---|---|---|---|---|---|---|---|
| EGFR | CD147 | MMP‐2 | MMP‐9 | EGFR | CD147 | MMP‐2 | MMP‐9 | ||
| Vehicle | 0.222 ± 0.013 | 0.103 ± 0.005 | 0.192 ± 0.006 | 0.164 ± 0.003 | 0.585 ± 0.084 | 0.524 ± 0.037 | 0.585 ± 0.046 | 0.436 ± 0.036 | |
| 0.1 PPC | 0.257 ± 0.018 | 0.092 ± 0.003 | 0.231 ± 0.009 | 0.128 ± 0.002 | 0.556 ± 0.067 | 0.526 ± 0.026 | 0.562 ± 0.039 | 0.409 ± 0.042 | |
| BLM | 1.0 PPC | 0.264 ± 0.019 | 0.099 ± 0.011 | 0.168 ± 0.007 | 0.157 ± 0.009 | 0.562 ± 0.064 | 0.563 ± 0.014 | 0.557 ± 0.034 | 0.453 ± 0.046 |
| 10.0 PPC | 0.253 ± 0.017 | 0.089 ± 0.008 | 0.208 ± 0.009 | 0.109 ± 0.004 | 0.558 ± 0.060 | 0.578 ± 0.086 | 0.553 ± 0.0.36 | 0.408 ± 0.049 | |
| Vehicle | 0.277 ± 0.012 | 0.156 ± 0.026 | 0.196 ± 0.063 | 0.168 ± 0.033 | 0.559 ± 0.072 | 0.589 ± 0.168 | 0.626 ± 0.163 | 0.498 ± 0.023 | |
| 0.1 PPC | 0.265 ± 0.017 | 0.092 ± 0.007 | 0.235 ± 0.059 | 0.176 ± 0.059 | 1.423 ± 0.265* | 2.995 ± 0.257* | 2.264 ± 0.265* | 1.364 ± 0.165* | |
| VCR | 1.0 PPC | 0.296 ± 0.013 | 0.127 ± 0.034 | 0.224 ± 0.007 | 0.197 ± 0.056 | 1.681 ± 0.217* | 2.628 ± 0.265* | 2.852 ± 0.252* | 1.956 ± 0.186* |
| 10.0 PPC | 0.254 ± 0.020 | 0.113 ± 0.005 | 0.186 ± 0.016 | 0.143 ± 0.053 | 1.551 ± 0.298* | 2.062 ± 0.289* | 2.016 ± 0.246* | 1.793 ± 0.177* | |
| Vehicle | 0.196 ± 0.015 | 0.162 ± 0.036 | 0.168 ± 0.002 | 0.158 ± 0.006 | 0.556 ± 0.056 | 0.543 ± 0.158 | 0.725 ± 0.028 | 0.492 ± 0.029 | |
| 0.1 PPC | 0.223 ± 0.020 | 0.093 ± 0.005 | 0.206 ± 0.035 | 0.126 ± 0.026 | 1.694 ± 0.221* | 2.726 ± 0.367* | 2.364 ± 0.268* | 1.246 ± 0.168* | |
| Toxel | 1.0 PPC | 0.167 ± 0.011 | 0.129 ± 0.049 | 0.197 ± 0.019 | 0.162 ± 0.019 | 1.865 ± 0.212* | 2.937 ± 0.249* | 2.956 ± 0.366* | 1.337 ± 0.162* |
| 10.0 PPC | 0.209 ± 0.016 | 0.108 ± 0.069 | 0.143 ± 0.005 | 0.166 ± 0.035 | 1.496 ± 0.169* | 2.927 ± 0.214* | 2.793 ± 0.496* | 1.334 ± 0.149* | |
| Vehicle | 0.131 ± 0.016 | 0.085 ± 0.023 | 0.193 ± 0.011 | 0.133 ± 0.027 | 0.555 ± 0.068 | 0.579 ± 0.028 | 0.568 ± 0.031 | 0.486 ± 0.021 | |
| 0.1 PPC | 0.182 ± 0.021 | 0.090 ± 0.021 | 0.231 ± 0.014 | 0.149 ± 0.031 | 1.421 ± 0.232* | 3.038 ± 0.401* | 1.127 ± 0.213* | 0.973 ± 0.075* | |
| ADM | 1.0 PPC | 0.124 ± 0.011 | 0.083 ± 0.016 | 0.187 ± 0.020 | 0.139 ± 0.028 | 1.357 ± 0.268* | 3.216 ± 0.509* | 1.222 ± 0.109* | 0.993 ± 0.084* |
| 10.0 PPC | 0.155 ± 0.019 | 0.081 ± 0.022 | 0.176 ± 0.013 | 0.126 ± 0.020 | 1.353 ± 0.201* | 3.194 ± 0.403* | 1.236 ± 0.225* | 1.025 ± 0.094* | |
| Vehicle | 0.517 ± 0.042 | 0.533 ± 0.047 | 0.365 ± 0.018 | ||||||
| 0.1 PPC | 0.520 ± 0.031 | 0.517 ± 0.048 | 0.394 ± 0.025 | ||||||
| VCR + AG1478 | 1.0 PPC | 0.513 ± 0.033 | 0.593 ± 0.039 | 0.352 ± 0.021 | |||||
| 10.0 PPC | 0.534 ± 0.029 | 0.569 ± 0.032 | 0.386 ± 0.029 | ||||||
| Vehicle | 0.538 ± 0.025 | 0.464 ± 0.033 | 0.328 ± 0.024 | ||||||
| 0.1 PPC | 0.523 ± 0.033 | 0.473 ± 0.039 | 0.320 ± 0.013 | ||||||
| Toxel + AG148 | 1.0 PPC | 0.517 ± 0.036 | 0.452 ± 0.035 | 0.326 ± 0.013 | |||||
| 10.0 PPC | 0.521 ± 0.023 | 0.456 ± 0.038 | 0.335 ± 0.010 | ||||||
| Vehicle | 0.528 ± 0.024 | 0.453 ± 0.037 | 0.319 ± 0.012 | ||||||
| 0.1 PPC | 0.519 ± 0.034 | 0.461 ± 0.031 | 0.333 ± 0.017 | ||||||
| ADM + AG148 | 1.0 PPC | 0.520 ± 0.040 | 0.484 ± 0.038 | 0.342 ± 0.024 | |||||
| 10.0 PPC | 0.517 ± 0.023 | 0.447 ± 0.032 | 0.344 ± 0.016 | ||||||
| Vehicle | 0.531 ± 0.077 | 0.507 ± 0.033 | 0.613 ± 0.043 | 0.403 ± 0.018 | |||||
| 0.1 PPC | 0.557 ± 0.062 | 0.512 ± 0.031 | 0.622 ± 0.037 | 0.394 ± 0.027 | |||||
| VCR + P‐gp Ab | 1.0 PPC | 0.536 ± 0.068 | 0.509 ± 0.024 | 0.619 ± 0.040 | 0.406 ± 0.022 | ||||
| 10.0 PPC | 0.533 ± 0.064 | 0.504 ± 0.030 | 0.622 ± 0.038 | 0.389 ± 0.025 | |||||
| Vehicle | 0.498 ± 0.055 | 0.483 ± 0.023 | 0.531 ± 0.030 | 0.400 ± 0.011 | |||||
| Toxel + P‐gp Ab | 0.1 PPC | 0.519 ± 0.062 | 0.476 ± 0.019 | 0.554 ± 0.027 | 0.391 ± 0.029 | ||||
| 1.0 PPC | 0.497 ± 0.058 | 0.473 ± 0.025 | 0.540 ± 0.035 | 0.408 ± 0.016 | |||||
| 10.0 PPC | 0.493 ± 0.050 | 0.491 ± 0.022 | 0.568 ± 0.038 | 0.406 ± 0.028 | |||||
| Vehicle | 0.548 ± 0.066 | 0.519 ± 0.028 | 0.609 ± 0.048 | 0.404 ± 0.010 | |||||
| 0.1 PPC | 0.563 ± 0.054 | 0.522 ± 0.036 | 0.627 ± 0.036 | 0.402 ± 0.026 | |||||
| ADM + P‐gp Ab | 1.0 PPC | 0.568 ± 0.057 | 0.507 ± 0.021 | 0.615 ± 0.031 | 0.401 ± 0.022 | ||||
| 10.0 PPC | 0.532 ± 0.048 | 0.503 ± 0.031 | 0.629 ± 0.036 | 0.404 ± 0.013 | |||||
P < 0.05 versus control cells. All immunoblot intensities were subjected to quantitative analyses using the Odyssey Infra‐Red Imaging System and normalization with β‐actin as reported in Materials and Methods. Each assay was performed in triplicate and repeated three times. The relative immunoblot intensity is presented as mean ± standard errors. Ab, antibody; ADR, adriamycin; BLM, bleomycin; EGFR, epidermal growth factor receptor; MMP, matrix metalloproteinase; PPC, peak plasma concentrations; Toxel, paclitoxel; VCR, vincristine.
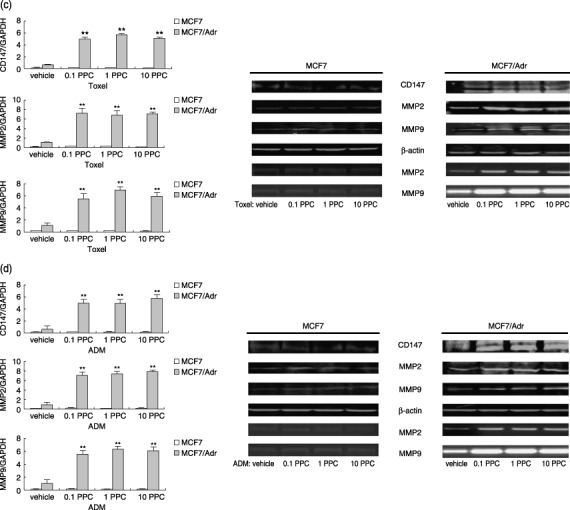
Figure 2.
Effects of P‐glycoprotein (P‐gp) substrates, the P‐gp non‐substrate and inhibition of P‐gp function on Matrigel invasion of MCF‐7 and MCF‐7/Adr cells. Matrigel invasion was evaluated using trans‐well chambers. Bar graphs represent mean ± SEM of three independent experiments. *P < 0.05 versus vehicle group.
Involvement of EGFR in regulation of CD147 and MMP‐2, ‐9 production in MCF‐7/Adr cells treated with P‐gp substrates. EGFR was identified as the primary regulatory effector able to enhance expression of CD147, thereby inducing MMP production. To ascertain whether EGFR is associated with P‐gp substrate‐induced CD147 and MMP‐2, ‐9 up‐regulation, EGFR expression of MCF‐7/Adr and MCF‐7 was first measured when they were treated with the drugs. As was expected, the results from real‐time PCR showed great increments of EGFR mRNA only in MCF‐7/Adr cells treated with P‐gp substrates, and western blot analysis manifested the corresponding alterations in protein levels (Fig. 3a, Table 1), which were consistent with the enhanced production of CD147 and MMP‐2, ‐9. Again, the up‐regulated EGFR expression was also not dose‐dependent (Fig. 3a). When the resistant cells were pretreated with tyrphostin AG1478, the selective inhibitor of the EGF receptor tyrosine kinase, the enhancement of CD147 and MMP‐2, ‐9 evoked by P‐gp substrates was largely inhibited (Fig. 3b, Table 1). Previous studies have described that the transactivation of EGFR correlates with the acquisition of motile properties in MCF‐7 cells.( 11 ) The increased expression of EGFR and the interruption of downstream events by the EGFR inhibitor provided a possible explanation for the stimulation of CD147 and MMP‐2, ‐9 by P‐gp substrates.
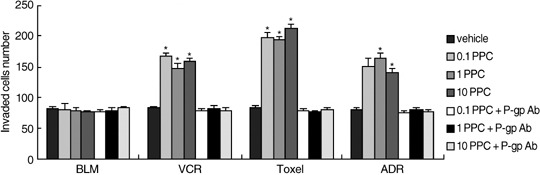
Figure 3.
Epidermal growth factor receptor (EGFR) was involved in up‐regulation of CD147 and MMP‐2, ‐9 in MCF‐7/Adr cells treated with P‐glycoprotein (P‐gp) substrates. (a) Production of EGFR mRNA and protein in MCF‐7, MCF‐7/Adr cells treated with P‐gp substrates and a non‐P‐gp substrate. (b) Inhibition of EGFR activity interrupted the promotion of CD147 and MMP‐2, ‐9 induced by P‐gp substrates in MCF‐7/Adr cells. MCF‐7/Adr cells were starved for 24 h and preincubated with 250 nM AG1478, an EGFR specific inhibitor, for 40 min prior to treatment with various doses of P‐gp substrates (0.1 peak plasma concentration [PPC], 1.0 PPC, 10.0 PPC). Production of CD147 and MMP‐2, ‐9 was then determined using western blot and zymography. ADM, adriamycin; BLM, bleomycin; Toxel, paclitoxel; VCR, vincristine. Bar graphs represent mean ± SEM of three independent experiments. Results are representative of three similar experiments **P < 0.05 versus vehicle group.
Inhibition of P‐gp could significantly interrupt the up‐regulation of CD147, MMP‐2, ‐9 and EGFR induced by P‐gp substrates in MCF‐7/Adr cells. To define the possible role of the P‐gp transporter function in P‐gp substrate‐induced, EGFR‐potentiated promotion of CD147 and MMP‐2, ‐9, the MCF7/Adr cells were incubated with the anti‐P‐gp mouse monoclonal antibody, which neutralizes the transporter function of P‐gp, for 3 h prior to treatment with various doses of P‐gp substrates (0.1 PPC, 1.0 PPC, 10.0 PPC) and then analyzed the production of CD147, MMP‐2, ‐9, and EGFR expression in MCF‐7/Adr cells. Fig. 4 showed that P‐gp substrates could no longer induce significant increments in the production of CD147, MMP‐2, ‐9 and EGFR in MCF‐7/Adr cells when in the presence of P‐gp neutralizing antibody, and so, neither could they accelerate in vitro invasion in MDR tumor cells (Fig. 2). These data revealed the participation of P‐gp in modulation of tumor metastasis and further strengthened the role for P‐gp in cell migration.
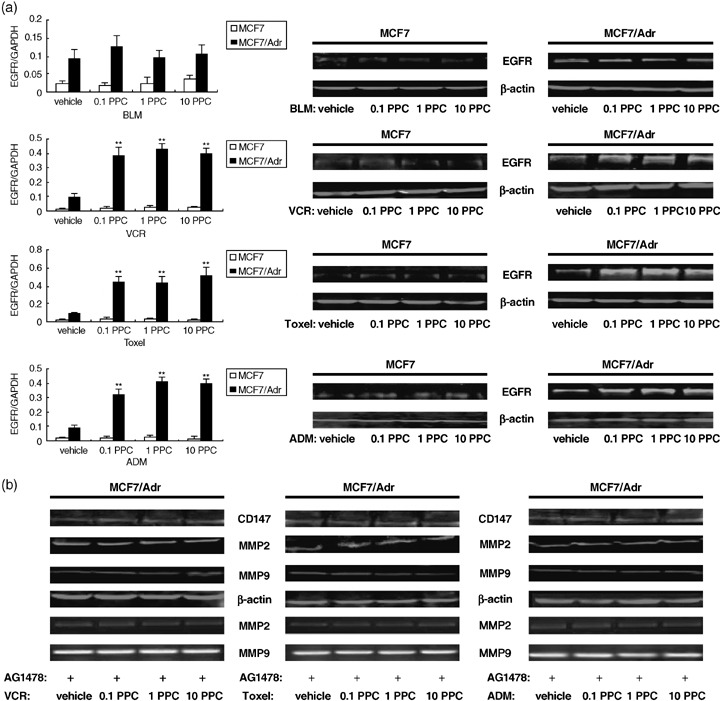
Figure 4.
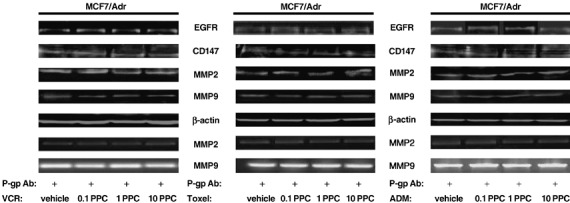
Effects of P‐glycoprotein (P‐gp) neutralizing antibody on the production of epidermal growth factor receptor (EGFR), CD147 and MMP‐2, ‐9 in MCF‐7/Adr cells treated with P‐gp substrates. MCF‐7/Adr cells were exposed to various doses of P‐gp substrates (0.1 peak plasma concentration [PPC], 1.0 PPC, 10.0 PPC), respectively, with 20 µg/mL of the anti‐P‐gp monoclonal antibody for 3 h before adding P‐gp substrates. EGFR, CD147 and MMP‐2, ‐9 production was then assessed using western blot and zymography. ADM, adriamycin; Toxel, paclitoxel; VCR, vincristine. Results are representative of three similar experiments.
Discussion
CD147 is a highly glycosylated transmembrane protein that belongs to the immunoglobulin superfamily.( 12 ) It is associated with the surface of tumor cells, which stimulates MMP synthesis in the tumor cells and in neighboring fibroblasts.( 13 , 14 ) The mRNA and protein levels of CD147, MMP‐2, ‐9 and the gelatinolytic activities in MCF‐7/Adr cells when treated with P‐gp substrates, paclitaxel, vincristine or adriamycin, were compared to those treated with vehicle. The MDR cell line used was approximately 18‐fold resistant to adriamycin. P‐gp substrates significantly increased the production of either CD147 or MMP‐2, ‐9, and these effects were not dose‐dependent. In contrast, bleomycin, which is not a P‐gp substrate, did not exhibit similar effects in the MDR cell line. Moreover, the same doses of either the P‐gp substrates or the non‐P‐gp substrate also exerted no impact on the production of the metastasis‐related genes. Corresponding alterations were also observed in in vitro invasion assays. Because CD147 promotes invasion of tumor cells by stimulating stromal cells and tumor cells to produce elevated levels of MMP, MMP play a crucial role in several aspects of tumor progression, including growth, invasion, metastasis, and angiogenesis,( 13 , 15 ) it was suggested that increased in vitro invasion activities could be greatly ascribed to significant promotion of CD147 and MMP‐2, ‐9. Based on the above, the present work reasonably explains the distinct survival times between mice bearing MDR tumor cells treated with P‐gp substrates and non‐P‐gp substrates in Yang's study.
In view of the high expression of CD147 in malignant tissues and its potential as a target for therapy, it is surprising that relatively little is currently known about the way it is regulated. EGFR was identified as the major regulator able to stimulate production of CD147,( 8 ) so EGFR expression in parental and MDR breast cancer cells after they are exposed to P‐gp substrates and a non‐P‐gp substrate, respectively, was assessed and it was found that expression of EGFR was only enhanced in MCF‐7/Adr cells incubated with P‐gp substrates and no differences were observed between various drug doses. The present study additionally showed that AG1478, an EGFR‐specific inhibitor, inhibited the up‐regulation of CD147 and MMP‐2, ‐9 induced by P‐gp substrates in MDR tumor cells. These results further confirmed that EGFR was involved in the advancement of drug‐induced metastasis. However, the role of EGFR in the process should not be limited to this. On the one hand, EGFR can up‐regulate CD147 expression, which thereby induces the expression of P‐gp,( 8 , 16 , 17 ) and on the other hand, EGFR is also known to be involved in increased phosphorylation of P‐gp, accompanied by a consistent decrease in total drug accumulation.( 9 ) Therefore, it was postulated that the up‐regulation of EGFR in MDR tumor cells treated with P‐gp substrates could not only cause significant changes in tumor metastasis, but also effectively assisted tumor cells to evade the cytotoxic attacks of the drugs through strengthening the activity of P‐gp.
The difference between the P‐gp substrate and the non‐P‐gp substrate mainly depends on whether they can be effluxed out of cells by P‐gp.( 18 , 19 ) The physiological role for P‐gp in cell migration has been reported in mononuclear phagocytes, dendritic cells and human colon carcinomas.( 20 , 21 , 22 ) In the authors’ current research, because treatment of MDR breast tumor cells with P‐gp drugs resulted in the promotion of EGFR, CD147 and MMP, the impact of P‐gp inhibition on this process was evaluated next. It was initially found that blocking P‐gp transporter function by specific monoclonal antibodies (mAb) could potently interrupt the downstream effects motivated by P‐gp substrates in MDR breast cancer cells. Because of the facts above, it was speculated that there may exist some kinase(s) or other protein(s) that structurally or functionally couples with P‐gp. Pumping chemotherapeutic drugs out of cancer cells appeared to be triggering an event that initiated interaction with the unknown protein and triggered the downstream molecular events, including up‐regulation of EGFR, CD147 and MMP. Thus, treatment of MDR breast tumor cells with P‐gp substrates may produce a remarkable influence on malignant behavior that could adversely affect therapeutic outcomes.
In summary, the present work confirmed that production of CD147 and MMP‐2, ‐9 could be significantly elevated in MDR breast cancer cells treated with P‐gp substrates, consistent with corresponding alterations in vivo. In addition, a potential mechanism to explain these results was uncovered, which concerned the involvement of EGFR and P‐gp. This provides further insight into the mechanism underlying the functional linkage between drug resistance and tumor metastasis, enlightens the appropriate choice of chemotherapy drugs in clinical treatments, and pinpoints the inhibitive points that could effectively down‐regulate multidrug resistance and tumor invasiveness in a simultaneous manner.
Acknowledgments
Studies in the authors’ laboratory were supported by Funds of Shanghai Board of Health (No. 044082), Funds of Shanghai Scientific Association (No. 05ZR14023) and Funds of National Institutes of Health/National Cancer Institute (No. CA 66077 and No. CA109371). We thank the members of our laboratory for helpful discussions
References
- 1. Kerbel RS, Waghorne C, Korczak B, Lagarde A, Breitman ML. Clonal dominance of primary tumours by metastatic cells: genetic analysis and biological implications. Cancer Surv 1988; 7: 597–629. [PubMed] [Google Scholar]
- 2. Kerbel RS, Korczak B, Lagarde A. Growth dominance of the metastatic cancer cell: cellular and molecular aspects. Adv Cancer Res 1990; 5: 87–132. [DOI] [PubMed] [Google Scholar]
- 3. Su ZZ, Austin VN, Zimmer SG, Fisher PB. Defining the critical gene expression changes associated with expression and suppression of the tumorigenic and metastatic phenotype in Ha‐ras‐transformed cloned rat embryo fibroblast cells. Oncogene 1993; 8: 1211–19. [PubMed] [Google Scholar]
- 4. Ambudkar SV, Kimchi‐Sarfaty C, Sauna ZE, Gottesman MM. P‐glycoprotein: from genomics to mechanism. Oncogene 2003; 22: 7468–85. [DOI] [PubMed] [Google Scholar]
- 5. Yang JM, Yang GY, Medina DJ, Vassil AD, Liao J, Hait WN. Treatment of multidrug resistant (MDR1) murine leukemia with P‐glycoprotein substrates accelerates the course of the disease. Biochem Biophys Res Commun 1999; 266: 167–73. [DOI] [PubMed] [Google Scholar]
- 6. Yang JM, Xu Z, Wu H, Zhu H, Wu X, Hait WN. Overexpression of extracellular matrix metalloproteinase inducer in multidrug resistant cancer cells. Mol Cancer Res 2003; 1: 420–7. [PubMed] [Google Scholar]
- 7. Yan LS, Zucker BP. Toole. Roles of the multifunctional glycoprotein, emmprin (basigin; CD147), in tumour progression. Thromb Haemost 2005; 93: 199–204. [DOI] [PubMed] [Google Scholar]
- 8. Menashi S, Serova M, Ma L, Vignot S, Mourah S, Calvo F. Regulation of extracellular matrix metalloproteinase inducer and matrix metalloproteinase expression by amphiregulin in transformed human breast epithelial cells. Cancer Res 2003; 63: 7575–80. [PubMed] [Google Scholar]
- 9. Yang J‐M, Gregory FS, William H IV. Regulation of the function of P‐glycoprotein by epidermal growth factor through phospholipase C. Biochem Pharmacol 1997; 53: 1597–604. [DOI] [PubMed] [Google Scholar]
- 10. Davies R, Budworth J, Riley J, Snowden R, Gescher A, Gant TW. Regulation of P‐glycoprotein 1 and 2 gene expression and protein activity in two MCF7/ADR cell line subclones. Br J Cancer 1996; 73: 307–15. [DOI] [PMC free article] [PubMed] [Google Scholar]
- 11. Guerrero J, Santibanez JF, Gonzalez A, Martinez J. EGF receptor transactivation by urokinase receptor stimulus through a mechanism involving Src and matrix metalloproteinases. Exp Cell Res 2004; 292: 201–8. [DOI] [PubMed] [Google Scholar]
- 12. Suzuki S, Sato M, Senoo H, Ishikawa K. Direct cell–cell interaction enhances pro‐MMP‐2 production and activation in co‐culture of laryngeal cancer cells and broblasts: involvement EMMPRIN and Mt1‐MMP. Exp Cell Res 2004; 293: 259–66. [DOI] [PubMed] [Google Scholar]
- 13. Kanekura T, Chen X, Kanzaki T. Basigin (CD147) is system with an improved hairpin and its significant expressed on melanoma cells and induces tumor cell invasion by stimulating production of matrix metalloproteinases by fibroblasts. Int J Cancer 2002; 99: 520–8. [DOI] [PubMed] [Google Scholar]
- 14. Bordador LC, Li X, Toole B et al . Expression of emmprin by oral squamous cell carcinoma. Int J Cancer 2000; 85: 347–52. [PubMed] [Google Scholar]
- 15. Davidson B, Goldberg I, Berner A, Kristensen GB, Reich R. EMMPRIN (extracellular matrix metalloproteinase inducer) is a novel marker of poor outcome in serous ovarian carcinoma. Clin Exp Metastasis 2003; 20: 161–9. [DOI] [PubMed] [Google Scholar]
- 16. Shi Y, Ouyang P, Sugrue SP. Characterization of the gene encoding pinin/DRS/memA and evidence for its potential tumor suppressor function. Oncogene 2000; 19: 289–97. [DOI] [PubMed] [Google Scholar]
- 17. Li Q‐Q, Wang W‐J, Xu Z‐D et al . Involvement of CD147 in regulation of multidrug resistance to P‐gp substrate drugs and in vitro invasion in breast cancer cells. Cancer Sci 2007; 98: 1064–9. [DOI] [PMC free article] [PubMed] [Google Scholar]
- 18. Aszalos A, Ross D. Biochemical and clinical aspects of efflux pump related resistance to anti‐cancer drugs. Anticancer Res 1998; 18: 2937–44. [PubMed] [Google Scholar]
- 19. Larsen A, Escargueil A, Skladanowski A. Resistance mechanisms associated with altered intracellular distribution of anticancer agents. Pharmacol Ther 2000; 85: 217–29. [DOI] [PubMed] [Google Scholar]
- 20. Gwendalyn JR, Sylvie B, Melissa P et al . A physiologic function for p‐glycoprotein (MDR‐1) during the migration of dendritic cells from skin via afferent lymphatic vessels. Proc Natl Acad Sci 1998; 95: 6924–9. [DOI] [PMC free article] [PubMed] [Google Scholar]
- 21. Weinstein RS, Jakate SM, Dominguez JM et al . Relationship of the expression of the multidrug resistance gene product (P‐glycoprotein) in human colon carcinoma to local tumor aggressiveness and lymph node metastasis. Cancer Res 1991; 51: 2720–6. [PubMed] [Google Scholar]
- 22. Emanuel SL, Chamberlin HA, Cohen D. Antimitotic drugs cause increased tumorigenicity of multidrug resistant cells. Int J Oncol 1999; 14: 487–94. [DOI] [PubMed] [Google Scholar]