Abstract
Insulin‐like growth factor binding protein‐3 (IGFBP‐3) modulates cell proliferation of various cancer cell types. However, it remains unclear how IGF–IGFBP‐3‐signaling is involved in growth and progression of hepatocellular carcinoma (HCC). The aim of the present study was to evaluate the role of IGFBP‐3 in HCC. Type 1 receptor for IGF (IGF‐1R) was expressed at various levels in the seven lines examined, but IGF‐2R was not expressed. Of the seven lines, the growth of HAK‐1B, KIM‐1, KYN‐2 and HepG2 cells was stimulated in a dose‐dependent manner by the exogenous addition of IGF‐I or IGF‐II, but the HAK‐1A, KYN‐1 and KYN‐3 cell lines showed no growth. Exogenous addition of IGFBP‐3 markedly blocked IGF‐I and IGF‐II‐stimulated cell growth of KYN‐2 and HepG2 cells, and moderately stimulated that of KIM‐1 and HAK‐1B cells, but no growth of the KYN‐1, KYN‐3 and HAK‐1A cell lines was observed. IGF‐I enhanced the phosphorylation of IGF‐1R, Akt and Erk1/2 in KYN‐2 cells, and coadministration of IGFBP‐3 blocked all types of activation by IGF‐I investigated here. In contrast, no such activation by IGF‐I was detected in KYN‐3 cells. IGFBP‐3 also suppressed IGF‐I‐induced cell invasion by KYN‐2 cells. Moreover, we were able to observe the apparent expression of IGFBP‐3 in KYN‐3 cells, but not in the other six cell lines. Furthermore reduced expression of IGFBP‐3, but not that of IGF‐1R, was significantly correlated with tumor size, histological differentiation, capsular invasion and portal venous invasion. Low expression of IGFBP‐3 was independently associated with poor survival. IGFBP‐3 could be a molecular target of intrinsic importance for further development of novel therapeutic strategy against HCC. (Cancer Sci 2006; 97: 1182–1190)
Hepatocellular carcinoma (HCC) is one of the most common and aggressive malignant tumors worldwide. The long‐term prognosis of HCC patients has remained unsatisfactory due to the high incidence of intrahepatic recurrence, which depends on portal venous invasion and the high incidence of intrahepatic metastasis, as well as multicentric development of new tumors.( 1 , 2 ) Moreover, our understanding of the molecular mechanisms underlying the progression of HCC and the development of effective therapeutic targets remain to be studied in further detail.
One candidate among the many growth factors that are closely associated with growth of HCC cells is insulin‐like growth factor (IGF).( 3 ) The biological effects of IGF are mediated via type 1 IGF receptor (IGF‐1R), which leads to activation of the mitogen‐activated protein kinase (MAPK) signaling pathway involved in cell growth and metabolism.( 4 , 5 ) Mutation of another type 2 receptor (M6P/IGF‐2R) and upregulation of IGF‐II are expected to be responsible for the early stages of human hepatocarcinogenesis.( 6 , 7 ) However, it remains unclear how the IGF system is involved in the progression of HCC. IGF are known to bind to IGF binding proteins (IGFBP), which regulate activity and function of IGF.( 8 ) IGFBP‐3 is the most abundant IGFBP that is present in non‐cancerous liver tissues and serves as a negative regulator of cell proliferation in human HCC.( 9 , 10 , 11 , 12 ) IGFBP‐3 is also known to regulate cell growth independently of its effects on IGF‐stimulated growth in other types of malignancy.( 13 , 14 , 15 , 16 )
In our present study, we investigated how IGFBP‐3 exerts its antiproliferative effects on HCC cell lines in culture, and using immunohistochemical analyses we further examined whether or not the expression of IGFBP‐3 in human clinical samples is associated with the clinicopathological characteristics of HCC. We discuss plausible roles of IGFBP‐3 in the IGF‐dependent and ‐independent cell proliferation of HCC, and also the clinical significance of IGFBP‐3 in patients with HCC.
Materials and Methods
Cell culture and reagents. HAK‐1A, HAK‐1B, KIM‐1, KYN‐1, KYN‐2 and KYN‐3 were established at Kurume University (Kurume, Japan) as described previously.( 17 , 18 , 19 , 20 , 21 ) HepG2 was purchased from American Type Culture Collection (Manassas, VA, USA). These cell lines were grown in Dulbecco's modified Eagle's medium (DMEM) supplemented with 10% fetal bovine serum. Human IGF‐I (hIGF‐I), hIGF‐II and hIGFBP‐3 were purchased from R&D systems (Minneapolis, MN, USA). Anti‐IGF‐1Rα, antiphospho‐IGF‐1R, anti‐IRS‐1, anti‐PKB/Akt, antiphospho‐PKB/Akt, anti‐Erk and antiphospho‐Erk were obtained from Cell Signaling (Beverly, MA, USA). Anti‐IGFBP‐3 was from Santa Cruz (Santa Cruz, CA, USA). Anti‐glyceraldehyde‐3‐phosphate dehydrogenase (GAPDH) was purchased from TREVIGEN (Gaithersburg, MD, USA).
Western blotting. Western blotting was carried out as described previously.( 22 ) Briefly, cells were lysed in a lysis buffer (pH 7.4) containing 20 mM Tris‐HCl, 1% Triton X‐100, 50 mM each of NaCl and NaF, 5 mM ethylenediaminetetraacetic acid, 1 mM Na3VO4, 1 mM phenylmethylsulfonylfluoride and 10 µg/mL each of aprotinin and leupeptin. The lysates were separated by sodium dodecylsulfate–polyacrylamide gel electrophoresis, and then transferred to a nitrocellulose membrane.
Small interfering RNA transfection. The small interfering RNA (siRNA) corresponding to nucleotide sequences of IGF‐1R (5′‐GCAUCGAACUCCUCUUCUCAGUUAA‐3′) and IGFBP‐3 (5′‐AAUCAUCAUCAAGAAAGGGCAUU‐3′)( 23 ) were purchased from Invitrogen (Carlsbad, CA, USA) and QIAGEN (Valencia, CA, USA), respectively. A negative control siRNA was obtained from Invitrogen. siRNA duplexes were transfected using Lipofectamine 2000 and Opti‐MEM medium (Invitrogen) according to the manufacturer's recommendations.
Real‐time quantitative polymerase chain reaction. The extraction of total RNA was carried out using TRIsol solution (Life Technologies, Grand Island, NY, USA). Real‐time quantitative polymerase chain reaction (PCR) was carried out using the Real‐Time PCR system 7300 (Applied Biosystems, Foster City, CA, USA) as described previously.( 24 ) In brief, the PCR amplification reaction mixtures (20 µL) contained cDNA, primer pairs, dual‐labeled fluorogenic probe and TaqMan Universal PCR Master Mix. The primer pairs and probe were obtained from Applied Biosystems. The relative gene expression for each sample was determined using the formula:
| 2−ΔCt = 2Ct(GAPDH)−Ct(IGF‐1R), |
which reflected the IGF‐1R gene expression normalized to GAPDH levels.
Cell proliferation assay. Aliquots of medium containing 3.0 × 10³ cells were seeded into a 96‐well plate. The following day, the medium was replaced with serum‐free DMEM medium with or without IGF. The plate was then treated for 72 h before the addition of WST‐8 (2‐[2‐methocy‐4‐nitrophenyl]‐3‐[4‐nitrophenyl]‐5‐[2,4‐disulfophenyl]‐2H‐tertrazolium) and absorbance recorded at 450 nm.
Quantification of IGFBP‐3 in conditioned medium. The concentration of IGFBP‐3 in conditioned medium from the HCC cell lines was measured using a commercially available enzyme‐linked immunosorbent assay (ELISA) kit (R&D systems). The cells were suspended at a density of 3.0 × 10³ cells/mL in 48‐well plates and the suspensions were then cultured for 16 h. The supernatant was replaced with fresh medium after 24 h.
Matrigel invasion assay. This assay carried out as described previously.( 25 ) In brief, BD BioCoat Matrigel Invasion Chambers (BD Bioscience, Bedford, MA, USA) were used according to the manufacturer's instructions. KYN‐2 cells (1 × 10⁵) in serum‐free DMEM containing 0.1% bovine serum albumin were seeded onto Matrigel‐coated filters in the upper chambers. In the lower chambers, DMEM medium with or without IGF‐I was added as a chemoattractant. After 24 h of incubation, cells on the upper surface of the filters were removed with a cotton swab, and the filters were fixed with 100% methanol and stained with Giemsa dye. The cells that had invaded to the lower side of the filters were viewed under a microscope and counted in five fields of view. The invasive ability of the cancer cells was expressed as the mean number of cells in five fields. The assay was carried out as three independent experiments.
Patients and samples. We reviewed the clinical data and surgically resected tissue from 87 consecutive patients who underwent hepatectomy for primary HCC without preoperative treatment between 1992 and 2000. Written informed consent was obtained from each patient before tissue acquisition. The study was approved by the Human Investigation Committee at the Kyushu University School of Medicine (Fukuoka, Japan). All specimens were obtained from files at the Department of Anatomic Pathology at Kyushu University. All tumors were defined as HCC, and the pathological features were determined histologically based on the classification of the Liver Cancer Study Group of Japan.( 26 )
For measurement of serum IGF‐I and IGFBP‐3 levels, 92 subjects with HCC were included (age, 45–83 years; median, 67.6 years; male/female, 64/28; hepatitis B virus antigen (HBsAg) positive, 16; hepatitis C virus antibody (HCV‐Ab) positive, 68; and HBsAg/HCV‐Ab negative, 8). The diagnosis was based on ultrasonography, contrast‐enhanced computed tomography, magnetic resonance imaging angiography and histological findings. All patients underwent hepatectomy for primary HCC without preoperative treatment at the Kurume University Hospital.
Immunohistochemistry. The tissue sections (4 µm) were stained with anti‐IGFBP‐3, anti‐IGF‐1Rα or antiphospho‐IGF‐1R. A biotinylated secondary antibody was then applied and incubated with peroxidase‐conjugated streptavidin, chromogenized by diaminobenzidine. The staining was evaluated semiquantitatively in the selected HCC components containing a predominant histological grade and the results were compared with those in adjacent, non‐neoplastic hepatocytes. The staining for IGFBP‐3 was divided into low (less than 10% of tumor cells are positive) and high (more than 10% of tumor cells are positive) expression groups according to the percentage of immunoreactive cells. The evaluation for IGF‐1R was dependent on its intensity when IGFBP‐3 was evaluated by counting immunoreactive cells.
Statistical analysis. Differences in cell number, the levels of proteins and serum IGF‐I and IGFBP‐3 levels being examined were analyzed using the Mann–Whitney U‐test. The correlation between serum IGF‐I and IGFBP‐3 levels and degree of HCC progression, and between immunohistochemical results and clinicopathological factors, were evaluated using the χ2‐test, Fisher's exact test and Mann–Whitney U‐test. Overall survival was measured from the time of surgery until death with disease, or until the end of follow up. Patients who died of causes unrelated to the disease were censored at the time of death (n = 3). One patient was lost from follow up at 2 months after surgery. Survival curves were calculated using the Kaplan–Meier method, and the differences between the curves were analyzed using the log‐rank test. Cox's proportional hazard model with a stepwise procedure was used for the multivariate survival analysis. The results were considered significant if the P‐value was less than 0.05.
Results
IGF‐dependent cell growth in some HCC cell lines. IGF‐1R, IRS‐1, Akt and Erk were expressed at various levels among the seven cell lines, although no IGF‐2R expression was detected (Fig. 1A). Both IGF‐I and IGF‐II stimulated cell proliferation of HAK‐1B, KIM‐1, KYN‐2 and HepG2 in a dose‐dependent manner. Moreover, IGF‐I and IGF‐II stimulated only slight, if any, cell growth among HAK‐1A, KYN‐1 and KYN‐3 (Fig. 1B). IGF‐I effectively stimulated cell proliferation of KYN‐2 much more than IGF‐II did, but both factors showed similar stimulatory effects on growth of HAK‐1B, KIM‐1 and HepG2 cells.
Figure 1.
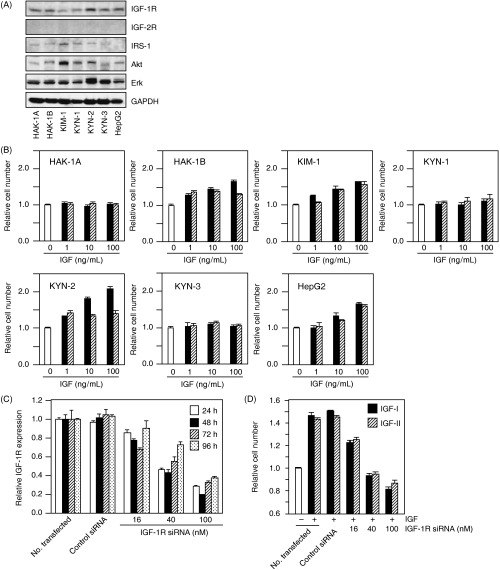
(A) Expression of type 1 insulin‐like growth factor (IGF) receptor (IGF‐1R), IGF‐2R, IRS‐1, Akt and Erk was determined by immunoblotting conducted on protein lysates extracted from these cell lines. The detection of glyceraldehyde‐3‐phosphate dehydrogenase (GAPDH) served as a loading control. (B) Effects of IGF‐I and IGF‐II on the proliferation of seven hepatocellular carcinoma cell lines. The cells were treated with or without IGF at concentrations of 1, 10 or 100 ng/mL for 72 h in serum‐free media, and then colorimetric WST assays were carried out. Each bar represents IGF‐I (closed bar) or IGF‐II (hatched bar). The data are expressed as the mean ± SD. (C) Inhibition by IGF‐1R small interfering RNA (siRNA) treatment of IGF‐1R gene expression of KYN‐2 cells. KYN‐2 cells were transfected with IGF‐1R siRNA at concentrations of 0, 16, 40 and 100 nM, and the cells were incubated for the periods of time indicated. After incubation, total RNA was extracted and gene silencing was analyzed by real‐time quantitative polymerase chain reaction. (D) Effect of IGF‐1R siRNA on the proliferation of IGF‐I (closed bar) or IGF‐II (hatched bar)‐stimulated KYN‐2 cells. The cells were stimulated with 100 ng/mL of IGF‐I or IGF‐II after 24 h of siRNA treatment, and a WST assay was carried out 72 h after IGF stimulation. The data are expressed as the mean ± SD.
We next examined whether or not IGF‐dependent cell growth of HCC cells is mediated through IGF‐1R. The transfection of IGF‐1R siRNA in KYN‐2 cells led to a downregulation of IGF‐1R expression in a dose‐dependent manner (Fig. 1C). The growth of KYN‐2 cells increased to approximately 1.5‐fold the size of untreated controls when treated with IGF, and this IGF‐dependent stimulation of growth was almost completely blocked by 40–100 nM IGF‐1R siRNA (Fig. 1D).
Effect of IGFBP‐3 on IGF‐induced cell growth. The effect of IGFBP‐3 on IGF‐induced cell growth was examined. The IGF‐dependent cell growth of KYN‐2 and HepG2 was almost completely blocked by treatment with IGFBP‐3 at 1–10 µg/mL, whereas that of HAK‐1B and KIM‐1 was significantly blocked by treatment with 10 µg/mL IGFBP‐3. In contrast, the growth of HAK‐1 A, KYN‐1 and KYN‐3 cells was not at all inhibited by treatment with IGFBP‐3 (Fig. 2A). Next we carried out an ELISA assay in order to determine whether or not HCC cell lines produce IGFBP‐3. Of the seven cell lines examined here, we were able to observe unequivocal production of higher amounts of IGFBP‐3 in the KYN‐3 cells, but this was not the case in the other cell lines (Fig. 2B).
Figure 2.
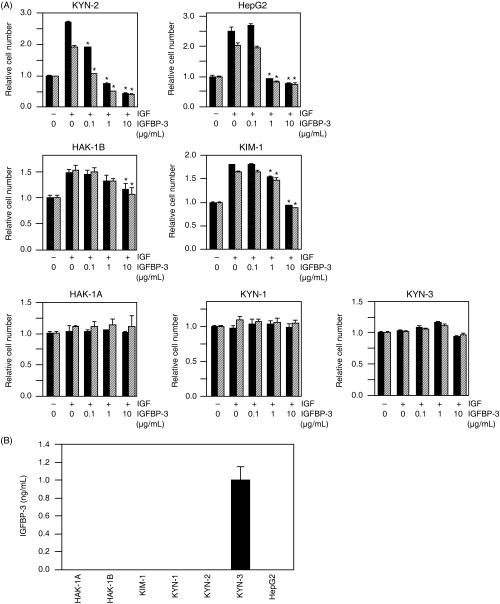
(A) The effects of insulin‐like growth factor (IGF) binding protein (IGFBP)‐3 on IGF‐I‐ or IGF‐II‐dependent cell proliferation of seven hepatocellular carcinoma cell lines. The cells were incubated with either serum‐free medium, 100 ng/mL of IGF‐I (closed bar) or 100 ng/mL of IGF‐II (hatched bar) in the presence of various concentrations of IGFBP‐3 for 72 h. After incubation, colorimetric WST assays were carried out. *Significant differences (P < 0.01) compared with treatment with IGF alone in the absence of IGFBP‐3. The data are expressed as the mean ± SD. (B) Cellular production of IGFBP‐3 in KYN‐3 cells. IGFBP‐3 protein levels in the culture medium with the seven cell lines examined here were assayed quantitatively with enzyme‐linked immunosorbent assay systems. The data are the average of triplicate wells ± SD.
Effect of IGFBP‐3 on IGF‐dependent signaling, cell growth and invasion. We further examined whether the activation of IGF‐1R and its downstream signaling were modulated by IGFBP‐3 in three cell lines: KYN‐2 with IGF‐dependent cell growth, and KYN‐1 and KYN‐3 with IGF‐independent cell growth. Treatment with IGF‐I markedly enhanced phosphorylation of IGF‐1R, with concomitant phosphorylation of both Akt and Erk in KYN‐2 cells, but such effects were not observed in KYN‐1 and KYN‐3 cells (Fig. 3A). The IGF‐I‐induced phosphorylation of IGF‐1R, Akt and Erk was almost completely inhibited in KYN‐2 by coadministration of IGFBP‐3.
Figure 3.
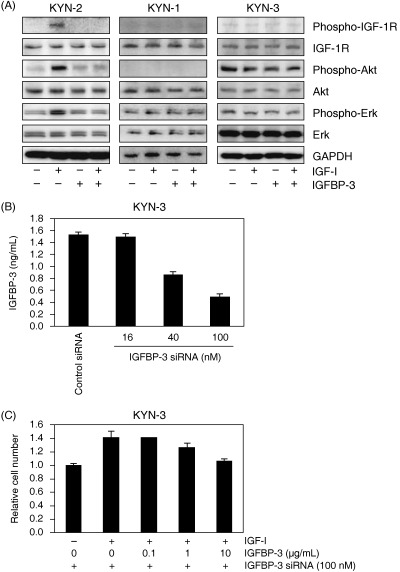
(A) Effects of insulin‐like growth factor (IGF)‐I and IGF binding protein (IGFBP)‐3 on the phosphorylation of type 1 IGF receptor (IGF‐1R), Akt and Erk in KYN‐2, KYN‐1 and KYN‐3 cells. Serum‐deprived cells were treated with 100 ng/mL IGF‐I and/or with 10 µg/mL IGFBP‐3 for 10 min. Cell lysates were blotted with the antibodies indicated. The detection of glyceraldehyde‐3‐phosphate dehydrogenase (GAPDH) served as a loading control. (B) Inhibition by IGFBP‐3 small interfering RNA (siRNA) treatment of IGFBP‐3 expression in KYN‐3 cells. KYN‐3 cells were transfected with IGFBP‐3 siRNA at concentrations of 0, 16, 40 and 100 nM, and the cells were incubated for 24 h. After incubation, IGFBP‐3 protein levels in the culture medium were assayed quantitatively with enzyme‐linked immunosorbent assay systems. The data are the average of triplicate wells ± SD. (C) Restoration of IGF‐I‐stimulated proliferation of KYN‐3 cells by IGFBP‐3 siRNA. KYN‐3 cells were treated for 24 h with 100 nM IGFBP‐3 siRNA and further incubation with 100 ng/mL of IGF‐I in the absence or presence of various doses of IGFBP‐3 for 72 h. The data are expressed as the mean ± SD.
Cell growth of KYN‐3 was not stimulated by IGF and not blocked by coadministration of IGFBP‐3: KYN‐3 cells produced a significant amount of IGFBP‐3 (Fig. 2). We next examined whether production of IGFBP‐3 by KYN‐3 cells could be responsible for their reduced response to IGF. The transfection of IGFBP‐3 siRNA in KYN‐3 cells led to a knockdown of IGFBP‐3 expression in a concentration‐dependent manner (Fig. 3B). Cell growth of KYN‐3 was found to be increased to approximately 1.4‐fold over the untreated controls by IGF‐I when treated with 100 nM IGFBP‐3 siRNA (Fig. 3C). This IGF‐I‐dependent growth stimulation was significantly inhibited by 10 µg/mL IGFBP‐3 in IGFBP‐3 siRNA‐treated KYN‐3 cells (Fig. 3A,C).
Insulin‐like growth factor‐I plays an important role in invasion and migration of various malignant cell types including melanoma and pancreatic carcinoma.( 27 , 28 ) We next examined whether IGFBP‐3 could affect the invasive ability of IGF‐stimulated KYN‐2 cells by Matrigel invasion assay. Invaded cells were increased to approximately 9.0‐fold of untreated controls when treated with 1000 ng/mL IGF‐I (Fig. 4). In addition, the IGF‐I‐induced cell invasion was significantly suppressed by 52% by treatment with 100 µg/mL IGFBP‐3 (Fig. 4). Thus, IGFBP‐3 could inhibit both invasion and cell proliferation induced by IGF in HCC.
Figure 4.
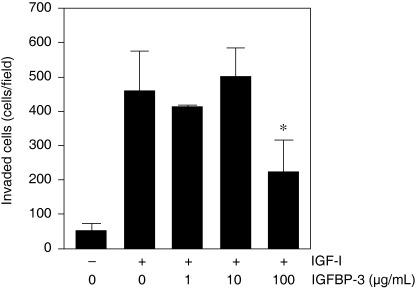
Effect of insulin‐like growth factor (IGF) binding protein (IGFBP)‐3 on invasion by IGF‐stimulated KYN‐2 cells in Matrigel invasion assay. Serum‐deprived KYN‐2 cells (1 × 10⁵) were seeded onto Matrigel‐coated filters in the upper chambers, and Dulbecco's modified Eagle's medium with or without IGF‐I (1000 ng/mL) in the presence of various concentrations of IGFBP‐3. The cell invasiveness was quantified as the mean cell number in five fields of view per filter. Columns, mean of three independent experiments; bars, ±SD.
Expression of IGFBP‐3 and IGF‐1R and their clinicopathological implications in clinical HCC. The expression of IGF‐1R and IGFBP‐3 was determined in human HCC samples by immunohistochemical analysis. The clinicopathological characteristics of 87 HCC patients, from whom the clinical samples were derived, are shown in Table 1. A representative immunohistochemical data of case 1 of well‐differentiated HCC is shown in Fig. 5A: the expression of both IGFBP‐3 and IGF‐1R protein was higher in carcinoma tissue than in adjacent hepatocytes (Fig. 5). In contrast, a representative case of poorly differentiated HCC (case 2 in Fig. 5A) exhibited reduced expression of both IGFBP‐3 and IGF‐1R in carcinoma cells, compared with that in adjacent hepatocytes (Fig. 5A,d–f). In non‐cancerous tissue of case 2, IGF‐1R and IGFBP‐3 were found to be expressed in hepatocytes, but not in stromal cells such as inflammatory cells, Kupffer cells and endothelial cells (data not shown). Table 2 gives a summary of the immunohistochemical analysis of IGFBP‐3 and IGF‐1R expression in 87 clinical specimens. The immunohistochemical analysis of IGF‐1R and IGFBP‐3 expression in HCC samples revealed that the intensity of staining in carcinoma was similar to or stronger than that of adjacent hepatocytes in 57 cases of IGFBP‐3 and 58 cases of IGF‐1R (Table 2).
Table 1.
Clinicopathological characteristics of 87 patients
| Characteristic | n |
|---|---|
| Sex | |
| Male | 67 |
| Female | 20 |
| Age (years) | 36–83 (mean: 62.3) |
| Tumor size (cm) | 0.8–14.5 (mean: 3.9) |
| Virus marker | |
| HBV+ | 13 (14.9%) |
| HCV+ | 60 (69.0%) |
| HBV+ and HCV+ | 4 (0.5%) |
| Liver cirrhosis | 37 (42.5%) |
| TNM stage | |
| I | 12 |
| II | 31 |
| III | 19 |
| IV | 15 |
| Histological differentiation | |
| Well | 11 |
| Moderate | 54 |
| Poor | 22 |
| Capsular invasion | 56 (64.4%) |
| Portal venous invasion | 40 (46.0%) |
| Intrahepatic metastasis | 29 (33.3%) |
HBV+, positive for hepatitis B virus antigen; HCV+, positive for hepatitis C virus antibody.
Figure 5.
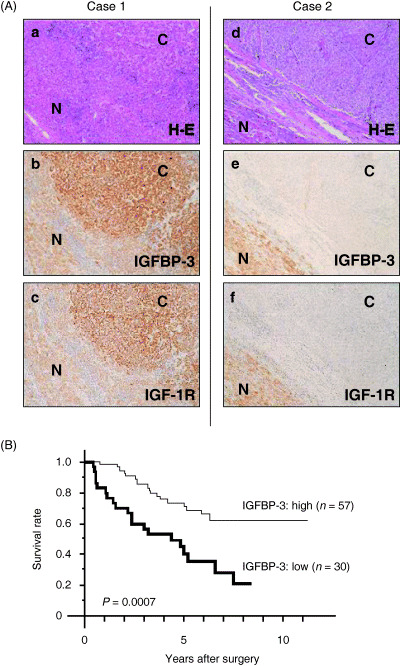
(A) Immunohistochemical expression of insulin‐like growth factor (IGF) binding protein (IGFBP)‐3 in hepatocellular carcinoma (HCC). Two representative cases of well‐differentiated HCC (case 1) and poorly differentiated HCC (case 2). The expression of both IGFBP‐3 and type 1 IGF receptor (IGF‐1R) was stronger in the HCC than in the adjacent liver in the cases of well‐differentiated HCC (b,c). In contrast, cases of poorly differentiated HCC showed reduced expression of IGFBP‐3 and IGF‐1R in the HCC tissue compared with that of the adjacent liver tissue (e,f). (a,d) Hematoxylin–eosin (H–E) staining. C, cancerous region; N, non‐cancerous region. (B) The overall survival of patients with low IGFBP‐3 expression was significantly worse than that of patients with high IGFBP‐3 expression (P = 0.0007).
Table 2.
Correlation of clinicopathological features and type 1 insulin‐like growth factor (IGF) receptor (IGF‐1R) or IGF binding protein (IGFBP)‐3 protein expression in hepatocellular carcinoma
| Variable | IGF‐1R | IGFBP‐3 | ||||
|---|---|---|---|---|---|---|
| High (n = 58) | Low (n = 29) | P‐value | High (n = 57) | Low (n = 30) | P‐value | |
| Mean age (years) | 62.5 | 61.9 | 0.7397 | 63.2 | 60.6 | 0.1827 |
| Male : female | 45 : 13 | 22 : 7 | 0.8570 | 45 : 12 | 22 : 8 | 0.5542 |
| Mean tumor size (cm) | 3.6 | 4.6 | 0.1337 | 3.0 | 5.7 | <0.0001 |
| Liver cirrhosis | 25 (43.1%) | 12 (41.4%) | 0.8781 | 26 (45.6%) | 11 (36.7%) | 0.4223 |
| Stage | ||||||
| I/II | 31 | 12 | 0.2885 | 31 | 12 | 0.2021 |
| III/IV | 27 | 17 | 26 | 18 | ||
| Histological differentiation | ||||||
| Well/moderate/poor | 9/38/10 | 2/16/12 | 0.0557 | 11/38/8 | 0/16/14 | 0.0007 |
| Capsular invasion | 37 (63.8%) | 19 (65.5%) | 0.8742 | 31 (54.3%) | 25 (83.3%) | 0.0074 |
| Portal venous invasion | 26 (44.8%) | 14 (48.3%) | 0.7610 | 17 (29.8%) | 23 (76.7%) | <0.0001 |
| Intrahepatic metastasis | 19 (32.8%) | 10 (34.5%) | 0.8722 | 19 (33.3%) | 10 (33.3%) | >0.9999 |
| High IGF‐1R expression | – | – | 45 (77.6%) | 13 (43.3%) | 0.0008 | |
We then determined whether or not the expression of IGFBP‐3 and IGF‐1R was associated with clinicopathological features of clinical HCC samples. However, we were unable to obtain any statistically significant results regarding IGF‐1R expression and clinicopathological parameters. In contrast, a close association between IGFBP‐3 expression and certain clinicopathological characteristics was observed (Table 2). Low expression of IGFBP‐3 was observed in cases with larger tumor size, poorly differentiated histology, capsular invasion and portal venous invasion. Moreover, IGF‐1R expression was found to correlate positively with IGFBP‐3 expression.
Univariate and multivariate survival analysis. The overall survival of patients with low IGFBP‐3 expression was significantly worse than those with high IGFBP‐3 expression (Fig. 5B). In the univariate postoperative survival analysis, tumor size, histological differentiation, portal vein invasion, TNM classification and intrahepatic metastasis were also associated with poor survival (data not shown). The multivariate survival analysis revealed that TNM classification (stage 3/4), low IGFBP‐3 expression and larger tumor size (>4 cm) were independent prognostic factors (Table 3).
Table 3.
Significant variables determined by multivariable survival analysis
| Variables | Coefficient | SE | Coefficient/SE | P‐value |
|---|---|---|---|---|
| Stage III/IV | 0.988 | 0.353 | 2.797 | 0.0052 |
| IGFBP‐3 | 0.841 | 0.329 | 2.558 | 0.0105 |
| Tumor size (>4 cm) | 0.670 | 0.332 | 2.015 | 0.0440 |
IGFBP, insulin‐like growth factor binding protein.
Serum IGF‐I and IGFBP‐3 levels in patients with HCC. Finally, we examined whether serum levels of IGFBP‐3 or IGF‐I were associated with HCC staging in 92 patients. Serum mean levels of IGF‐I and IGFBP‐3 in the stage I, II, III and IV groups were 92.1 ± 35.2 and 1.36 ± 0.34, 99.6 ± 37.4 and 1.30 ± 0.35, 74.6 ± 27.1 and 1.02 ± 0.30, and 91.7 ± 58.0 and 1.35 ± 1.10, respectively. There were negative correlations between staging of HCC and serum IGF‐I levels (Fig. 6A) or serum IGFBP‐3 levels (Fig. 6B). However, no statistically significant difference was observed in the correlation between HCC staging and serum IGF‐I levels or serum IGFBP‐3 levels.
Figure 6.
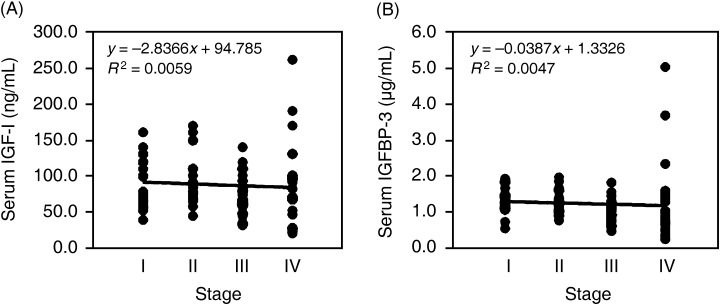
Correlation between hepatocellular carcinoma (HCC) staging and serum insulin‐like growth factor (IGF)‐I levels or serum IGF binding protein (IGFBP)‐3 levels in patients with HCC (n = 92). (A) Correlation between HCC staging and serum IGF‐I levels. (B) correlation between HCC staging and serum IGFBP‐3 levels. Patients of stage I (n = 22), II (n = 17), III (n = 31) and IV (n = 22).
Discussion
In the present study, we classified seven HCC cell lines into two groups that exhibited IGF‐dependent (HAK‐1B, KIM‐1, KYN‐2 and HepG2) and independent (HAK‐1A, KYN‐1 and KYN‐3) growth, whereby all seven cell lines expressed various levels of IGF‐1R. The growth of the former four cell lines was susceptible to the inhibitory effects of IGFBP‐3, whereas the growth of the latter three cells lines did not show such susceptibility. IGF‐1R, Akt and Erk were markedly activated in response to IGF‐I in KYN‐2 cells with IGF‐dependent growth and invasion, and their activities were almost completely blocked by coadministration of IGFBP‐3. In contrast, IGF‐I did not activate IGF‐1R, Akt or Erk in KYN‐3 cells exhibiting IGF‐independent growth, and IGFBP‐3 was unable to block phosphorylation of these molecules. Relevant studies have shown that the growth of HepG2 cells was inhibited by coadministration of IGFBP‐3,( 9 , 12 ) which is consistent with our present data regarding HepG2 cells. These findings suggest that IGFBP‐3 inhibits both growth and invasion of HCC cells through its interaction with IGF.
Of these seven cell lines, only KYN‐3 produced significant amounts of IGFBP‐3. The cellular levels of IGF‐1R in the KYN‐3 cells were similar to those in KYN‐2 cells, which were also highly sensitive to IGFBP‐3‐induced growth inhibition. The constitutive expression of IGFBP‐3 might interfere with IGF‐1R‐dependent growth signaling in KYN‐3 cells, resulting in lowered susceptibility to growth inhibition by the exogenous addition of IGFBP‐3. Reduced expression of IGFBP‐3 by treatment with siRNA could restore IGF‐I‐dependent cell growth in KYN‐3 cells. The IGF‐1R in KYN‐3 cells might be occupied with endogenous IGFBP‐3, thus resulting in a lack of further inhibition by exogenous IGFBP‐3.
However, the growth of KYN‐1 and HAK‐1A was not stimulated by exogenous addition of these IGF, and was also insensitive to growth inhibition by IGFBP‐3 when both cell lines expressed cellular levels of IGF‐1R comparable to those in KYN‐3 and KYN‐2. Unlike the KYN‐3 cells, neither the KYN‐1 nor the HAK‐1A cells produced significant amounts of IGFBP‐3. It remains unclear why IGFBP‐3 was unable to block the proliferation of these two cell lines, HAK‐1 A and KYN‐1, both of which express IGF‐1R. Although IGF can activate IGF‐1R as well as Akt and Erk, in KYN‐2, KIM‐1, HAK‐1B and HepG2, all of which exhibit IGF‐dependent cell growth, these IGF were unable to activate IGF‐1R and its downstream signaling pathways in HAK‐1A and KYN‐1 cells, and in KYN‐3 cells, all of which exhibit IGF‐independent cell growth. It is possible that IGF‐1R in the HAK‐1A and KYN‐1 cell lines might be functionally inactive. There appeared to be no mutations in either the transmembrane domain or in the tyrosine kinase domain of IGF‐1R in any of the HCC cell lines used in the present study (data not shown). Further studies should be carried out in order to gain a better understanding of the mechanism by which IGFBP‐3 exerts its inhibitory effects on the growth of these HCC cell lines.
Thirty‐nine percent of HCC clinical samples have been found to exhibit lower levels of IGF‐1R than does non‐neoplastic adjacent liver tissue.( 12 ) Consistent with the results of that previous study, our immunohistochemical analysis of 87 HCC samples demonstrated lower levels of IGF‐1R expression in approximately 40% of the human HCC tissue samples investigated, compared with matched, non‐tumorous tissue samples. The expression of IGF‐1R in HCC was not found to be significantly associated with any of a number of clinicopathological characteristics. However, to our surprise, high levels of IGF‐1R expression were significantly associated with high levels of IGFBP‐3 expression in HCC. Higher levels of IGF‐1R expression might modulate the expression of IGFBP‐3 in cases of HCC, but this possibility will require further investigation.
Immunohistochemical analysis of the expression of IGFBP‐3 in cancerous and non‐cancerous lesions in cases of HCC further demonstrated a close correlation of high or low IGFBP‐3 expression with tumor size, histological differentiation and portal venous invasion, but not with intrahepatic metastasis. The close association of tumor size and differentiation in HCC with the expression of IGFBP‐3 suggests that IGFBP‐3 might play a key role in tumor growth and progression in HCC. The malignant characteristics of HCC are partly due to their metastatic potential via intrahepatic metastasis and portal venous invasion. Of these two types of metastatic potential in cases of HCC, the expression of IGFBP‐3 was found to be more specifically correlated with portal venous invasion than with intrahepatic metastasis, thus suggesting the role of IGFBP‐3 in portal venous invasion. However, there appeared no significant correlation of HCC staging with serum levels of IGFBP‐3 or serum levels of IGF‐I when 92 HCC patients were analyzed. Our present clinical data with determination of serum IGFBP‐3 levels are also consistent with previous relevant studies.( 11 , 29 ) Further study should be carried out in order to determine the potential role of IGFBP‐3 in the above‐mentioned malignant characteristics associated with HCC.
In conclusion, the absence or presence of IGFBP‐3 expression and a functional IGF‐1R could affect the state of IGF‐dependent cell growth in HCC cell lines in culture. The expression of IGFBP‐3 was also significantly correlated with histological differentiation, tumor size, portal venous invasion and prognosis, but not with intrahepatic metastasis in the HCC studied here. As IGFBP‐3 plays a pivotal role in tumor enlargement and metastasis in HCC, it should be considered as a possible molecular target for the development of novel therapeutic strategies used in the treatment of HCC.
Acknowledgments
This study was supported in part by Health and Labour Sciences Research Grants of Third Term Comprehensive Control Research for Cancer from the Ministry of Health, Labour and Welfare. We would like to thank Drs Yuji Yamada and Tadafumi Terada (Taiho Pharmaceutical Co., Hanno, Japan) for fruitful discussions of this study.
References
- 1. Shimada M, Takenaka K, Gion T et al. Prognosis of recurrent hepatocellular carcinoma: a 10‐year surgical experience in Japan. Gastroenterology 1996; 111: 720–6. [DOI] [PubMed] [Google Scholar]
- 2. Adachi E, Maehara S, Tsujita E et al. Clinicopathologic risk factors for recurrence after a curative hepatic resection for hepatocellular carcinoma. Surgery 2002; 131: 148–52. [DOI] [PubMed] [Google Scholar]
- 3. Scharf JG, Schmidt‐Sandte W, Pahernik SA, Ramadori G, Braulke T, Hartmann H. Characterization of the insulin‐like growth factor axis in a human hepatoma cell line (PLC). Carcinogenesis 1998; 19: 2121–8. [DOI] [PubMed] [Google Scholar]
- 4. LeRoith D, Werner H, Beitner‐Johnson D, Roberts CT Jr. Molecular and cellular aspects of the insulin‐like growth factor I receptor. Endocr Rev 1995; 16: 143–63. [DOI] [PubMed] [Google Scholar]
- 5. Ito T, Sasaki Y, Wands JR. Overexpression of human insulin receptor substrate 1 induces cellular transformation with activation of mitogen‐activated protein kinases. Mol Cell Biol 1996; 16: 943–51. [DOI] [PMC free article] [PubMed] [Google Scholar]
- 6. Oka Y, Waterland RA, Killian JK et al. M6P/IGF2R tumor suppressor gene mutated in hepatocellular carcinomas in Japan. Hepatology 2002; 35: 1153–63. [DOI] [PubMed] [Google Scholar]
- 7. Sedlaczek N, Hasilik A, Neuhaus P, Schuppan D, Herbst H. Focal overexpression of insulin‐like growth factor 2 by hepatocytes and cholangiocytes in viral liver cirrhosis. Br J Cancer 2003; 88: 733–9. [DOI] [PMC free article] [PubMed] [Google Scholar]
- 8. Khandwala HM, McCutcheon IE, Flyvbjerg A, Friend KE. The effects of insulin‐like growth factors on tumorigenesis and neoplastic growth. Endocr Rev 2000; 21: 215–44. [DOI] [PubMed] [Google Scholar]
- 9. Hanafusa T, Yumoto Y, Nouso K et al. Reduced expression of insulin‐like growth factor binding protein‐3 and its promoter hypermethylation in human hepatocellular carcinoma. Cancer Lett 2002; 176: 149–58. [DOI] [PubMed] [Google Scholar]
- 10. Gong Y, Cui L, Minuk GY. The expression of insulin‐like growth factor binding proteins in human hepatocellular carcinoma. Mol Cell Biochem 2000; 207: 101–4. [DOI] [PubMed] [Google Scholar]
- 11. Mattera D, Capuano G, Colao A et al. Increased IGF‐I : IGFBP‐3 ratio in patients with hepatocellular carcinoma. Clin Endocrinol 2003; 59: 699–706. [DOI] [PubMed] [Google Scholar]
- 12. Huynh H, Chow PK, Ooi LL, Soo KC. A possible role for insulin‐like growth factor‐binding protein‐3 autocrine/paracrine loops in controlling hepatocellular carcinoma cell proliferation. Cell Growth Differ 2002; 13: 115–22. [PubMed] [Google Scholar]
- 13. Oh Y, Muller HL, Lamson G, Rosenfeld RG. Insulin‐like growth factor (IGF)‐independent action of IGF‐binding protein‐3 in Hs578T human breast cancer cells: Cell surface binding and growth inhibition. J Biol Chem 1993; 268: 14 964–71. [PubMed] [Google Scholar]
- 14. Rajah R, Valentinis B, Coehn P. Insulin‐like growth factor (IGF)‐binding protein‐3 induces apoptosis and mediates the effects of transforming growth factor‐1 on programmed cell death through a p53 and IGF‐independent mechanism. J Biol Chem 1997; 272: 12 181–8. [DOI] [PubMed] [Google Scholar]
- 15. Gill ZP, Perks CM, Newcomb PV, Holly JM. Insulin‐like growth factor‐binding protein (IGFBP‐3) predisposes breast cancer cells to programmed cell death in a non‐IGF‐dependent manner. J Biol Chem 1997; 272: 25 602–7. [DOI] [PubMed] [Google Scholar]
- 16. Kim HS, Ingermann AR, Tsubaki J, Twigg SM, Walker GE, Oh Y. Insulin‐like growth factor‐binding protein 3 induces caspase‐dependent apoptosis through a death receptor‐mediated pathway in MCF‐7 human breast cancer cells. Cancer Res 2004; 64: 2229–37. [DOI] [PubMed] [Google Scholar]
- 17. Murakami T. Establishment and characterization of human hepatocellular carcinoma cell line (KIM‐1). Acta Hepathol Jpn 1984; 25: 532–9. [Google Scholar]
- 18. Murakami T, Maruiwa M, Fukuda K, Kojiro M, Tanaka M, Tanikawa K. Characterization of a new human hepatoma cell line (KYN‐3) derived from the ascites of the hepatoma patient. Jpn J Cancer Res 1988; Proceedings of the Japanese Cancer Association: 292 [Abstract].
- 19. Yano H, Kojiro M, Nakashita T. A new human hepatocellular carcinoma cell line (KYN‐1) with a transformation to adenocarcinoma in vitro . Cell Dev Biol 1986; 22: 637–46. [DOI] [PubMed] [Google Scholar]
- 20. Yano H, Maruiwa M, Murakami T et al. A new human pleomorphic hepatocellular carcinoma cell line, KYN‐2. Acta Pathol Jpn 1988; 38: 953–66. [DOI] [PubMed] [Google Scholar]
- 21. Yano H, Iemura A, Fukuda K, Mizoguchi A, Haramaki M, Kojiro M. Establishment of two distinct human hepatocellular carcinoma cell lines from a single nodule showing clonal dedifferentiation of cancer cells. Hepatology 1993; 18: 320–7. [PubMed] [Google Scholar]
- 22. Basaki Y, Ikizawa K, Kajiwara K, Yanagihara Y. CD40‐mediated tumor necrosis factor receptor‐associated factor 3 signaling upregulates IL‐4‐induced germline Cepsilon transcription in a human B cell line. Arch Biochem Biophys 2002; 405: 199–204. [DOI] [PubMed] [Google Scholar]
- 23. Stewart LV, Weigel NL. Role of insulin‐like growth factor binding proteins in 1α,25‐dihydroxyvitamin D (3)‐induced growth inhibition of human prostate cancer cells. Prostate 2005; 64: 9–19. [DOI] [PubMed] [Google Scholar]
- 24. Kaneko Y, Kitazato K, Basaki Y. Integrin‐linked kinase regulates vascular morphogenesis induced by vascular endothelial growth factor. J Cell Sci 2004; 117: 407–15. [DOI] [PubMed] [Google Scholar]
- 25. Maruyama Y, Ono M, Kawahara A et al. Tumor growth suppression in pancreatic cancer by a putative metastasis suppressor gene Cap43/NDRG1/drg‐1 through modulation of angiogenesis. Cancer Res 2006; 66: 6233–42. [DOI] [PubMed] [Google Scholar]
- 26. Liver Cancer Study Group. The General Rules for the Clinical and Pathological Study of Primary Liver Cancer, 4th edn. Tokyo: Kanehara Publications, 2000. [Google Scholar]
- 27. Stracke M, Engel J, Wilson L, Rechler M, Liotta L, Schiffmann E. The type I insulin‐like growth factor receptor is a motility receptor in human melanoma cells. J Biol Chem 1989; 264: 21 544–9. [PubMed] [Google Scholar]
- 28. Brooks P, Klemke R, Schon S, Lewis J, Schwartz M, Cheresh D. Insulin‐like growth factor receptor cooperates with integrin αvβ5 to promote tumor cell dissemination in vivo . J Clin Invest 1997; 99: 1390–8. [DOI] [PMC free article] [PubMed] [Google Scholar]
- 29. Unsal E, Koksal D, Yurdakul AS, Atikcan S, Cinaz P. Analysis of insulin like growth factor 1 and insulin like growth factor binding protein 3 levels in bronchoalveolar lavage fluid and serum of patients with lung cancer. Respir Med 2005; 99: 559–65. [DOI] [PubMed] [Google Scholar]


