

Abstract
Hepatocellular carcinoma (HCC) is the third most common cause of cancer‐related death, and its incidence is increasing worldwide. Due to the known risk factors (mainly hepatitis B and C viruses), we believe there is a rationale for a chemopreventive approach to treat HCC. Here, based on described in vitro data, we evaluated the preventive effects of lanreotide, a somatostatin analog, on the induction of early carcinogenic events. We monitored preneoplastic foci induced by a two‐stage initiation/promotion model of hepatocarcinogenesis in male Wistar rats, using diethylnitrosamine and 2‐acetylaminofluorene. Lanreotide was given starting the day after the first diethylnitrosamine injection. By quantitative morphometry, we showed that lanreotide significantly decreases the size of induced preneoplastic foci. Analysis of proliferation and apoptosis assessed by immunohistochemistry, showed decreased proliferation and increased cell death in rats treated with lanreotide. As these events were associated with a significant decreased expression of the cell cycle regulator cyclin D1 and an increased expression of the cyclin‐dependent kinase inhibitor p27kip1 compared to the non‐treated group, it is tempting to speculate that these factors are involved in the favorable effect of lanreotide. In conclusion, lanreotide significantly decreases early carcinogenic transformation in a two‐step rat model. As lanreotide has a low toxicity profile, we believe it would be interesting to evaluate its effect in chemoprevention of HCC. (Cancer Sci 2007; 98: 1831–1839)
Abbreviations:
- AAF
2‐acetylaminofluorene
- CdK
cyclin‐dependent kinase
- CTL
control
- DEN
diethylnitrosamine
- GSTp
placental form of glutathione S‐transferase
- HCC
hepatocellular carcinoma
- Mrna
messenger RNA
- NS
not significant
- sstr
somatostatin receptors
- RTq‐PCR
reverse transcription–quantitative polymerase chain reaction.
HCC represents a major public health problem. Its incidence is in constant progression, with 2–5 new cases per 100 000 inhabitants/year in western countries and more than 20 per 100 000 inhabitants/year in Asia.( 1 , 2 ) Curative treatment can only be proposed in 10–20% of cases.
The main risk factors of HCC development are cirrhosis and hepatitis B and C that induce genetic alterations leading to preneoplastic, then neoplastic changes. The persistence of infection and/or cirrhosis often leads to tumoral relapse after surgical resection, observed in approximately 20% per year. Therefore, chemoprevention could play an important role in the therapeutic strategy of this disease.
In experimental carcinogenesis, preneoplastic foci of altered hepatocytes emerge weeks or months before the appearance of hepatocellular adenomas and HCC.( 3 ) Similar progression has been described in human hepatocarcinogenesis.( 4 ) This fact has led to the development of a number of in vivo systems to study early neoplasia in rat liver.( 5 ) The initiation‐promotion or two‐stage model of cancer development mimics the early events of the latent period of human carcinogenesis. The initiation stage of cancer development can be produced in rat liver by injection of DEN,( 6 ) a carcinogen that causes DNA ethylation and mutagenesis.( 7 ) Furthermore, DEN has been shown to induce tumors in rodents that closely mimic a subclass of human HCC.( 8 ) Injection of promoting agents, such as AAF, induces selective enhancement of proliferation of the initiated cell populations over non‐initiated cells in the target tissue.( 9 )
Somatostatin analogs (octreotide and lanreotide) are molecules that are widely used to control symptoms in patients with endocrine and growth hormone‐producing tumors. They have also been shown to have antiproliferative activity in several tumor models (for a review, see Susini and Buscail( 10 )). Direct antitumor effect is mediated through their binding with one of the five somatostatin receptors (sstr1–5), which are expressed with variable density among the different tumor types.( 11 ) Binding to sstr can lead to inhibition of the cell cycle, inhibition of growth factor production, and pro‐apopotic effects.( 10 ) It was recently shown that human HCC express sstr,( 12 ) mainly sstr2,( 13 ) sstr3, and sstr5.( 14 ) In rats, sstr have been shown to be expressed in activated hepatic stellate cells in CCl4‐treated rats( 15 ) and low levels of sstr2 mRNA were present in normal liver and hepatoma.( 16 ) Somatostatin analogs also exert indirect antitumor activity mainly by inhibiting tumoral neo‐angiogenesis( 17 ) and inhibition of growth factor release. They have shown antitumoral effects in liver cancer cell lines in vitro ( 18 , 19 , 20 , 21 ) and in in vivo animal models( 22 ) but showed conflicting results in clinical trials on humans with advanced cancer.( 23 , 24 , 25 , 26 , 27 ) Lanreotide has not been tested in a prophylactic setting.
In this study, we aimed to evaluate the effects of lanreotide on the early carcinogenic events induced by a two‐stage initiation/promotion model of hepatocarcinogenesis in rats. We studied its effects after initiation by DEN, and after initiation/promotion induced by DEN and AAF, on the formation of preneoplastic foci both in terms of number and size. These foci are best identified by the antibody raised against the placental form of rat GSTp. This isozyme has been described as the most effective single marker of hepatic preneoplasia in rat.( 28 )
We evaluated the effect of lanreotide on proliferation and apoptosis in the preneoplastic foci and the surrounding liver to gain insight into the mechanisms of the drug effects. We also focused on the expression of cyclins and cell cycle regulators p21waf1 and p27kip1, known to inhibit CdK and block the cell cycle in the G1 phase in liver cancer cell models in vitro.( 29 )
Materials and Methods
Animals and treatment. Male Wistar rats (180 ± 20 g) were purchased from Charles River Laboratories, Brussels, Belgium. They were maintained on an automatic 12 h light/dark cycle. All animals received humane care in compliance with the regulations of the Université catholique de Louvain.
All animals were subjected to a two‐phase carcinogenic model, as described elsewhere.( 30 ) Briefly, initiation was induced by DEN (Sigma Chemical, St. Louis, MO), injected intraperitoneally at a dose of 150 mg/kg body weight dissolved in saline, at weeks 0 and 2. The promotion phase was carried out using AAF (Sigma Chemical), dissolved in methyl sulfoxide then suspended in tricaprylin (Sigma Chemical) to a final concentration of 8 mg/mL. The rats received 20 mg/kg body weight of AAF/tricaprylin suspension by gavage for 4 consecutive days per week for 3 weeks or 6 weeks The rats were randomly assigned to one of the two experimental groups after the first DEN injection. A scheme of the experimental set‐up is shown in Fig. 1. Rats received either lanreotide (lanreotide group, n = 15), or no injection (induced group, n = 30). Lanreotide (gift from Ipsen, Merelbeke, Belgium) was dissolved in saline at a 3 mg/kg concentration, according to Ipsen–Beaufour toxicology data, and injected in the right thigh muscle, starting the day after the first DEN injection, then every 14 days. Food and water were accessible ad libitum. Ten rats of the induced group and five rats from the lanreotide group were killed at the end of the initiation period (DEN), after 3 weeks of the promotion course (DEN +3 weeks AAF) and after 6 weeks of the promotion course (DEN +6 weeks AAF). Rats were anesthetized by ether inhalation, livers were excised and samples of anterior and posterior lobes were immersed in 4% buffered formaldehyde for histological and immunohistochemical analyses. The remaining livers were snap‐frozen in liquid nitrogen and stored at –80°C for western blotting and RTq‐PCR. Rats matched for age were killed at the same time points and served as controls (CTL) for western blot and RTq‐PCR analyses.
Figure 1.
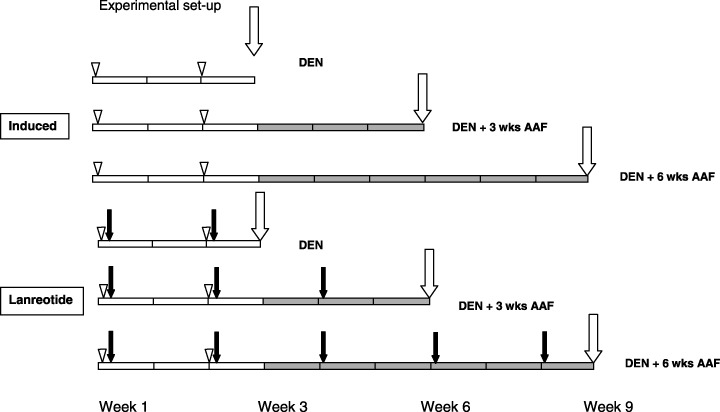
Scheme of the two‐stage carcinogenic model. Rats were randomly assigned to no treatment (induced, n = 30) or treatment with lanreotide (n = 15). Lanreotide was injected intramuscularly in the thigh, 3 mg/kg diluted in saline, once every 2 weeks, starting the day after the first diethylnitrosamine (DEN) injection (black arrows). Each group was submitted to DEN intraperitoneal injections at week 0 and week 2 (DEN, open arrowheads), followed by 1 week of rest. Then 2‐acetylaminofluorene (AAF; gray bars) was given by gavage four times per week for 3 weeks (DEN + 3 week AAF) or 6 weeks (DEN + 6 week AAF). Ten rats from the induced group and five rats from the lanreotide group were killed (vertical white arrows) at the end of initiation (DEN), after 3 weeks promotion (DEN + 3 week AAF) or after 6 weeks promotion (DEN + 6 week AAF).
Histology and immunohistochemistry. Liver sections were stained with hematoxilin–eosin according to standard procedures and analyzed by an expert liver pathologist (C. Sempoux).
Identification of preneoplastic foci. Immunohistochemical staining was carried out with an antibody raised against GSTp (1:100 dilution; MBL, Nagoya, Japan) revealed by the En‐Vision system (Dako, Denmark). Sections were counterstained with hematoxylin. For each animal, several low magnification fields (2.75 µm/pixel) that covered 1–1.5 cm2 of the liver sections were taken at random in a representative area and digitized through a Zeiss microscope using a KS‐400 system (Zeiss, Munich, Germany) coupled with a Dage MTI CCD72 camera (Michigan City, IN). The images were segmented by the operator in order to define GSTp‐labeled foci. The mean surface size of each focus and the ratio of stained area to total area were then measured and expressed as area percentage of liver section. The number of preneoplastic foci per square cm was derived from the digitized images using the Foci 3D estimation software (kind gift of Dr Xu and Dr Pitot, McArdle Laboratory for Cancer Research, Madison, WI) as described.( 31 ) Both number and area percentage of liver section as preneoplastic foci were determined, because each of these parameters measures different stages in the carcinogenic process.
Determination of proliferative index Liver sections (5 µm thick) from each animal were stained using an anti‐Ki67 antibody (1:50 dilution; Dako) and counterstained with hematoxylin. Using a 10× magnification field, at least 1000 hepatocytes were assessed for Ki67 labeling. Proliferative index was expressed as positive cells scored per 100 hepatocytes. Proliferative index was also determined using an antibody against the phospho‐Histone H3 (Ser10) (1:100 dilution; Cell Signaling Technology, Beverly, MA). To assess the proliferation activity in GSTp positive foci compared to surrounding hepatocytes between the experimental groups, slides were also examined after a double immunohistochemical staining with anti‐GSTp revealed in red with Fast Red (Sigma Chemical) and anti‐Ki67 antibody revealed in brown. The number of proliferating cells within GSTp‐positive foci and surrounding liver tissues was determined by examining at least 1000 and 5000 hepatocytes, respectively.
Determination of apoptotic index Quantitative analysis of apoptotic index was determined by double immunostaining using an antibody against cleaved caspase 3 (1:100 dilution, Cell Signaling Technology) revealed in brown with diaminobenzidine and anti‐GSTp revealed in red with Fast Red (Sigma Chemical).( 32 ) For the measurement of proliferative index, at least 1000 and 5000 cells were counted in preneoplastic foci and surrounding tissues, respectively. Apoptotic index was expressed as the number of apoptotic cells per 100 hepatocytes.
Western blot analysis. Liver homogenates (50–100 µg of proteins) were resolved on a sodium dodecyl sulfate–polyacrylamide gel and transferred to a polyvinylidene difluoride membrane (Hybond P; Amersham Pharmacia, UK). The following antibodies and incubation conditions were used: mouse polyclonal anticyclin D1 antibody (clone M‐20; Santa Cruz Biotechnology, Santa Cruz, CA) 1/2000 for 2 h at room temperature; rabbit polyclonal antip21waf1 (C‐17; Santa Cruz Biotechnology) 1/1000 overnight at 4°C; and rabbit polyclonal antip27kip1 (C‐19; Santa Cruz Biotechnology) 1/1000 overnight at 4°C. All incubations were carried out in Tris‐buffered saline containing 1% skimmed milk. The antigen–antibody reaction was visualized using an enhanced chemiluminescence detection system (Amersham Pharmacia) or the Renaissance Enhanced Luminol Reagent (NEN Life Science) and exposure of the membranes to X‐Omat Blue XB‐1 films (Kodak Scientific Imaging, Rochester, NY). All membranes were stripped and reprobed with β‐actin antibody to assess equivalence of protein loading. The amount of immunoreactive protein was quantified using a Gel Doc 2000 scanning device and software (Bio‐Rad, Nazareth, Belgium) and normalized to the β‐actin signal.
RNA isolation, reverse transcription and real‐time polymerase chain reaction. Total RNA was prepared from the frozen liver tissue using TriPure Isolation Reagent (Roche Diagnostics, Indianapolis, IN). RTq‐PCR was carried out as previously described by our group.( 33 ) The following primers were used: p21waf1 sense CCTGTTCCACACAGGAGCAA, antisense GATTGCGATGCGCTCATG; p27kip1 sense CTTCCGCCTGCAGAAAC, antisense CTAACCCGGGACTTGGAGAAG; and RPL19 sense AAGCGGATTCTCATGGAACA, antisense TGGTCAGCCAGGAGCTTCTT. Normal liver was used as CTL, with its value set to 1.
Statistical analysis. All results are expressed as mean + SE. Data were compared using the Mann–Whitney U‐test, with a P‐value less than 5% being considered as significant.
Results
There was no mortality during the experimental period. Body and liver weight were not affected by lanreotide, however, mean liver to body weight ratio was significantly less in lanreotide‐treated rats after DEN + 6 weeks AAF (3.7 ± 0.3%vs 5.1 ± 0.3%, P < 0.01).
At the pathological examination, in the induced group, after DEN alone, the architecture of the liver was normal, and the liver parenchyma was homogeneous with almost all hepatocytes showing an acidophilic granular cytoplasm. Some apoptotic bodies were seen. After DEN + 3 weeks AAF, the aspect of the parenchyma became more heterogeneous, due to the apparition of groups of hepatocytes with either a clear cytoplasm or a less granular acidophilic cytoplasm. Apoptotic bodies were more frequently seen. After DEN + 6 weeks AAF, the liver parenchyma contained large confluent areas of either clear or acidophilic hepatocytes with ground‐glass features separated by small strands of vacuolated hepatocytes mixed with apoptotic bodies.
The lanreotide‐treated livers showed roughly the same appearance at all time points.
Lanreotide inhibits the growth of preneoplastic foci induced by DEN and AAF. In the induced group, preneoplastic foci represented 2% of the area of liver section after DEN. This increased to 21% and 63.5% after 3 and 6 weeks of promotion, respectively (Fig. 2a,b). Conversely, because of the confluence of the foci, the number of preneoplastic foci per liver significantly decreased, from 23 × 104 after DEN to 7.7 × 10⁴ after DEN + 6 weeks AAF (Fig. 2a).
Figure 2.
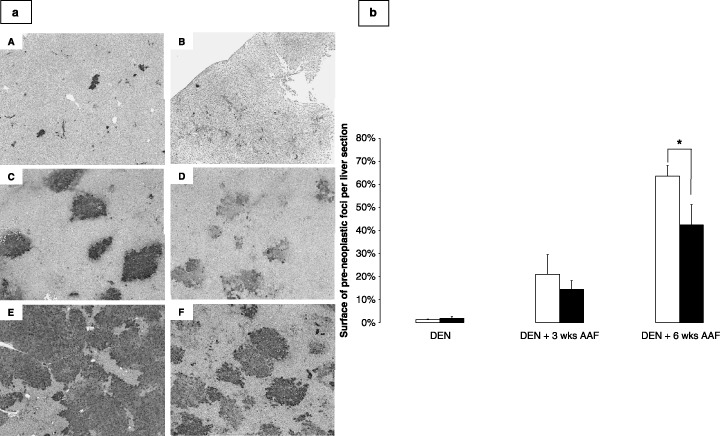
(a) Representative photomicrographs of the placental form of glutathione S‐transferase (GSTp) staining of induced rat livers after diethylnitrosamine (DEN) (A), DEN + 3 weeks 2‐acetylaminofluorene (AAF; C), and DEN + 6 weeks AAF (E), and in lanreotide‐treated rat livers after DEN (B), DEN + 3 weeks AAF (D), and DEN + 6 weeks AAF (F). Magnification 25×, GSTp antibody 1 : 100 dilution. (b) Graphs representing the area of GSTp positively stained foci as percentage of liver sections from rats after initiation (DEN), short (DEN + 3 weeks AAF) and long (DEN + 6 weeks AAF) promotion periods, in non‐treated rats (white bars) and rats treated with lanreotide (dashed bars). Each bar is mean + SE of five rats (*P < 0.05).
Lanreotide treatment did not affect the surface of the preneoplastic foci after DEN (Fig. 2a,b). After DEN + AAF, lanreotide decreased by 30% the area of the preneoplastic foci (21 ± 8%vs 14 ± 4%, NS). This decrease was significant after DEN + 6 weeks AAF (63.5 ± 14%vs 42 ± 19%, P < 0.05).
In terms of number of preneoplastic foci per square cm, no significant difference was observed between the two groups at any time point (data not shown).
Increase in size of the preneoplastic foci is due to increased proliferation of transformed hepatocytes, which is inhibited by lanreotide. Proliferation indices determined by Ki67 are shown in Fig. 3a,b. Induced rat livers showed significant proliferation, with a Ki67 expression in 13%, 14%, and 18% of hepatocyte nuclei in DEN, DEN + 3 weeks AAF and DEN + 6 weeks AAF, respectively. Lanreotide‐treated rat livers showed high proliferative indices after DEN, similar to that of the induced group, but the proliferation decreased to 9% (NS) and 5% (P < 0.01) after DEN + 3 weeks AAF and DEN + 6 weeks AAF, respectively. Proliferation assessed by phospho‐Histone H3 (Fig. 3c), showed a decrease in the lanreotide‐treated group compared to the animals receiving the induction scheme: 2.1 ± 0.2% versus 3.5 ± 1.5% (P < 0.05) and 2.7 ± 0.4% versus 3.8 ± 1.9% (NS) after DEN + 3 weeks AAF and DEN + 6 weeks AAF, respectively. In response to DEN, proliferative hepatocytes were found at random in the liver in both induced and lanreotide groups (Fig. 3a/A–B) with no clustering. On the contrary, after promotion by AAF, in the induced group (Fig. 3a/C–E), clusters of positive cells were found throughout the liver slices, with no predisposition for a specific lobular area, suggesting the preferential proliferation of some hepatocytes clones. This clustering was found in the lanreotide group, but the clusters were much smaller, with only groups of 2–3 cells found (Fig. 3a/D–F).
Figure 3.
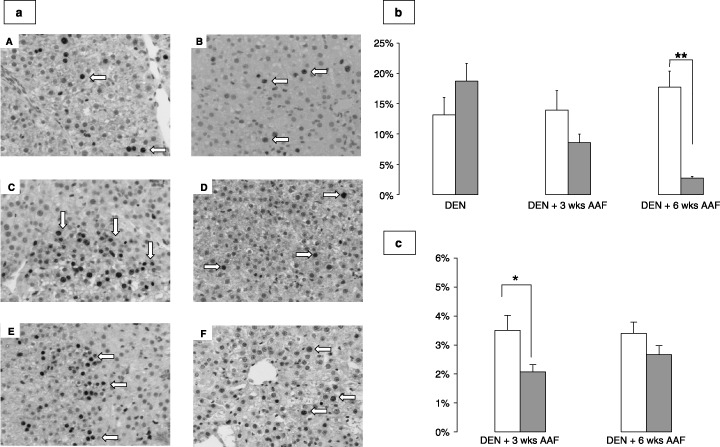
(a) Representative photomicrographs of Ki67 staining of induced rat livers after diethylnitrosamine (DEN) (A), DEN + 3 weeks 2‐acetylaminofluorene (AAF; C), and DEN + 6 weeks AAF (E), and in lanreotide‐treated rat livers after DEN (B), DEN + 3 weeks AAF (D), and DEN + 6 weeks AAF (F). Magnification 100×, Ki67 antibody 1:100 dilution. Positive nuclei are brown, shown by white arrows. Note the cluster pattern of staining in (C) and (E). (b) Percentage of hepatocyte nuclei labeled with Ki67 in induced (white bars) and lanreotide‐treated (dashed bars) rats after DEN, DEN + 3 weeks AAF, and DEN + 6 weeks AAF. Data are expressed as mean + SE, as percentages. **P < 0.01. (c) Percentage of hepatocyte nuclei labeled with phospho‐Histone H3 in induced (white bars) and lanreotide‐treated (dashed bars) rats after DEN + 3 weeks AAF and DEN + 6 weeks AAF. Data are expressed as mean + SE, as percentages. *P < 0.05 for induced versus lanreotide.
We carried out a double immunostaining detecting both Ki67 and GSTp expression, to see if the clustering of proliferative cells colocalized with the area of transformed hepatocytes. Indeed, as shown in Fig. 4(a,b) and Table 1, we observed that in the induced group after DEN + 3 weeks AAF, significantly more hepatocytes expressed Ki67 in preneoplastic foci compared to the surrounding liver. An enhanced proliferation was also found in the preneoplastic foci of the induced group after DEN + 6 weeks AAF, but the difference was not significant.
Figure 4.
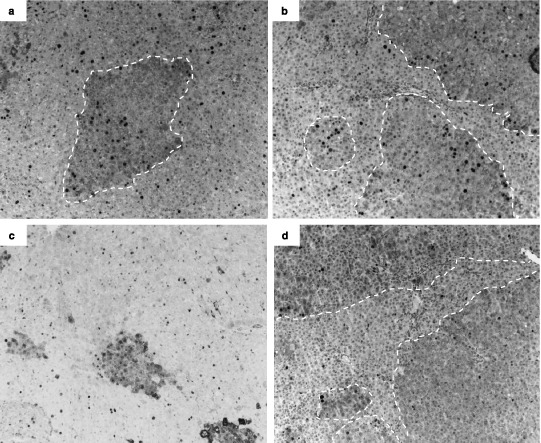
Representative photomicrographs of Ki67 and placental form of glutathione S‐transferase (Gstp) double immunostaining of induced rat liver sections after diethylnitrosamine (DEN) + 3 weeks 2‐acetylaminofluorene (AAF; a), DEN + 6 weeks AAF (b) and lanreotide‐treated rat livers after DEN + 3 weeks AAF (c), and DEN + 6 weeks AAF (d). Magnification 50×, Ki67 antibody 1:100 dilution, GSTp antibody 1 : 100 dilution. Positive Ki67 nuclei are black. GStp positive areas are highlighted by white dashed lines.
Table 1.
Proliferation indices in preneoplastic foci and surrounding liver in rats treated with diethylnitrosamine (DEN) and 2‐acetylaminofluorene (AAF)
| DEN + 3 weeks AAF | DEN + 6 weeks AAF | ||
|---|---|---|---|
| Induced | Preneoplastic foci (%) | 25.5 ± 1.9 | 19.7 ± 3.9 |
| Surrounding liver (%) | 13.3 ± 3.0* | 11.5 ± 4.5 | |
| Lanreotide | Preneoplastic foci (%) | 18.0 ± 3.0 | 9.0 ± 4.2 |
| Surrounding liver (%) | 15.0 ± 0.5 | 5.3 ± 2.5 | |
Percentage of nuclei labeled with Ki67 in preneoplastic foci and surrounding liver after the short (DEN + 3 weeks AAF) and long (DEN + 6 weeks AAF) promotion course. DEN was injected at a dose of 50 mg/kg IP twice, 2 weeks apart. Then AAF was given by gavage at a dose of 20 mg/kg for 3 or 6 weeks. Rats received either lanreotide dissolved in saline at a 3 mg/kg concentration, injected intramuscularly (lanreotide group, n = 15), or no injection (induced group, n = 30). All values are mean ± SE. *P < 0.05 for preneoplastic foci versus surrounding liver in the induced group.
Lanreotide‐treated animals showed decreased proliferation in preneoplastic foci after DEN + 3 weeks AAF and DEN + 6 weeks AAF compared to the induced group (Fig. 4c,d, Table 1), though not significantly due to inter‐individual variability. In contrast to the induced group, there was no significant difference in the lanreotide‐treated group between preneoplastic foci and surrounding parenchyma, either at DEN + 3 weeks or 6 weeks AAF.
Lanreotide inhibits the expression of cyclin D1 presumably by increasing the expression of the CdK inhibitors p21waf1 and p27kip1. To understand the mechanisms by which lanreotide decreased proliferation, we analyzed the protein expression of cyclin D1, involved in the G1–S cell cycle transition phase, and two CdK inhibitors, p21waf1 and p27kip1.
Figure 5(a,b) shows the differential effect observed on cyclin D1 at the three time points of the experiment. Compared to the induced group, lanreotide induced a strong inhibition of cyclin D1 expression after DEN and DEN + 6 weeks AAF. However, after DEN + 3 weeks AAF, cyclin D1 expression was increased in the lanreotide group compared to the induced group, though not significantly.
Figure 5.
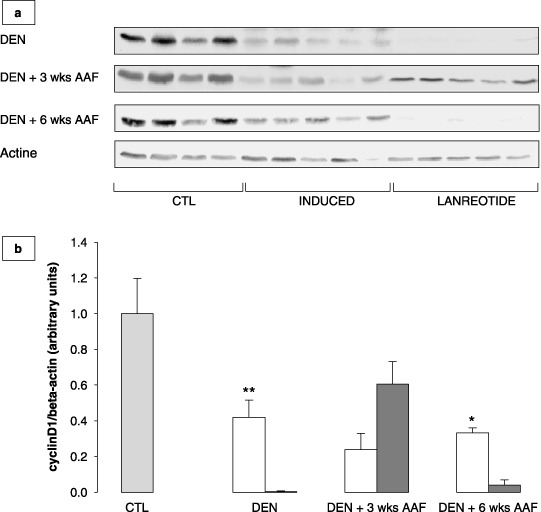
(a) Western blots showing cyclin D1 expression in normal liver taken as control (CTL), induced and lanreotide‐treated rats after initiation by diethylnitrosamine (DEN), initiation followed by 3 weeks promotion with 2‐acetylaminofluorene (AAF) (DEN + 3 weeks AAF) or 6 weeks promotion with AAF (DEN + 6 weeks AAF). (b) Cyclin D1 protein expression assessed by western blot, in induced (white bars) and lanreotide (dashed bars) treated rats after initiation by DEN (DEN), initiation followed by 3 weeks promotion with AAF (DEN + 3 weeks AAF) or 6 weeks promotion with AAF (DEN + 6 weeks AAF). CTL (gray bar) represents normal rat liver taken as the control. Each bar is mean + SE of five rats. *P < 0.05 for induced versus lanreotide; **P < 0.01 for induced versus lanreotide.
p21waf1 mRNA and protein expression are shown in Fig. 6. In the induced group after DEN (Fig. 6a), p21waf1 mRNA was initially significantly overexpressed compared to normal liver taken as CTL (P < 0.05). After DEN + 3 and 6 weeks AAF, it progressively decreased to the CTL level. In the lanreotide group, after DEN + 6 weeks AAF, p21waf1 mRNA expression was four times higher than in the induced group, as well as in CTL (P < 0.005). Protein expression of p21waf1 was downregulated in both the induced and lanreotide groups after DEN (Fig. 6b). Promotion by AAF resulted in progressive overexpression that resulted in a twofold increase compared to CTL after DEN + 6 weeks AAF in the induced group, and a threefold increase in the lanreotide group (NS for induced vs lanreotide).
Figure 6.
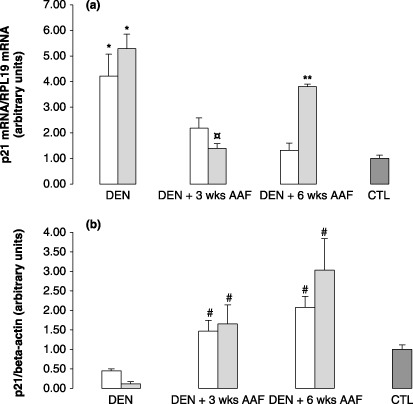
Graphs representing p21waf1: (a) mRNA expression determined by reverse transcription–quantitative polymerase chain reaction in the induced (white bars) and lanreotide (dashed bars) groups after initiation by diethylnitrosamine (DEN), initiation followed by 3 weeks promotion with 2‐acetylaminofluorene (AAF) (DEN + 3 weeks AAF) or 6 weeks promotion with AAF (DEN + 6 weeks AAF). CTL represents normal rat liver taken as the control. Each bar is mean + SE of five rats. § P < 0.05 for induced versus lanreotide; *P < 0.05 for induced and lanreotide versus CTL; **P < 0.01 for lanreotide versus induced. (b) Protein expression, assessed by western blot, in induced (white bars) and lanreotide (dashed bars) groups after initiation by DEN (DEN), initiation followed by 3 weeks promotion with AAF (DEN + 3 weeks AAF) or 6 weeks promotion with AAF (DEN + 6 weeks AAF). CTL represents normal rat liver taken as the control. Each bar is mean + SE of 5 rats. # P < 0.05 for induced and lanreotide versus CTL; *P < 0.05, induced versus lanreotide; $ P < 0.05 for induced versus CTL.
In contrast to p21waf1, DEN + AAF did not significantly alter the expression of p27kip1 mRNA compared to CTL (Fig. 7a). It was significantly reduced in induced rats after DEN + 3 weeks AAF compared to lanreotide and CTL (P < 0.005). No differences were noticed between the two groups after DEN or DEN + 6 weeks AAF. p27kip1 protein expression showed a progressive decrease in the induced group compared to CTL. However, although significantly decreased in the lanreotide group compared to the induced group after DEN, p27kip1 was significantly overexpressed in the lanreotide‐treated group after DEN + 6 weeks AAF compared to rats receiving the induction scheme, maintaining a level similar to CTL (Fig. 7b).
Figure 7.
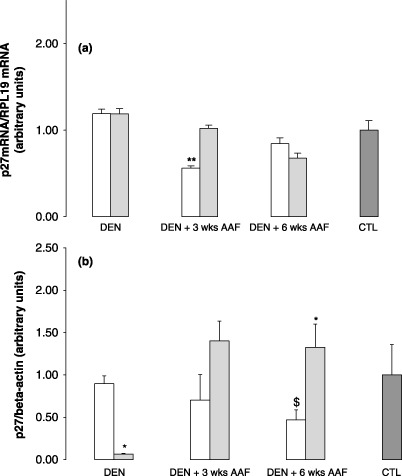
Graphs representing p27kip1: (a) mRNA expression determined by reverse transcription–quantitative polymerase chain reaction RTq‐PCR in the induced (white bars) and lanreotide (dashed bars) groups after initiation by diethylnitrosamine (DEN), initiation followed by 3 weeks promotion with 2‐acetylaminofluorene (AAF) (DEN + 3 weeks AAF) or 6 weeks promotion with AAF (DEN + 6 weeks AAF). CTL represents normal rat liver taken as the control. Each bar is mean + SE of five rats. § P < 0.05 for induced versus lanreotide; *P < 0.05 for induced and lanreotide versus CTL; **P < 0.01 for lanreotide and CTL versus induced. (b) Protein expression assessed by western blot, in induced (white bars) and lanreotide (dashed bars) after initiation by DEN (DEN), initiation followed by 3 weeks promotion with AAF (DEN + 3 weeks AAF) or 6 weeks promotion with AAF (DEN + 6 weeks AAF). CTL represents normal rat liver taken as the control. Each bar is mean + SE of five rats. # P < 0.05 for induced and lanreotide versus CTL; *P < 0.05, induced versus lanreotide; $ P < 0.05 for induced versus CTL.
Effect of lanreotide on apoptotis. In induced rats, the apoptotic index was lower in preneoplastic foci than in surrounding liver after DEN + 3 weeks AAF (Table 2). This finding was confirmed after a longer promotion period (DEN + 6 weeks AAF), with a threefold increase in the number of cleaved caspase 3 positive cells in the surrounding liver compared to preneoplastic foci (P < 0.005). This difference in the apoptotic index between preneoplastic foci and surrounding liver was not found in the lanreotide‐treated group. Compared to the rats receiving the induction scheme only, we observed a dual effect in the lanreotide‐treated group: first, a moderate and non‐significant decrease of apoptosis after DEN + 3 weeks AAF; then a significant increase after DEN + 6 weeks AAF, both in preneoplastic foci and surrounding liver.
Table 2.
Apoptotic indices in preneoplastic foci and surrounding liver in rats treated with diethylnitrosamine (DEN) and 2‐acetylaminofluorene (AAF)
| DEN + 3 weeks AAF | DEN + 6 weeks AAF | ||
|---|---|---|---|
| Induced | Preneoplastic foci (%) | 0.54 ± 0.21 | 0.22 ± 0.04 |
| Surrounding liver (%) | 0.81 ± 0.37 | 0.65 ± 0.06* | |
| Lanreotide | Preneoplastic foci (%) | 0.33 ± 0.04 | 1.06 ± 0.45** |
| Surrounding liver (%) | 0.35 ± 0.06 | 1.02 ± 0.16[Link], [Link] | |
Percentage of nuclei labeled with cleaved caspase‐3 in preneoplastic foci and surrounding liver after the short (DEN + 3 weeks AAF) and long (DEN + 6 weeks AAF) promotion course. DEN was injected at a dose of 50 mg/kg IP twice, 2 weeks apart. The AAF was given by gavage at a dose of 20 mg/kg for 3 or 6 weeks. Rats received either lanreotide dissolved in saline at a 3 mg/kg concentration, injected intramuscularly (lanreotide group, n = 15), or no injection (induced group, n = 30). All values are mean ± SE. *P < 0.005 for preneoplastic foci versus surrounding liver in the induced group. **P < 0.05 for induced versus lanreotide in preneoplastic foci. ***P < 0.05 for induced versus lanreotide in surrounding liver. ****P < 0.05 for DEN + 3 weeks AAF versus DEN + 6 weeks AAF in surrounding liver.
Discussion
There is a solid rationale to justify a chemopreventive approach to treat HCC. The disease is gaining incidence, the etiologic factors are known (mainly alcohol, and hepatitis B and C viruses), and the surveillance program of patients is increasingly common. However, no established drug has proved unequivocally efficient in the chemoprevention of HCC. Interferon showed some effect in hepatitis C cirrhotic patients in primary( 34 ) and secondary( 35 , 36 , 37 ) prevention, only in Japanese patients. With less evidence, acyclic retinoids also showed some effect in secondary prevention.( 38 )
Here, we analyzed the inhibitory effect of lanreotide on the appearance of early hepatic preneoplastic events, using a two‐stage carcinogenic model combining DEN and AAF in rats. This model, and other similar models using carcinogens to induce preneoplastic changes, have already been used many times to assess chemoprevention (e.g., de Lujan Alvarez M et al., ( 30 ) Nakaji M et al.,( 39 ) and Sakakima Y et al.( 40 )). Athough not perfect, we believe the model allows a sequential analysis of the effect of chemoprevention after cell initiation, sometimes called the “first hit”, by DEN injection; then the clonal expansion of these modified cells through promotion, leading to the formation of preneoplastic, reversible, foci. (41) The “second hit”, also called progression, has voluntarily not been assessed. The number of these preneoplastic foci reflects the amount of cells capable of undergoing clonal expansion, whereas the surface percentage reflects the growth rate and total cellular population of the preneoplastic foci.( 42 ) We observed the formation of preneoplastic foci, revealed by GSTp positive staining, after the injection of DEN. Their size increased in parallel with the duration of subsequent AAF injections. Due to the confluence of the foci, the number of preneoplastic foci decreased along the promotion phase.
We showed that lanreotide significantly decreased the size of these preneoplastic foci after a long promotion period, that is, after 6 weeks of AAF and five lanreotide injections.
At all time points, the carcinogenic process was associated with high levels of hepatocyte proliferation, as shown in Fig. 3. This proliferation rate was mainly seen in preneoplastic foci, compared to surrounding liver, as already described when AAF is used as the promoting agent, in contrast with other agents such as phenobarbital.( 43 ) Lanreotide did not decrease the proliferation rate after the DEN injections, suggesting that it is not active during the initiation phase, that is, the induction of transformed hepatocytes. However, we could see an inhibitory effect, proportional to the AAF promotion duration, suggesting that lanreotide had a specific growth control effect on hepatocytes selected by AAF. Indeed, by using double immunostaining, we could show that lanreotide specifically decreased proliferation in preneoplastic foci after promotion with AAF, to values observed in the non‐preneoplastic surrounding liver.
An alternative explanation for this inhibitory effect could be an interference with the metabolism of AAF by lanreotide. However, it seems not to be the case. Indeed, AAF is a mutagen that is activated through critical enzymatic steps involving cytochrome P450 (CYP1A2).( 44 ) To our knowledge, lanreotide does not interfere with CYP1A2, neither directly nor through growth hormone (GH) inhibition.( 45 , 46 )
In vitro studies have proposed that somatostatin analogs might control liver cancer cell proliferation by inducing the expression of CdK inhibitors, particularly p27kip1( 47 ) and our in vivo data supports this view. Selective promotion of preneoplastic hepatocytes through AAF is accompanied by a progressive decrease in p27kip1 protein expression in the induced group compared to normal liver, where it is known to be expressed constitutively.( 48 ) Lanreotide treatment was associated with a significant increase of 27kip1 expression compared to the induced group after DEN + 3 and 6 weeks AAF, but not after DEN only, where a significant decrease was observed. This again favors the hypothesis that lanreotide is active during the promotion phase, rather than during the emergence of transformed hepatocytes. In contrast, although p21waf1 mRNA expression was induced in the lanreotide group compared to the induced group after DEN + 6 weeks AAF, this increase was not associated with a significant difference in p21waf1 protein expression between the induced and lanreotide‐treated groups, both being increased compared to CTL. Thus it appears that the effect of lanreotide is not mediated through a p21waf1‐dependent inhibition of the cell cycle. As it has been shown that cyclin D1 mRNA expression is higher in preneoplastic foci than in surrounding liver( 40 ) we speculate that the decreased cyclin D1 expression we found in the lanreotide group reflected its inhibition in the preneoplastic foci. Discrepancies between the results observed after DEN + 3 weeks AAF (no significant difference in proliferation or cyclin D1 expression) and DEN + 6 weeks AAF (significant decrease in proliferation and cyclin D1 expression, increase in p27kip1 expression) suggest the necessity of a prolonged exposure to lanreotide to benefit from its antiproliferative effect.
Thus, our data are consistent with the hypothesis that p27kip1 is a factor associated with the inhibitory effect of lanreotide on the proliferation of preneoplastic cells, through a decrease of cyclin D1. This is the first time the in vivo effects of lanreotide in controlling growth in a liver carcinogenic model have been shown.
Cell death by apoptosis is another mechanism that could explain the reduced proportion of transformed hepatocytes under lanreotide treatment in our model. Somatostatin analogs have shown pro‐apoptotic activity in many cancer types, through p53‐dependent or independent pathways.( 10 ) p53 is a well‐known tumor suppressor gene activated by DNA damaging. The production of p53 protein leads to the activation of DNA repair or, when impossible, to apoptosis. Our results show enhanced apoptosis in the surrounding liver of induced animals compared to preneoplastic foci after DEN + 6 weeks AAF. This is in contradiction with previous reports( 30 ) but favors the hypothesis that initiated cells selected by AAF have a survival advantage.( 9 , 43 ) The findings that liver preneoplastic foci do not accumulate p53 in response to DNA damage induced by DEN further supports this view.( 49 ) Lanreotide induced apoptosis both in preneoplastic and surrounding liver after DEN + 6 weeks AAF. As we could not show a difference in p53 mRNA and protein expression in the lanreotide‐treated group compared to the induced group (data not shown) at that time point, we suggest that p53 does not play a major role in the apoptotic effect of lanreotide. p21waf1 has been shown to induce apoptosis in p53‐deficient models.( 50 ) As we observed an increased p21waf1 expression in the lanreotide group after DEN + 6 weeks AAF, the enhanced apoptotic activity induced by lanreotide in both preneoplastic foci and surrounding liver might be related to p21waf1.
In conclusion, lanreotide showed activity in inhibiting the development of preneoplastic foci in a carcinogenic animal liver model using DEN and AAF. This resulted from a reduction in the size of the preneoplastic foci rather than in their number, suggesting that lanreotide controls the growth of preneoplastic foci but not the emergence of cell transformation. Our data suggest that these effects on proliferation and apoptosis might be mediated through an increased expression of the CdK inhibitor p27kip1, which occurred during the promotion phase of this two‐stage model, and through apoptosis. It would be interesting to evaluate its effect in chemoprevention of HCC in animal models to confirm these results. Lanreotide, together with an agent able to reduce the preneoplastic transformation of hepatocytes (such as interferon alpha( 30 )), might have a synergistic effect on the control of HCC development.
References
- 1. Parkin DM, Bray F, Ferlay J, Pisani P. Estimating the world cancer burden: Globocan 2000. Int J Cancer 2001; 94: 153–6. [DOI] [PubMed] [Google Scholar]
- 2. El‐Serag HB, Mason AC. Rising incidence of hepatocellular carcinoma in the United States. N Engl J Med 1999; 340: 745–50. [DOI] [PubMed] [Google Scholar]
- 3. Williams GM. The significance of chemically‐induced hepatocellular altered foci in rat liver and application to carcinogen detection. Toxicol Pathol 1989; 17: 663–72; discussion 673–4. [DOI] [PubMed] [Google Scholar]
- 4. Altmann HW. Hepatic neoformations. Pathol Res Pract 1994; 190: 513–77. [DOI] [PubMed] [Google Scholar]
- 5. Goldsworthy TL, Hanigan MH, Pitot HC. Models of hepatocarcinogenesis in the rat – contrasts and comparisons. Crit Rev Toxicol 1986; 17: 61–89. [DOI] [PubMed] [Google Scholar]
- 6. Solt D, Farber E. New principle for analysis of chemical carcinogenesis. Nature 1976; 263: 701–3. [Google Scholar]
- 7. Becker RA, Shank RC. Kinetics of formation and persistence of ethylguanines in DNA of rats and hamsters treated with diethylnitrosamine. Cancer Res 1985; 45: 2076–84. [PubMed] [Google Scholar]
- 8. Lee JS, Chu IS, Mikaelyan A et al . Application of comparative functional genomics to identify best‐fit mouse models to study human cancer. Nat Genet 2004; 36: 1306–11. [DOI] [PubMed] [Google Scholar]
- 9. Dragan YP, Hully J, Crow R, Mass M, Pitot HC. Incorporation of bromodeoxyuridine in glutathione S‐transferase‐positive hepatocytes during rat multistage hepatocarcinogenesis. Carcinogenesis 1994; 15: 1939–47. [DOI] [PubMed] [Google Scholar]
- 10. Susini C, Buscail L. Rationale for the use of somatostatin analogs as antitumor agents. Ann Oncol 2006; 17: 1733–42. [DOI] [PubMed] [Google Scholar]
- 11. Reubi JC, Waser B, Schaer JC, Laissue JA. Somatostatin receptor sst1‐sst5 expression in normal and neoplastic human tissues using receptor autoradiography with subtype‐selective ligands. Eur J Nucl Med 2001; 28: 836–46. [DOI] [PubMed] [Google Scholar]
- 12. Reynaert H, Rombouts K, Vandermonde A et al . Expression of somatostatin receptors in normal and cirrhotic human liver and in hepatocellular carcinoma. Gut 2004; 53: 1180–9. [DOI] [PMC free article] [PubMed] [Google Scholar]
- 13. Reubi JC, Zimmermann A, Jonas S et al . Regulatory peptide receptors in human hepatocellular carcinomas. Gut 1999; 45: 766–74. [DOI] [PMC free article] [PubMed] [Google Scholar]
- 14. Blaker M, Schmitz M, Gocht A et al . Differential expression of somatostatin receptor subtypes in hepatocellular carcinomas. J Hepatol 2004; 41: 112–8. [DOI] [PubMed] [Google Scholar]
- 15. Reynaert H, Vaeyens F, Qin H et al . Somatostatin suppresses endothelin‐1‐induced rat hepatic stellate cell contraction via somatostatin receptor subtype 1. Gastroenterology 2001; 121: 915–30. [DOI] [PubMed] [Google Scholar]
- 16. Yamada Y, Post SR, Wang K, Tager HS, Bell GI, Seino S. Cloning and functional characterization of a family of human and mouse somatostatin receptors expressed in brain, gastrointestinal tract, and kidney. Proc Natl Acad Sci USA 1992; 89: 251–5. [DOI] [PMC free article] [PubMed] [Google Scholar]
- 17. Jia WD, Xu GL, Xu RN et al . Octreotide acts as an antitumor angiogenesis compound and suppresses tumor growth in nude mice bearing human hepatocellular carcinoma xenografts. J Cancer Res Clin Oncol 2003; 129: 327–34. [DOI] [PMC free article] [PubMed] [Google Scholar]
- 18. Chen X, Liu Z, Ai Z. Antineoplastic mechanism of Octreotide action in human hepatoma. Chin Med J (Engl) 2001; 114: 1167–70. [PubMed] [Google Scholar]
- 19. Liu HL, Huo L, Wang L. Octreotide inhibits proliferation and induces apoptosis of hepatocellular carcinoma cells. Acta Pharmacol Sin 2004; 25: 1380–6. [PubMed] [Google Scholar]
- 20. Notas G, Kolios G, Mastrodimou N et al . Cortistatin production by HepG2 human hepatocellular carcinoma cell line and distribution of somatostatin receptors. J Hepatol 2004; 40: 792–8. [DOI] [PubMed] [Google Scholar]
- 21. Raderer M, Hejna MH, Muller C et al . Treatment of hepatocellular cancer with the long acting somatostatin analog lanreotide in vitro and in vivo . Int J Oncol 2000; 16: 1197–201. [DOI] [PubMed] [Google Scholar]
- 22. Schindel DT, Grosfeld JL. Hepatic resection enhances growth of residual intrahepatic and subcutaneous hepatoma, which is inhibited by octreotide. J Pediatr Surg 1997; 32: 995–7; discussion 997–8. [DOI] [PubMed] [Google Scholar]
- 23. Barbare JC, Bouche O, Bonnetain F, Lombard‐Bohas C et al ., Fédération Francophone de Cancérologie Digestive . Treatment of advanced hepatocellular carcinoma with long‐acting octreotide: preliminary results of a randomized placebo‐controlled trial (FFCD‐ANGH 2001–01 CHOC). J Clin Oncol 2005; 23 (Sup pl): 4036. [Google Scholar]
- 24. Kouroumalis E, Skordilis P, Thermos K, Vasilaki A, Moschandrea J, Manousos ON. Treatment of hepatocellular carcinoma with octreotide: a randomised controlled study. Gut 1998; 42: 442–7. [DOI] [PMC free article] [PubMed] [Google Scholar]
- 25. Yuen MF, Poon RT, Lai CL et al . A randomized placebo‐controlled study of long‐acting octreotide for the treatment of advanced hepatocellular carcinoma. Hepatology 2002; 36: 687–91. [DOI] [PubMed] [Google Scholar]
- 26. Cebon J. Somatostatin receptor expression, tumour response, and quality of life in patients with advanced hepatocellular carcinoma treated with long‐acting octreotide. Br J Cancer 2006; 95: 853–61. [DOI] [PMC free article] [PubMed] [Google Scholar]
- 27. Becker G, Allgaier HP, Olschewski M, Zahringer A, Blum HE, HECTOR Study Group . Long‐acting octreotide versus placebo for treatment of advanced HCC: a randomized controlled double‐blind study. Hepatology 2007; 45: 9–15. [DOI] [PubMed] [Google Scholar]
- 28. Imai T, Masui T, Ichinose M et al . Reduction of glutathione S‐transferase P‐form mRNA expression in remodeling nodules in rat liver revealed by in situ hybridization. Carcinogenesis 1997; 18: 545–51. [DOI] [PubMed] [Google Scholar]
- 29. Charland S, Boucher MJ, Houde M, Rivard N. Somatostatin inhibits Akt phosphorylation and cell cycle entry, but not p42/p44 mitogen‐activated protein (MAP) kinase activation in normal and tumoral pancreatic acinar cells. Endocrinology 2001; 142: 121–8. [DOI] [PubMed] [Google Scholar]
- 30. de Lujan Alvarez M, Cerliani JP, Monti J et al . The in vivo apoptotic effect of interferon alfa‐2b on rat preneoplastic liver involves Bax protein. Hepatology 2002; 35: 824–33. [DOI] [PubMed] [Google Scholar]
- 31. Xu YH, Pitot HC. An improved stereologic method for three‐dimensional estimation of particle size distribution from observations in two dimensions and its application. Comput Methods Programs Biomed 2003; 72: 1–20. [DOI] [PubMed] [Google Scholar]
- 32. Duan WR, Garner DS, Williams SD, Funckes‐Shippy CL, Spath IS, Blomme EA. Comparison of immunohistochemistry for activated caspase‐3 and cleaved cytokeratin 18 with the TUNEL method for quantification of apoptosis in histological sections of PC‐3 subcutaneous xenografts. J Pathol 2003; 199: 221–8. [DOI] [PubMed] [Google Scholar]
- 33. Starkel P, Bishop K, Horsmans Y, Strain AJ. Expression and DNA‐binding activity of signal transducer and activator of transcription 3 in alcoholic cirrhosis compared to normal liver and primary biliary cirrhosis in humans. Am J Pathol 2003; 162: 587–96. [DOI] [PMC free article] [PubMed] [Google Scholar]
- 34. Camma C, Giunta M, Andreone P, Craxi A. Interferon and prevention of hepatocellular carcinoma in viral cirrhosis: an evidence‐based approach. J Hepatol 2001; 34: 593–602. [DOI] [PubMed] [Google Scholar]
- 35. Ikeda K, Arase Y, Saitoh S et al . Interferon beta prevents recurrence of hepatocellular carcinoma after complete resection or ablation of the primary tumorA prospective randomized study of hepatitis C‐related liver cancer. Hepatology 2000; 32: 228–32. [DOI] [PubMed] [Google Scholar]
- 36. Kubo S, Nishiguchi S, Hirohashi K, Tanaka H, Shuto T, Kinoshita H. Randomized clinical trial of long‐term outcome after resection of hepatitis C virus‐related hepatocellular carcinoma by postoperative interferon therapy. Br J Surg 2002; 89: 418–22. [DOI] [PubMed] [Google Scholar]
- 37. Suou T, Mitsuda A, Koda M et al . Interferon alpha inhibits intrahepatic recurrence in hepatocellular carcinoma with chronic hepatitis C: a pilot study. Hepatol Res 2001; 20: 301–11. [DOI] [PubMed] [Google Scholar]
- 38. Muto Y, Moriwaki H, Saito A. Prevention of second primary tumors by an acyclic retinoid in patients with hepatocellular carcinoma. N Engl J Med 1999; 340: 1046–7. [DOI] [PubMed] [Google Scholar]
- 39. Nakaji M, Yano Y, Ninomiya T et al . IFN‐alpha prevents the growth of pre‐neoplastic lesions and inhibits the development of hepatocellular carcinoma in the rat. Carcinogenesis 2004; 25: 389–97. [DOI] [PubMed] [Google Scholar]
- 40. Sakakima Y, Hayakawa A, Nagasaka T, Nakao A. Prevention of hepatocarcinogenesis with phosphatidylcholine and menaquinone‐4. In vitro and in vivo experiments. J Hepatol 2007; 47: 83–92. [DOI] [PubMed] [Google Scholar]
- 41. Pitot HC. Altered hepatic foci: their role in murine hepatocarcinogenesis. Annu Rev Pharmacol Toxicol 1990; 30: 465–500. [DOI] [PubMed] [Google Scholar]
- 42. Dragan YP, Campbell HA, Baker K, Vaughan J, Mass M, Pitot HC. Focal and non‐focal hepatic expression of placental glutathione S‐transferase in carcinogen‐treated rats. Carcinogenesis 1994; 15: 2587–91. [DOI] [PubMed] [Google Scholar]
- 43. Tatematsu M, Aoki T, Kagawa M, Mera Y, Ito N. Reciprocal relationship between development of glutathione S‐transferase positive liver foci and proliferation of surrounding hepatocytes in rats. Carcinogenesis 1988; 9: 221–5. [DOI] [PubMed] [Google Scholar]
- 44. Verna L, Whysner J, Williams GM. 2‐Acetylaminofluorene mechanistic data and risk assessment: DNA reactivity, enhanced cell proliferation and tumor initiation. Pharmacol Ther 1996; 71: 83–105. [DOI] [PubMed] [Google Scholar]
- 45. Rasmussen E, Eriksson B, Oberg K, Bondesson U, Rane A. Selective effects of somatostatin analogs on human drug‐metabolizing enzymes. Clin Pharmacol Ther 1998; 64: 150–9. [DOI] [PubMed] [Google Scholar]
- 46. Blanck A, Hansson T, Eriksson LC, Gustafsson JA. Growth hormone modifies the growth rate of enzyme‐altered hepatic foci in male rats treated according to the resistant hepatocyte model. Carcinogenesis 1987; 8: 1585–8. [DOI] [PubMed] [Google Scholar]
- 47. Pages P, Benali N, Saint‐Laurent N et al . sst2 somatostatin receptor mediates cell cycle arrest and induction of p27 (Kip1). Evidence for the role of SHP‐1. J Biol Chem 1999; 274: 15186–93. [DOI] [PubMed] [Google Scholar]
- 48. Kwon YH, Jovanovic A, Serfas MS, Kiyokawa H, Tyner AL. P21 functions to maintain quiescence of p27‐deficient hepatocytes. J Biol Chem 2002; 277: 41417–22. [DOI] [PubMed] [Google Scholar]
- 49. Lennartsson P, Hogberg J, Stenius U. Wild‐type p53 expression in liver tissue and in enzyme‐altered foci: an in vivo investigation on diethylnitrosamine‐treated rats. Carcinogenesis 1998; 19: 1231–7. [DOI] [PubMed] [Google Scholar]
- 50. Hsu SL, Chen MC, Chou YH, Hwang GY, Yin SC. Induction of p21 (CIP1/Waf1) and activation of p34 (cdc2) involved in retinoic acid‐induced apoptosis in human hepatoma Hep3B cells. Exp Cell Res 1999; 248: 87–96. [DOI] [PubMed] [Google Scholar]