

Abstract
N‐acetyl‐cysteine (NAC) has been reported to have anticancer properties such as counteractions against mutagens and prevention of tumor progression by scavenging reactive oxygen species (ROS). However, here we report that NAC can enhance the anchorage‐independent growth of cells transformed by activated ABL tyrosine kinases or Ras. This effect was not dependent on loss of focal adhesion kinase activation. NAC rescued cell growth that was suppressed by heat shock protein (Hsp) 90 inhibitors possibly by chemical modification of their quinone moiety. NAC rendered Rat1/BCR‐ABL cells resistance to a Ras inhibitor manumycin in soft agar colony formation. In the absence of Hsp90 inhibitors, NAC stimulated the activation of MAP kinase in BCR‐ABL‐transformed but not in the parental Rat1 cells. We propose that NAC should be used carefully in cancer treatment. (Cancer Sci 2005; 96: 240 –244)
The transforming activity of the BCR‐ABL oncoprotein can be suppressed by reagents that inhibit its intrinsic tyrosine kinase (TK) activity or heat shock protein (Hsp) 90 that is assumed to stabilize it. (1) An ABL TK inhibitor imatinib, the most powerful drug in the current treatment of chronic myeloid leukemias (CML), now faces on an issue of resistance due to mutations in the BCR‐ABL sequences. Hsp90 inhibitors, if engineered to be safe in clinical usage, would be expected to overcome this obstacle as even the mutated BCR‐ABL can be degraded by the proteasome machinery. (1) Transformation by a variety of tyrosine kinase oncogenes has been reported to be reversed by benzoquinone ansamycins such as geldanamycin (GA). (2) The crystal structure studies have demonstrated that GA binds to the ADP/ATP‐binding site in Hsp90 and alters its chaperoning function. BCR‐ABL was shown to produce reactive oxygen species (ROS). (3) This could possibly be achieved through Grb2‐ or Shc‐mediated Ras activation as activated Ras alone can generate ROS. (4) A thiol antioxidant N‐acetyl‐cysteine (NAC) has been shown to inhibit mitogenic activity of v‐H‐Ras in NIH3T3 as judged by a short‐term assay of [3H] thymidine incorporation for 4 h. (4) NAC was also shown to have a chemopreventive effect on the progression of Kaposi's sarcoma by decreasing expression of vascular endothelial growth factor (VEGF). (5) Increased serum VEGF has been detected in myeloid leukemias including CML. (6) All of the above information suggest that NAC could be effective in CML treatment. However, here we report antithetical data that illustrate its potentially hazardous effects.
Materials and Methods
Cells and animal experiments. Rat1 cells transformed by P210BCR‐ABL or v‐ABL, Ba/F3 cells that acquired growth factor independence by P210BCR‐ABL (7) NP31 endothelial cells transformed by an activated form of the Flt‐1 kinase BCR‐FLTm1 (8) or temperature‐sensitive (ts) v‐Ki‐Ras (9) and focal adhesion kinase (FAK)‐deficient mouse embryonic fibroblasts (MEF) transformed by BCR‐FLTm1 (10) have been described in previous studies. For tumor challenge in mice, approximately 106 Rat1/BCR‐ABL cells in 0.2 mL of culture medium was subcutaneously transplanted in 6‐week‐old male nude mice and the weight of the tumors was measured 4 weeks after injection.
Biological assays. Soft agar colony assay with or without chemicals was performed as described previously. (7) Macroscopic colony numbers were counted after 4 weeks and statistically expressed as mean ± SD from three independent experiments. Cell growth in usual liquid cultures was evaluated either by counting trypan blue‐unstainable cells or by Alamar Blue assay (Biosource International). Statistical results were expressed as mean ± SD with three or four independent experiments. Statistical significance was evaluated by one‐way analysis (ANOVA), followed by Bonferroni/Dunn's test. A value of P < 0.05 was accepted as significant.
Chemicals, antibodies, and molecular analysis. Chemical reagents include NAC (SIGMA), imatinib mesylate (Novartis), Hsp90 inhibitors geldanamycin and radicicol (SIGMA), ROS scavenger Tiron (Tokyo Kasei), antioxidant probucol (SIGMA), and manumycin (SIGMA), and were applied to cell cultures at indicated concentrations. Anti‐ABL and anti‐CDC6 antibodies were purchased from Santa Cruz, antiactin from Chemicon, anti‐Hsp90 from NeoMarkers, antiphospho‐MAPK (pMAPK) from Promega, anti‐MAPK from Promega, and antiphospho‐Akt (pAkt) (Ser473) from New England Biolabs. Western blotting was performed as described before. (7) Briefly, cells plated into soft agar‐coated dishes did not attach at the bottom and were collected by gently swirling the dishes followed by filtration through gauge to remove agar debris. Cells in usual culture dishes were collected by cell scrapers. Cells were then washed twice with phosphate‐buffered saline (pH 7.4) and lyzed with lysis buffers (50 mM HEPES, pH 7.4–150 mM NaCl‐1% Triton X‐100–2 mM Na3VO3–10 mM NaF‐10 mM pyrophosphate‐1 mM EDTA‐1 mM phenylmethylsulfonyl fluoride‐20 µg/mL‐leupeptin‐0.02%SDS). Total lysates (usually 100 µg) or immunoprecipitates were run on SDS‐PAGE slab gels. The gel was transblotted on a nitrocellulose membrane (Amersham) and incubated with 5% bovine serum albumin for blocking. After incubation with appropriate antibodies, filters were subjected to washing and enhanced chemiluminescence (ECL) western blotting detection procedures (Amersham). Intensity of bands was quantified by NIH image. NAC at 500 mM in phosphate‐buffered saline and 10 mM GA in DMSO were mixed:(1:1) at room temperature for 10 min to allow chemical reactions. Mixtures were analyzed by thin layer ascending chromatography by utilizing silicagel 60 F254 (Merk) in buffers (ethyl acetate : methanol = 10:1), which was then visualized by ultraviolet. (11)
Results
Both imatinib and GA efficiently suppressed soft agar colony formation by Rat1 fibroblasts expressing BCR‐ABL (Rat1/BCR‐ABL) (Fig. 1a). Surprisingly, colonies were dramatically recovered by N‐acetyl‐cysteine (NAC) in GA‐ but not imatinib‐treated cells. Anti‐ABL western blotting of total cell lysates from usual liquid cultures revealed that BCR‐ABL degraded with GA, which was rescued by NAC (compare lanes 4 and 5 in Fig. 1a). NAC alone also increased the BCR‐ABL expression level by roughly two‐fold as judged by densitometric analysis (Fig. 1, lower panel). The counteraction of NAC against GA was also observed in hematopoietic Ba/F3 cells expressing BCR‐ABL (Ba/F3/BCR‐ABL) in suspension cultures (Fig. 1b). We suspected that the sulfhydryl group of NAC interacts with the quinone moiety of GA leading to its inactivation. This idea was supported by the in vitro reaction between those two molecules as shown in Fig. 1c. Surprisingly, however, even in the absence of GA, NAC stimulated growth in both Rat1/BCR‐ABL in soft agar and Ba/F3/BCR‐ABL in suspension cultures (Figs 1a.b). This implies that NAC could also modify cellular molecules involved in growth signaling. Those effects were not observed with other antioxidants such as Tiron and probucol (Fig. 2). NAC never gave soft agar colonies in Rat1 cells without BCR‐ABL expression. We found no significant growth‐promoting effect by NAC in usual liquid cultures of those cells as judged by Alamar Blue assay (Biosource International) (values with NAC at 5 mM relative to those without were 93.9% and 101.7% in Rat1 and Rat1/BCR‐ABL cells, respectively), suggesting that growth enhancement by NAC requires both BCR‐ABL and anchorage independence (Fig. 2).
Figure 1.
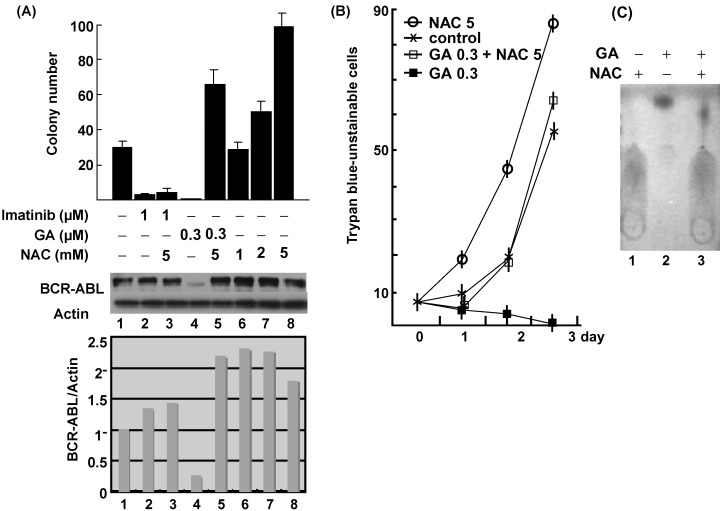
(a) Rat1 cells transformed by P210BCR‐ABL (Rat1/BCR‐ABL) were subjected to soft agar colony assays with the indicated concentrations of NAC, imatinib, and GA (upper panel). Total cell lysates from Rat1/BCR‐ABL cells treated by mock (lane 1), imatinib alone (lane 2), GA alone (lane 4), NAC alone (lanes 6–8) or combination of imatinib and NAC (lane 3) or GA and NAC (lane 5) for 4 h were subjected to anti‐ABL and antiactin western blotting (middle panel). Expression levels of BCR‐ABL relative to those of actin are quantified (lower panel). (b) Ba/F3 cells expressing P210BCR‐ABL were cultured in the presence of mock (cross), GA alone at 0.3 µM (dark square) or in combination with NAC at 5 mM (open square), or NAC alone (open circle) for three days. Mean numbers (x 104) of trypan blue‐unstainable cells derived from three independent experiments are shown. (c) GA (lane 1) or NAC (lane 2) alone, or a reaction mixture of both (10:1) (lane 3) was subjected to thin layer ascending chromatography. Note the difference in migrating velocity of GA between lane 2 and 3.
Figure 2.
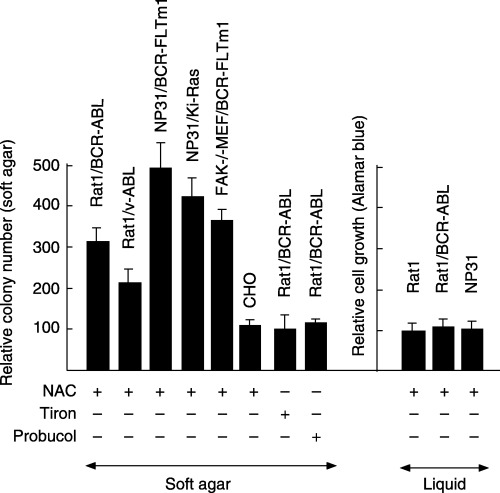
Mean values of relative soft agar colony numbers (left panel) and of relative cell growth in liquid cultures as monitored by Alamar blue assays (right panel) with (+) NAC at 5 mM, Tiron at 0.1 mM, or with probucol at 10 µM relative to those without (–) in Rat1/BCR‐ABL, Rat1/v‐ABL, NP31 endothelial cells transformed by an activated form of the Flt‐1 kinase BCR‐FLTm1 (NP31/BCR‐FLTm1) or temperature‐sensitive (ts) v‐Ki‐Ras (NP31/v‐Ki‐Ras), focal adhesion kinase (FAK)‐deficient mouse embryonic fibroblasts (MEF) transformed by BCR‐FLTm1 (FAK‐/‐ MEF/BCR‐FLTm1), hamster CHO‐9 cells (CHO), and parental Rat1 and NP31 cells.
To address to the question of specificity in oncogene and cell type, we compared colony numbers with NAC at 5 mM relative to those without among several types of cells (Fig. 2). The relative mean values were 310% in Rat1/(transformed by) BCR‐ABL, 204% in Rat1/v‐ABL, 417% in NP31 endothelial cells/v‐Ki‐Ras, 496% in NP31/BCR‐FLTm1 in which the ABL tyrosine kinase domain was replaced with that of Flt‐1 (VEGF receptor‐1), and 372% in focal adhesion kinase (FAK)‐deficient mouse embryonic fibroblasts (MEF) FAK‐/‐MEF/BCR‐FLTm1. One of the common molecules essential for transformation in those cells expressing activated tyrosine kinase oncogenes is the activated Ras and up‐regulation of growth by NAC was observed in NP31 cells transformed by activated Ras alone (v‐Ki‐Ras).
To gain mechanistic insight, we evaluated the effect of NAC alone on BCR‐ABL in Rat1/BCR‐ABL cells cultured not in usual plates but in dishes precoated with soft agar (Fig. 3a). NAC had almost no effect on the amount of BCR‐ABL proteins as well as on the phosphotyrosine (PY)‐containing protein profile of cells (Fig. 3a, middle panel). The amount of Grb2 proteins bound to BCR‐ABL by phosphorylated tyrosine 177 in BCR‐ABL was not altered (Fig. 3a, bottom panel). Total protein amounts of Grb2, Shc, and MAPK remained unchanged after NAC stimulation in both Rat1 and Rat1/BCR‐ABL cells (Fig. 3b). Interestingly, NAC at 5 mM stimulated Akt in both Rat1 and Rat1/BCR‐ABL cells. But NAC‐stimulated MAPK activation was observed in Rat1/BCR‐ABL cells but not in the parental Rat1 cells (Fig. 3b). One of the essential molecules in the initiation of DNA replication is CDC6 whose expression was reported to be almost completely shut off at anchorage‐free states in untransformed cells. (12) However, as shown in Fig. 3c, plating Rat1/BCR‐ABL cells onto soft agar‐coated dishes failed to result in significantly decreased expression of CDC6. Interestingly, expression levels of Hsp90, the molecular target of GA, was found to be decreased by 70% when Rat1/BCR‐ABL cells were plated onto soft agar‐coated plates. This was not affected by NAC.
Figure 3.
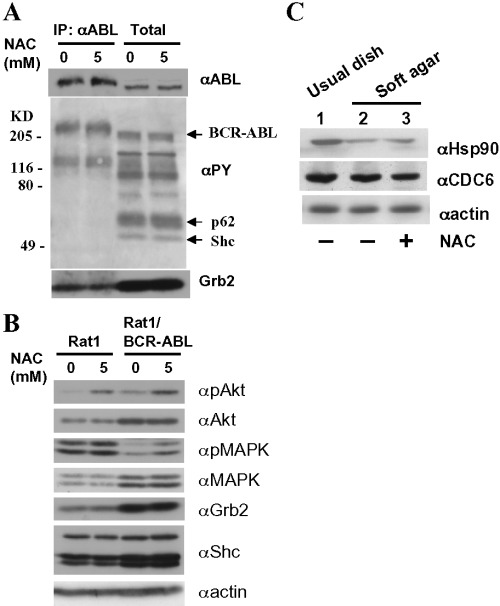
(a) Anti‐ABL (αABL) immunoprecipitates (IP) and total cell lysates (Total) from Rat1/BCR‐ABL cells cultured on soft agar‐coated dishes with or without 5 mM NAC for 10 min were subjected to anti‐ABL (upper panel), antiphosphotyrosine (PY)(middle panel), and anti‐Grb2 (lower panel) Western blotting. (b) Total cell lysates from Rat1 (left panel) and Rat1/BCR‐ABL cells cultured on soft agar‐coated dishes with or without 5 mM NAC for 10 min were subjected to antiphospho‐Akt (pAkt), anti‐Akt, antiphospho‐MAPK (pMAPK), anti‐MAPK, anti‐Grb2, anti‐Shc, and antiactin Western blotting. (c) Total cell lysates from Rat1/BCR‐ABL cells cultured in usual dishes (lane 1) or in soft agar‐coated dishes 12 h after plating in the absence (lane 2) or presence (lane 3) of NAC at 5 mM were subjected to anti‐Hsp90 (upper panel), anti‐CDC6 (middle), and antiactin (lower) Western blotting.
To test if growth‐promoting activity of NAC is mediated by Ras, we examined the effect of manumycin, (13) an inhibitor for Ras, on the NAC‐induced enhancement of soft agar colony formation by Rat1/BCR‐ABL cells (Fig. 4). Colony formation by Rat1/BCR‐ABL cells is dependent on Ras that is activated by BCR‐ABL. The suitable pharmacological dose range of manumycin in usual tissue culture is 1–10 µM. (13) Manumycin suppressed colony formation by Rat1/BCR‐ABL cells in the absence of 5 mM NAC by roughly 32%, while it did not in the presence of NAC (Fig. 4). At 10 µM, manumycin totally suppressed colony formation, which was inhibited by NAC. This suggests that the pharmacological site of action of NAC might be a certain molecule(s) downstream of Ras.
Figure 4.
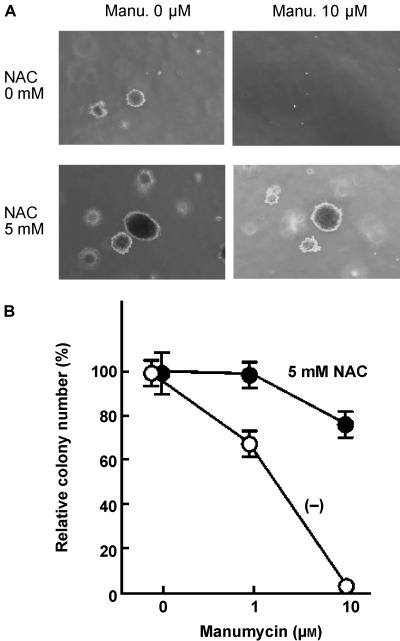
(a) Soft agar colony assays were performed with Rat1/BCR‐ABL cells with NAC alone at 5 mM, manumycin alone at 10 µM, or in combination of both. Pictures of representative microscopic colonies were taken after 3 weeks. (b) Soft agar colony numbers of Rat1/BCR‐ABL cells with manumycin at the indicated concentrations relative to those without were shown in the presence or absence of 5 mM NAC.
Discussion
NAC was reported to induce apoptosis in human tumor cells. (14) However, the experiments were performed with attached cells in usual dish cultures. They started to be sensitive to NAC at 20–50 mM, which is one magnitude higher than our experimental conditions. NAC induced apoptosis in all of our transformed cells shown in 1, 2 with NAC at concentrations higher than 30 mM (data not shown). This suggests that biological effects of NAC depend on dosage and should be carefully assessed in different cellular conditions.
FAK plays a pivotal role in integrin signaling (15) and its molecular status is reported to be affected by both BCR‐ABL (16) and BCR‐FLTm1. (10) Given that NAC had no significant effect on the growth of FAK‐/‐MEF/BCR‐FLTm1 cells in usual liquid cultures (values with NAC at 5 mM relative to those without are 100.5% by Alamar Blue assay), the NAC effect on growth is supposed to be FAK‐independent. This is partly supported by the fact that the NAC effect was observed in BCR‐ABL‐transformed Ba/F3 cells in suspension cultures (Fig. 1b). Protective activity of NAC at 6.1 mM against lipopolysaccharide (LPS)‐induced apoptosis in B cells from p53 haploinsufficient Tg.AC(v‐Ha‐ras) mice has been documented with no defined mechanisms. (17)
NAC has been reported to inhibit production of vascular endothelial growth factor (VEGF) from tumor cells and thereby suppress growth of tumors transplanted in mice. (5) Our preliminary experiments showed that oral NAC neither inhibited nor enhanced Rat1/BCR‐ABL tumor growth in nude mice (mean tumor size: 0.975 ± 0.151 g without NAC, n = 8 vs 0.979 ± 0.247 g with NAC, n = 8). It may be interesting to examine the NAC effect in BCR‐ABL leukemic animals.
The apparent growth enhancement by NAC in an anchorage‐independent condition could be discussed from a variety of standpoints. In addition to radical quenching, thiol‐based antioxidants can act through mechanisms such as metal chelating and reduction. (18) It is assumed that Hsp90 stabilizes and therefore an Hsp90 inhibitor GA stimulates degradation of BCR‐ABL proteins (Fig. 5). The expression levels of Hsp90 in Rat1/BCR‐ABL cells were reduced in an anchorage‐free condition, which could lead to decreased ability of Rat1/BCR‐ABL cells to grow in soft agar. Different from LPS‐stimulated B cells from p53 haploinsufficient Tg.AC(v‐Ha‐ras) mice, Rat1/BCR‐ABL cells in soft agar are alive. Although NAC had no effect on the expression levels of Hsp90, it appreciably increased the BCR‐ABL expression levels (Fig. 1a). We cannot rule out the possibility that NAC might be defending against BCR‐ABL inactivation by this destabilization.
Figure 5.
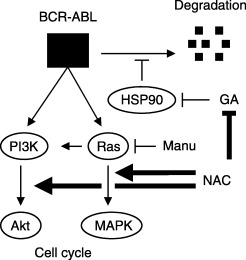
Hypothetical sites of NAC action. Hsp90 stabilizes BCR‐ABL and counteracts against its degradation. Direct chemical inactivation of an Hsp90 inhibitor geldanamycin (GA) by NAC could protect BCR‐ABL proteins from GA‐induced degradation. The Ras‐MAPK and PI3K‐Akt pathways are involved in cell cycle progression in BCR‐ABL‐transformed cells. Given that the pharmacological dose of a Ras inhibitor manumycin (Manu) failed to suppress NAC‐stimulated growth of BCR‐ABL‐transformed cells, the possible site of NAC action may be anywhere between Ras and MAPK.
Constitutive Ras activation can confer anchorage independence on cells. Considering the slight but appreciable level of MAPK activation by NAC and the resistance to manumycin in the presence of NAC, it may also be possible that NAC could activate some molecule downstream of Ras in growth signaling (Fig. 5).
Hsp90 inhibitors seem to be fascinating since they can degrade BCR‐ABL even with mutations that confer imatinib resistance. A structurally distinct Hsp90 inhibitor radicicol behaved in a similar fashion to GA in this study (data not shown). Considering that both radicicol and 17‐allylamino‐17‐demethoxy GA (17‐AAG) that is in phase I clinical studies (19) contain the quinone moiety, and that NAC is widely prescribed for chronic bronchitis because of its antimucolytic activity, we need to consider its potentially hazardous effects on at least some tumors.
Acknowledgments
We thank Drs K. Irie, and M. Yamada for their technical help and discussions. This work is supported by a Grant‐in‐Aid for Scientific Research to Fujiko Tsukahara (no. 16590207) and Yoshiro Maru (no. 12147210) from the Japanese government.
References
- 1. Melo JV, Hughes TP, Apperley JF. Chronic myeloid leukemia. American Society of Hematology Education Program Book 2003. ; 132–152. [DOI] [PubMed]
- 2. Smith DF, Whitesell L, Katsanis E. Molecular chaperones: biology and prospects for pharmacological intervention. Pharmacol Rev 1998; 50: 493–513. [PubMed] [Google Scholar]
- 3. Sattler M, Verma S, Shrikhande G, Byrne CH, Pride YB, Winkler T, Greenfield EA, Salgia R, Griffin JD, Christopher HB, Yuri BP. The BCR‐ABL tyrosine kinase induces production of reactive oxygen species in hematopoietic cells. The J Biol Chem 2000; 275: 24273–8. [DOI] [PubMed] [Google Scholar]
- 4. Irani K, Xia Y, Zweier JL, Sollott SJ, Der CJ, Fearon ER, Sundaresan M, Finkel T, Goldschmidt‐Clermont PJ. Mitogenic signaling mediated by oxidants in Ras‐transformed fibroblasts. Science 1997; 275: 1649–52. [DOI] [PubMed] [Google Scholar]
- 5. Albini A, Morini M, Agostini FD. Inhibition of angiogenesis‐driven Kaposi's sarcoma tumor growth in nude mice by oral N‐Acetylcysteine. Cancer Res 2001; 15: 8171–8. [PubMed] [Google Scholar]
- 6. Mayerhofer M, Valent P, Sperr WR, Griffin JD, Sillaber C. BCR‐ABL induces expression of vascular endothelial growth factor and its transcriptional activator, hypoxia inducible factor‐1a, through a pathway involving phosphoinositide 3‐kinase and the mammalian target of rapamycin. 2002; 100: 3767–75. [DOI] [PubMed] [Google Scholar]
- 7. Kin Y, Li G, Shibuya M, Maru Y. The Dbl‐homology domain of BCR is not a simple spacer in P210BCR‐ABL of the Philadelphia chromosome. J Biol Chem 2001; 276: 39462–8. [DOI] [PubMed] [Google Scholar]
- 8. Maru Y, Yamaguchi S, Shibuya M. FLT1, a receptor for vascular endothelial growth factor, has transforming and morphogenic potentials. Oncogene 1998; 16: 2585–95. [DOI] [PubMed] [Google Scholar]
- 9. Maru Y, Yamaguchi S, Takahashi T, Ueno H, Shibuya M. Virally Activated Ras Cooperates With Integrin to Induce Tubulogenesis in Sinusoidal Endothelial Cell Lines. J Cell Physiol 1998; 176: 223–34. [DOI] [PubMed] [Google Scholar]
- 10. Maru YK, Hanks SK, Shibuya M. The tubulogenic activity associated with an activated form of Flt‐1 kinase is dependent on focal adhesion kinase. Mol Cell Res, Biochim et Biophy Acta 2001; 1540: 147–53. [DOI] [PubMed] [Google Scholar]
- 11. Gaenshirt H, Morianz K. Reseearch on the quantitative evaluation of thin layer chromatography. I. UV‐spectroscopic determination of mixtures of the methyl and propyl esters of p‐hydroxybenzoic acid after separation by thin layer chromatography. Arch Pharmazie 1960; 293: 1065–75. [DOI] [PubMed] [Google Scholar]
- 12. Jinno S, Yageta M, Nagata A, Okayama H. Cdc6 requires anchorage for its expression. Oncogene 2002; 21: 1777–84. [DOI] [PubMed] [Google Scholar]
- 13. Palsson EM, Popoff M, Thelestam M, O'Neill LAJ. Divergent Roles for Ras and Rap in the Activation of p38 Mitogen‐activated Protein Kinase by Interleukin‐1. J Biol Chem 2000; 275: 7818–25. [DOI] [PubMed] [Google Scholar]
- 14. Pamela AH, Sandra O’, RJ , Justin M, Douglas EB. Transformed and tumor‐derived human cells exhibit preferential sensitivity to the thiol antioxidants, N‐Acetyl Cysteine and penicillamine. Cancer Res 2002; 62: 1443–9. [PubMed] [Google Scholar]
- 15. Schlaepfer DD, Jones. KC, Hunter T. Multiple Grb2‐Mediated Integrin‐Stimulated Signaling Pathways to ERK2/Mitogen‐Activated Protein Kinase. Summation of Both c‐Src‐ and Focal Adheison Kinase‐Initiated Tyrosine Phosphorylation Events. Mol Cell Biol 1998; 18: 2571–85. [DOI] [PMC free article] [PubMed] [Google Scholar]
- 16. Cheng K, Kurzrock R, Qiu X, Estrov Z, Ku S, Dulski KM, Wang JY, Talpaz M. Reduced focal adhesion kinase and paxillin phosphorylation in BCR‐ABL‐transfected cells. Cancer 2002; 95: 440–50. [DOI] [PubMed] [Google Scholar]
- 17. Martin KR, Kari FW, Barrett JC, French JE. N‐acetyl‐L‐cysteine simultaneously increases mitogenesis and suppresses apoptosis in mitogen‐stimulated B‐lymphocytes from p53 haploinsufficient Tg.AC (v‐Ha‐ras) mice. In Vitr Mol Toxicol 2000; 13: 237–48. [PubMed] [Google Scholar]
- 18. Deneke SM. Thiol‐based antioxidants. Curr Top Cell Regul 2000; 36: 151–80. [DOI] [PubMed] [Google Scholar]
- 19. Banerji U, Judson I, Workman P. The clinical applicationsof heat shock protein inhibitors in cancer – present and future. Curr Cancer Drug Targets 2003; 3: 385–90. [DOI] [PubMed] [Google Scholar]