

Abstract
(Cancer Sci 2010; 101: 594–600)
WT1 (Wilms’ tumor gene 1) protein is a potent pan‐tumor‐associated antigen (TAA) and WT1‐specific cytotoxic T lymphocytes (WT1 tetramer+ CD8+ T cells) are spontaneously induced in patients with acute myeloid leukemia (AML) or myelodysplastic syndrome (MDS). We conducted a single‐cell level comparative analysis of T‐cell receptor β‐chain variable region (TCR‐BV) gene families of a total of 1242 spontaneously induced WT1 tetramer+ CD8+ T cells in HLA‐A*2402+ patients with AML or MDS and those in healthy donors (HDs). This is the first report of direct usage analysis of TCR‐BV gene families of individual TAA‐specific CD8+ T cells at single‐cell level. Usage analysis using single‐cell RT‐PCR of TCR‐BV gene families of individual FACS‐sorted WT1 tetramer+ CD8+ T cells showed for the first time (i) that BVs 5, 6, 20, and 27 were commonly biased in both HDs and patients; (ii) that BV4 was commonly biased in HDs and MDS patients; (iii) that BV19 was commonly biased in the patients; and (iv) that BVs 7 and 28, BVs 9 and 15, and BVs 12 and 29 were specifically biased in HDs, AML, and MDS patients, respectively. However, statistical analysis of similarity among HD, AML, and MDS of individual usage frequencies of 24 kinds of TCR‐BV gene families indicated that the usage frequencies of TCR‐BV gene families in AML and MDS patients reflect those in HDs. These findings represent a novel insight for a better understanding of WT1‐specific immune response.
Wilms’ tumor gene WT1, which was originally isolated as a gene responsible for a pediatric neoplasm, Wilms’ tumor, encodes a zinc finger transcription factor that is essentially involved in the regulation of cell proliferation and differentiation.( 1 , 2 , 3 , 4 ) Although the WT1 gene was first categorized as a tumor‐suppressor gene, we proposed, based on accumulated experimental evidence, that the wild‐type WT1 gene played an oncogenic rather than a tumor‐suppressor function in leukemogenesis and tumorigenesis. In fact, overexpression of the wild‐type WT1 gene was observed in acute myeloid leukemia (AML), acute lymphoblastic leukemia, chronic myelogenous leukemia, myelodysplastic syndrome (MDS), and various kinds of solid tumors.( 5 , 6 , 7 )
Mice immunized with WT1 peptide or WT1 cDNA rejected challenges by WT1‐expressing tumor cells and survived with no signs of auto‐aggression against normal organs that physiologically expressed WT1.( 8 , 9 ) In humans, WT1‐specific cytotoxic T lymphocytes (CTLs) that could specifically lyse WT1‐expressing tumor cells with an HLA class I restriction were generated in vitro ( 10 , 11 , 12 ) and detected in patients with hematopoietic malignancies. Furthermore, WT1 antibodies were detected at higher frequencies and titers in patients with hematopoietic malignancies than in healthy donors.( 13 , 14 ) These findings indicated that the WT1 protein was highly immunogenic and could be a promising target antigen for cancer immunotherapy, that is a tumor‐associated antigen (TAA). In fact, we and others performed clinical studies of WT1 peptide vaccination for cancer patients and reported induction of WT1 peptide‐specific immunological responses such as an increase in frequencies of WT1 tetramer+ CD8+ T cells in peripheral blood (PB) and resultant clinical responses, including a decrease in leukemic blast cells and reduction in solid tumor size.( 15 , 16 ) These results prompted us to analyze WT1‐specific CTL responses in detail in the hope that this would be very useful for further elucidation of TAA‐specific immune responses in cancer patients.
In order to analyze TAA‐specific CTL responses, it is important to examine both their quantitative aspects, such as frequencies of TAA tetramer+ CD8+ T cells, and their qualitative aspects, such as clonality. One of the qualitative analyses involves defining the clonality of TAA tetramer+ CD8+ T cells. So far, several studies about T‐cell receptor (TCR) usage of TAA‐specific T cells have used TCR β‐chain variable region (TCR‐BV) gene family‐specific monoclonal antibodies (mAbs) or PCR with primers directed for the BV gene families.( 17 , 18 , 19 , 20 , 21 , 22 , 23 , 24 , 25 , 26 , 27 ) As for TCR usage in HLA‐A2+ melanoma patients, some investigations reported that melanoma‐associated antigen (Melan‐A)‐specific CD8+ T cells in PB or tumor sites showed selected usage of TCR‐BV gene families, such as BV14,( 17 , 20 , 23 , 24 ) while others reported no such selected usage.( 25 , 26 , 27 ) Overall, knowledge concerning the TCR usage of TAA‐specific T cells remains limited, although the occurrence of very selected TCR usage of viral antigen‐specific T cells is well known.( 28 , 29 )
In the study reported here, we conducted a single‐cell level comparative analysis of the usage of TCR‐BV gene families of individual FACS‐sorted WT1 tetramer+ CD8+ T cells in HLA‐A*2402+ patients with AML or MDS and in healthy donors (HDs), and describe biased usage of the TCR‐BV gene families in the patients, which probably reflects biased usage in HDs.
Materials and Methods
PB samples from patients and healthy donors. After informed consent was obtained, PB samples were obtained from four AML patients (AML‐1, ‐2, ‐3, and ‐4), four MDS patients (MDS‐1, ‐2, ‐3, and ‐4), and five HDs. A summary of patients’ clinical data and healthy donors’ information is presented in Table 1. Peripheral blood mononuclear cells (PBMCs) were isolated by density centrifugation using Ficoll‐Hypaque (Pharmacia, Uppsala, Sweden) and then frozen in liquid nitrogen until use.
Table 1.
Patients’ and healthy donors’ characteristics
| ID | Gender | Age | Disease | Prior therapy | Disease status | Residual disease detected by RT‐PCR | |
|---|---|---|---|---|---|---|---|
| Patients | AML‐1 | F | 55 | AML without maturation | Chemotherapy, WT1 vaccination | 2nd CR | (High levels of WT1) |
| AML‐2 | F | 66 | AML with maturation | Chemotherapy | 1st CR | (High levels of WT1) | |
| AML‐3 | M | 64 | AML with t(8; 21)(q22; q22) | Chemotherapy | 2nd CR | (Positivity of AML1/ETO) | |
| AML‐4 | F | 45 | AML with t(15; 17)(q22; q12) | Chemotherapy | 2nd CR | (Positivity of PML/RARα) | |
| MDS‐1 | M | 62 | Secondary MDS, chronic myelomonocytic leukemia | Chemotherapy for prior AML | – | (High levels of WT1) | |
| MDS‐2 | M | 66 | MDS, refractory anemia with excess blasts‐2 | Best supportive care | – | (High levels of WT1) | |
| MDS‐3 | M | 69 | AML transformed from MDS | Chemotherapy | 1st CR | (High levels of WT1) | |
| MDS‐4 | M | 58 | MDS, refractory anemia with excess blasts‐2 | Best supportive care | – | (High levels of WT1) | |
| Healthy donors | HD‐1 | F | 23 | ||||
| HD‐2 | M | 24 | |||||
| HD‐3 | M | 30 | |||||
| HD‐4 | F | 25 | |||||
| HD‐5 | F | 26 |
AML, acute myeloid leukemia; CR, complete remission; ETO, eight twenty one; HD, healthy donor; MDS, myelodysplastic syndrome; PML, promyelocytic leukemia; RARα, retinoic acid receptor‐α; WT1, Wilms’ tumor gene 1.
Flow cytometric analysis and single‐cell sorting of WT1 tetramer+ CD8+ T cells. PBMCs were stained with PE‐labeled HLA‐A*2402‐WT1235 tetramer (MBL, Tokyo, Japan) at 37°C for 30 min and then with a panel of fluorescence‐labeled monoclonal antibodies (mAbs) for 25 min on ice in the dark, and were finally FACS analyzed after washing with FACS buffer (phosphate‐buffered saline containing 2% FBS). For this staining procedure, the following mAbs were used: anti‐CD4‐, CD14‐, CD34‐FITC, anti‐CD3‐PerCP (BD Bioscience, San Jose, CA, USA), anti‐CD56‐FITC (eBioscience, San Diego, CA, USA), anti‐CD16‐, CD19‐, CD33‐FITC, anti‐CD8‐APC‐Cy7, anti‐CD45RA‐APC, and anti‐CCR7‐PE‐Cy7 (BD Pharmingen, San Diego, CA). In this study, lineage antigens (CD4, CD14, CD16, CD19, CD33, CD34, and CD56)‐negative, CD3‐, CD8‐, and HLA‐A*2402‐WT1235 tetramer (WT1 tetramer)‐positive lymphocytes were defined as WT1 tetramer+ CD8+ T cells. WT1 tetramer+ CD8+ T cells were single‐cell sorted by FACSAria (BD Biosciences) and data analysis was performed with FACS Diva software (BD Biosciences).
cDNA synthesis from a single WT1 tetramer+ CD8+ T cell. WT1 tetramer+ CD8+ T cells were directly single cell‐sorted into PCR tubes with 15 μL of a cDNA reaction mix containing lysis buffer (1 × cDNA buffer with 0.5% Triton X‐100) with reverse transcriptase (SuperScript III; Invitrogen, Carlsbad, CA, USA), 0.5 mm dNTPs (Invitrogen), 20 U RNase inhibitor (Invitrogen), 100 μg/mL gelatin (Roche, Indianapolis, IN, USA), 100 μg/mL tRNA (Roche), and 200 nm TCR‐β chain constant region (BC)‐specific primer (5′‐CACCAGTGTGGCCTTTTG‐3′). The sorted samples were incubated in the cDNA reaction mix at 50°C for 90 min for cDNA synthesis, followed by further incubation at 95°C for 5 min to stop the reaction.
Semi‐nested multiple PCR reaction of a single WT1 tetramer+ CD8+ T cell for identification of BV gene family. For the first PCR, 10 μL of synthesized cDNA products was added to 40 μL of a reaction mix containing 1 × PCR buffer, 2 mm MgCl2, 0.25 mm dNTPs, 1.25 U DNA polymerase (Platinum Taq DNA Polymerase; Invitrogen), 5 nm of 24 kinds of BV gene family‐specific forward primers (IMGT human TCR gene database site: http://imgt.cines.fr), and 5 nm 3′BC reverse primer (Table 2). The forward primers were synthesized as previously reported.( 30 ) The PCR procedure for this step comprised a pre‐PCR heating step at 95°C for 2 min and 40 cycles at 94°C for 45 s (denaturation), at 57°C for 45 s (annealing), and at 72°C for 50 s (extension). For the screening of the BV gene family, the first PCR product was subjected to second‐round screening PCR. One μL of the first PCR products was added to eight separate tubes, each of which was filled with 24 μL of a reaction mix containing 1 × PCR buffer, 2 mm MgCl2, 0.2 mm dNTPs, 1.0 U Taq polymerase, 150 nm each of eight kinds of screening sets of BV gene family‐specific forward primers (S1–S8, Table 2), and 150 nm 5′BC reverse primer (Table 2). The PCR procedure for this step consisted of a pre‐PCR heating step at 95°C for 2 min and 35 cycles at 94°C for 45 s, at 57°C for 45 s, and at 72°C for 40 s. Five μL of each screening‐PCR product was run on 2% agarose gel to identify the positive reaction among the eight kinds of screening sets. Next, to identify the BV gene family, the second‐round specifying PCR was performed by using individual 150 nm BV gene family‐specific forward primers that were contained in the positive screening set. Finally, BV gene families were directly identified by their positive bands (approximately 300–350 bp) with electrophoresis of the samples on 2% agarose gel. For negative control, three tubes without sorted cells were prepared and subjected to the same RT‐PCR procedures as those described above.
Table 2.
Sequences of primers for PCR amplification
| 2nd Mix | TRBV gene names† | Forward primer sequence (5′–3′) | |
|---|---|---|---|
| PCR forward primers (TCR‐BV gene family ‐specific primers) | S1 | TRBV9 | ACAGCAAGTGAC<TAG>CTGAGATGCTC |
| TRBV5 | |||
| TRBV25 | GATCACTCTGGAATGTTCTCAAACC | ||
| TRBV10 | CCAAGACACAAGGTCACAGAGACA | ||
| S2 | TRBV20 | GAGTGCCGTTCCCTGGACTTTCAG | |
| TRBV28 | GTAACCCAGAGCTCGAGATATCTA | ||
| TRBV2 | GGTCACACAGATGGGACAGGAAGT | ||
| S3 | TRBV29 | TCCAGTGTCAAGTCGATAGCCAAGTC | |
| TRBV7 | ATGTAACT<CT>TCAGGTGTGATCCAA | ||
| TRBV27 | GTGACCCAGAACCCAAGATACCTC | ||
| S4 | TRBV7 | GTGTGATCCAATTTCAGGTCATAC | |
| TRBV12 | GGTGACAGAGATGGGACAAGAAGT | ||
| TRBV11 | CAGTCTCCCAGATATAAGATTATAGAG | ||
| S5 | TRBV19 | CACTCAGTCCCCAAAGTACCTGTT | |
| TRBV30 | GTCAGATCTCAGACTATTCATCAATGG | ||
| TRBV4 | TACGCAGACACCAA<GA>ACACCTGGTCA | ||
| TRBV3 | CCCAGACTCCAAAATACCTGGTCA | ||
| TRBV18 | TGCAGAACCCAAGACACCTGGTCA | ||
| S6 | TRBV21 | AAGGTCACCCAGAGACCTAGACTT | |
| TRBV14 | ATAGAAGCTGGAGTTACTCAGTTC | ||
| TRBV23 | ACAAAGATGGATTGTACCCCCGAA | ||
| S7 | TRBV6 | GTGTCACTCAGACCCCAAAATTCC | |
| TRBV24 | GTTACCCAGACCCCAAGGAATAGG | ||
| S8 | TRBV13 | CTGATCAAAGAAAAGAGGGAAACAGCC | |
| TRBV15 | CAAGATACCAGGTTACCCAGTTTG | ||
| Reverse primer sequence (5′–3′) | 1st‐PCR (3′BC) | GCTTCTGATGGCTCAAACACAGC | |
| Screening and specifying‐PCR (5′BC) | GGAACACGTTTTTCAGGTCCT | ||
†TCR‐BV gene names are in accordance with IMGT unique gene nomenclatures. < >, mixture of nucleotides at this position.
To distinguish BV5 and BV9 gene families, PCR products identified by 5′‐ACAGCAAGTGAC<TAG>CTGAGATGCTC‐3′ forward primer were sequenced as described elsewhere,( 30 ) because this forward primer detects both the BV5 and BV9 gene families (Table 2). The two gene families were differentiated by identification of the BV gene family‐specific sequence.
In this experiment, we analyzed BV gene family usages of a total of 1242 WT1 tetramer+ CD8+ T cells: 405 cells from five HDs (75, 71, 96, 76, and 87 from HD‐1, ‐2, ‐3, ‐4, and ‐5, respectively), 403 cells from four AML patients (99, 105, 98, and 101 from AML‐1, ‐2, ‐3, and ‐4, respectively), and 434 cells from four MDS patients (103, 126, 109, and 96 from MDS‐1, ‐2, ‐3, and ‐4, respectively).
Statistical analysis. The nonparametric Mann–Whitney’s two‐tailed U‐test was used for the evaluation of the statistical significance of differences in WT1 tetramer+ CD8+ T‐cell frequencies or CTL differentiation subsets between HDs and either AML or MDS patients.
Statistical significance of the difference in usage frequencies (%) of the 24 kinds of BV gene families among HDs, AML, and MDS was assessed by one‐factor ANOVA or the Kruskal–Wallis test. Usage frequencies of BVs 3, 5, 7, 11, 14, 20, 23, 25, and 27 were compared among HDs, AML, and MDS by one‐factor ANOVA, and those of the other BV family usages were compared by using the Kruskal–Wallis test. Furthermore, the Tukey–Kramer post‐hoc test was used to assess the difference in BV20 gene family usage among HDs, AML, and MDS.
Results
Increase in WT1 tetramer+ CD8+ T cells with effector phenotypes in patients with AML and MDS. For an examination of CTL responses to the WT1 CTL epitope peptide, PBMCs were FACS‐analyzed by using the WT1 tetramer (Fig. 1). Figure 1a shows the representative profiles of WT1 tetramer+ CD8+ T cells in PBMCs of a healthy donor and two patients. Frequencies of WT1 tetramer+ CD8+ T cells were 0.03–0.11% for AML patients, 0.02–0.52% for MDS patients, and 0.01–0.05% for HDs, and thus significantly (P < 0.05) higher for the patients. However, the difference in frequency between the HDs and either AML or MDS patients was not significant because of the small number of patients (Fig. 1b).
Figure 1.
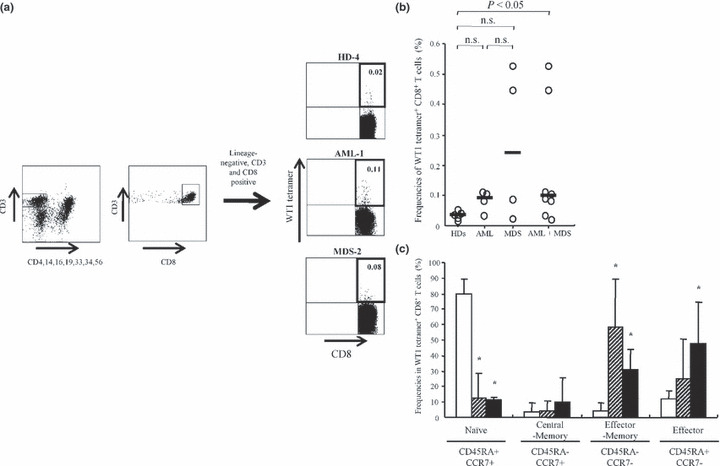
Increase in WT1 (Wilms’ tumor gene 1) tetramer+ CD8+ T cells with more maturated phenotypes in patients. (a) Representative profiles of flow cytometric analysis using WT1 tetramer. The numbers at the upper‐right corners in dot plots of lineage antigens CD4, 14, 16, 19, 33, 34 and 56‐negative and CD3‐, CD8‐positive gate represent the ratio of WT1 tetramer+ CD8+ T cells to total CD8+ T cells. (b) Ratios of WT1 tetramer+ CD8+ T cells to total CD8+ T cells in peripheral blood mononuclear cells (PBMC)s of healthy donors (HDs) (n = 5) and acute myeloid leukemia (AML) (n = 4), and myelodysplastic syndrome (MDS) (n = 4) patients. Bars represent medians; n.s., not significant. (c) Frequencies of four differentiation subsets of WT1 tetramer+ CD8+ T cells. White, hatched and black columns represent HDs, AML, and MDS patients, respectively. Statistical significance between HDs and AML, and HDs and MDS is indicated by asterisks (*P < 0.05).
CD45RA and CCR7 expression is used as the basis for the phenotypical subdivision of human CD8+ T cells into naïve (CD45RA+ CCR7+), central‐memory (CD45RA− CCR7+), effector‐memory (CD45RA−CCR7−), and terminal effector (CD45RA+ CCR7−) cells.( 31 ) These surface markers were used in our study to analyze the phenotypes of WT1 tetramer+ CD8+ T cells. Frequencies of naïve phenotype‐bearing WT1 tetramer+ CD8+ T cells were significantly higher in HDs (80.0 ± 8.4%) than in AML patients (12.5 ± 16.3%, P < 0.05) and MDS patients (11.2 ± 1.7%, P < 0.05) (Fig. 1c). In contrast, frequencies of effector‐memory phenotype‐bearing WT1 tetramer+ CD8+ T cells were significantly higher in AML patients (58.4 ± 30.7%, P < 0.05) and MDS patients (30.7 ± 13.2%, P < 0.05) than in HDs (4.5 ± 4.2%). In addition, frequencies of terminal effector phenotype‐bearing WT1 tetramer+ CD8+ T cells were significantly higher in MDS patients (47.9 ± 26.5%, P < 0.05) than in HDs (11.9 ± 5.1%).
These results thus demonstrate that WT1 peptide‐specific CD8+ T‐cell responses were higher in patients than in HDs, and that the WT1 tetramer+ CD8+ T cells featured more differentiated/activated phenotypes in patients than in HDs.
Biased usage of TCR‐BV gene families in WT1 tetramer+ CD8+ T cells. TCR‐BV gene families were investigated for single‐cell‐sorted WT1 tetramer+ CD8+ T cells from five HDs, four AML, and four MDS patients. Usage frequencies for a given BV gene family were defined as the ratios of the number of WT1 tetramer+ CD8+ T cells with the usage of the BV gene family to the total number of WT1 tetramer+ CD8+ T cells examined. When the usage frequencies of a given BV gene family were more than the mean values + 1SD for the usage of 24 different kinds of BV gene families, the usage was defined as biased. BV gene family usage is graphically shown in Figure 2.
Figure 2.
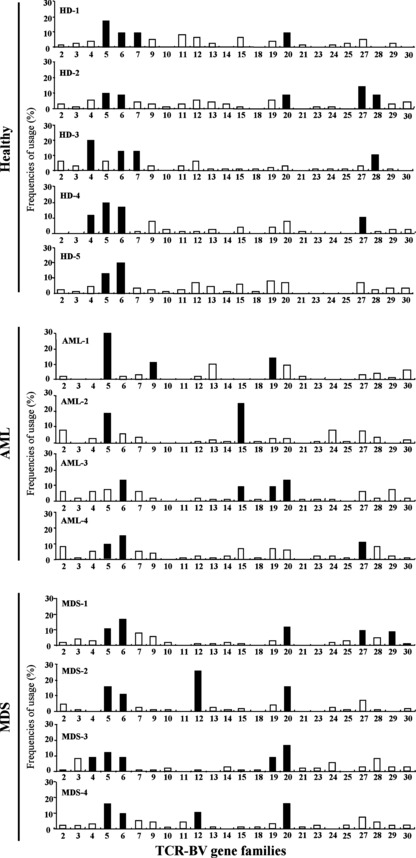
Usage frequencies of T‐cell receptor β‐chain variable region (TCR‐BV) gene families in WT1 (Wilms’ tumor gene 1) tetramer+ CD8+ T cells. Usage frequencies (%) of each member of the BV gene family in WT1 tetramer+ CD8+ T cells of five healthy donors (HDs) and four acute myeloid leukemia (AML) and four myelodysplastic syndrome (MDS) patients. Black and white columns represent the TCR‐BV gene families with usage frequencies above and below mean values + 1SD, respectively.
The following biased usages of TCR‐BV gene families were observed: BV4, 2/5 in HDs and 1/4 in MDS; BV5, 4/5 in HDs, 3/4 in AML, and 4/4 in MDS; BV6, 5/5 in HDs, 2/4 in AML, and 4/4 in MDS; BV7, 2/5 in HDs; BV9, 1/4 in AML; BV12, 2/4 in MDS; BV15, 2/4 in AML; BV19, 2/4 in AML and 1/4 in MDS; BV20, 2/5 in HDs, 1/4 in AML and 4/4 in MDS; BV27, 2/5 in HDs, 1/4 in AML, and 1/4 in MDS; BV28, 2/5 in HDs; and BV29, 1/5 in MDS. The ratios of the number of HDs and patients with biased usage of TCR‐BV gene families in the WT1 tetramer+ CD8+ T cells to the number of HDs and patients examined are graphically represented in Figure 3. These results showed that (i) BVs 5, 6, 20, and 27 were commonly biased in HDs and patients (AML and MDS); (ii) BV4 was commonly biased in both HDs and MDS; (iii) BV19 was commonly biased in the patients regardless of disease types (AML or MDS); and (iv) BVs 7 and 28, BVs 9 and 15, and BVs 12 and 29 were biased in HDs, AML, and MDS, respectively.
Figure 3.
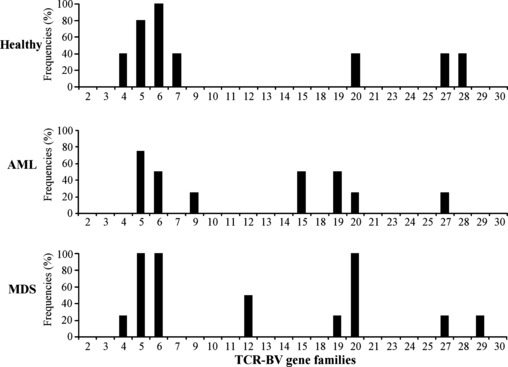
Usage frequencies of T‐cell receptor β‐chain variable region (TCR‐BV) gene families with the biased usage. Ratios of healthy donors (HDs) and patients with biased usage of the indicated TCR‐BV gene families to the total number of HDs and patients examined, respectively.
Usage frequencies of TCR‐BV gene families in AML and MDS reflect those of TCR‐BV gene families in HDs. As shown in Figure 4, the statistical significance of usage frequencies of 24 BV gene families was analyzed. In all the BV gene families except BV20, the usage frequencies were not statistically significantly different among HDs and AML and MDS patients, although there were more WT1 tetramer+ CD8+ T cells in AML and MDS than in HDs, and they were more maturated in AML and MDS than in HDs. Thus, usage frequency patterns of BV gene families were similar for HDs, AML, and MDS. BV20 usage alone was significantly (P < 0.05) more frequent in MDS than in HDs and AML. These results strongly indicate that the usage frequencies of TCR‐BV gene families in AML and MDS reflect those in HDs.
Figure 4.
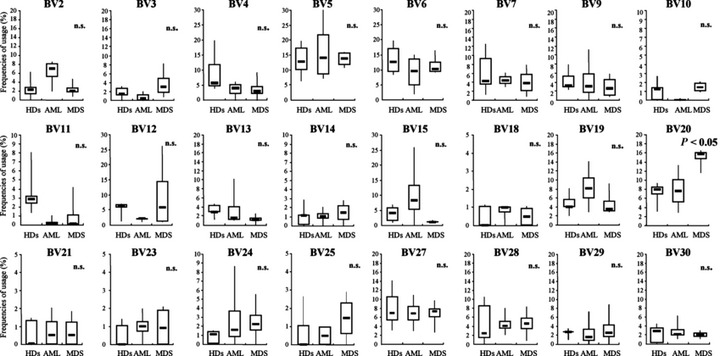
Statistical comparison between healthy donors (HDs) and patients of usage frequencies of individual T‐cell receptor β‐chain variable region (TCR‐BV) gene families in WT1 (Wilms’ tumor gene 1) tetramer+ CD8+T cells. Statistical significance was assessed by one‐factor ANOVA or Kruskal–Wallis test. n.s., not significant.
Discussion
Many studies have been published about TCR‐BV gene family usage of human TAA‐reactive T cells.( 17 , 18 , 19 , 20 , 21 , 22 , 23 , 24 , 25 , 26 , 27 ) In these studies, bulky lymphocyte populations were analyzed with conventional FACS‐based methods using a panel of mAbs directed against one of the TCR‐BV gene family products or with PCR‐based methods using a panel of TCR‐BV gene family‐specific primers. The former methods cannot cover all of the BV gene segments distributed in each BV gene family, while the latter do not guarantee that all the TCR‐BV gene families are amplified with equal efficiency because of variations in PCR amplification of cDNA from bulky lymphocyte populations.( 32 ) For example, TCR‐BV gene families of T cells that exist at very low frequencies are easily missed by these PCR methods.( 27 ) However, since our study was performed at the single‐cell level using WT1 tetramer+ CD8+ T cells instead of bulky lymphocyte populations, the shortcomings of the conventional methods described above could be overcome. Furthermore, since amplification efficiency of TCR‐BV cDNA from a single WT1 tetramer+ CD8+ T cell was more than 80% (data not shown), it appears that our results directly reflect TCR‐BV gene family usage in WT1 tetramer+ CD8+ T cells in PB.
Frequencies of WT1 tetramer+ CD8+ T cells were higher for patients with AML or MDS than for HDs, and the phenotypes of the T cells were more activated and maturated in patients than in HDs. These results strongly suggest that WT1‐specific CTL responses were robustly induced and activated in the patients, probably due to continuous stimulation of the patients’ immune system by the WT1 antigen of WT1‐expressing leukemia cells. Surprisingly, regardless of such a striking difference in WT1‐specific immune responses between patients and HDs, usage patterns of TCR‐BV gene families in patients were similar to those in HDs, and patients and HDs shared the biased usage of TCR‐BVs 4, 5, 6, 20, and 27. On the other hand, TCR‐BVs 9, 15, and 19, and TCR‐BVs 12, 19, and 29 were specifically biased in AML and MDS, respectively. Interestingly, five TCR‐BVs (4, 5, 6, 20, and 27) out of seven (4, 5, 6, 7, 20, 27, and 28) with biased usage in the HDs also showed biased usage in the patients. Taken together, these results lead us to speculate that dominant WT1‐specific CTL populations that existed prior to the onset of AML and MDS expanded and differentiated to maintain their dominancy in the WT1‐expressing tumor‐bearing patients, while a few WT1‐specific CTL populations expanded and differentiated in an AML‐ or MDS‐specific fashion. Furthermore, our findings seem to suggest that dominant WT1‐specific CTL populations in HDs may play an important role in immune surveillance against tumors, and that the dominant populations may continue to expand as a result of stimulation of the tumor‐derived WT1 protein after the initial occurrence of WT1‐expressing tumors.
TCR usage of antigen‐specific T cells is thought to be influenced by the affinity of the TCR to the antigen peptide/HLA class I complex on immune cells such as dendritic cells, while a few studies have reported that TCR usage was often influenced by genetic factors such as HLA allele types.( 33 , 34 , 35 ) For example, CTLs in HLA‐A*2402+ patients with acute parvovirus B19 infection preferentially used BV5,( 36 ) which was one of the dominant TCR‐BV gene families in the WT1 tetramer+ CD8+ T cells used in our study. As for tumor‐associated antigens, SART‐1 peptide‐specific CTLs preferentially used BV7( 37 ) in HLA‐A*2402+ patients with oral squamous cell carcinoma and BV18( 38 ) in HDs. CTL sublines specific to cyclophilin B established from an HLA‐A*2402+ patient with lung adenocarcinoma preferentially used BVs 1, 15, and 16.( 39 ) Our results and those of other studies suggest that TCR‐BV gene family usage of CTLs mainly depends on the affinity of the interaction of the TCR with the antigen‐derived peptide/HLA class I complex, rather than on HLA class I allele types.
Although a pre‐existing higher number of WT1‐specific CTLs with effector phenotypes were activated, no damage to the organs that physiologically expressed WT1 was observed. A plausible explanation for this phenomenon might be low expression of HLA class I molecules or low production of HLA class I‐restricted WT1 peptide from WT1 protein, which resulted in low expression of HLA class I molecule/WT1 peptide complex in normal cells. These issues should be further addressed.
A question could be raised as to whether activation of pre‐existing WT1‐specific CTLs by WT1 cancer vaccine may not provide clinical benefits because tumors have already escaped immune surveillance by pre‐existing WT1‐specific CTLs. However, clonal analysis of T‐cell receptors of the WT1‐specific CTLs before and after WT1 vaccination showed that the pre‐existing WT1‐specific CTLs increased after the WT1 peptide vaccination (Y. Tanaka‐Harada et al., unpublished data, 2009). Therefore, these results indicated that at least a part of the clinical results of WT1 peptide vaccination could be ascribed to the activation of the pre‐existing WT1‐specific CTLs by WT1 peptide.
Disclosure Statement
The authors have no conflict of interest.
Acknowledgments
This study was supported in part by a Grant‐in‐Aid from the Ministry of Education, Science, Sports, Culture, and Technology and the Ministry of Health, Labor, and Welfare of Japan.
References
- 1. Drummond IA, Madden SL, Rohwer‐Nutter P, Bell GI, Sukhatme VP, Rauscher FJ 3rd. Repression of the insulin‐like growth factor II gene by the Wilms tumor suppressor WT1. Science 1992; 257: 674–8. [DOI] [PubMed] [Google Scholar]
- 2. Englert C, Hou X, Maheswaran S et al. WT1 suppresses synthesis of the epidermal growth factor receptor and induces apoptosis. EMBO J 1995; 14: 4662–75. [DOI] [PMC free article] [PubMed] [Google Scholar]
- 3. Goodyer P, Dehbi M, Torban E, Bruening W, Pelletier J. Repression of the retinoic acid receptor‐alpha gene by the Wilms’ tumor suppressor gene product, wt1. Oncogene 1995; 10: 1125–9. [PubMed] [Google Scholar]
- 4. Hewitt SM, Hamada S, McDonnell TJ, Rauscher FJ 3rd, Saunders GF. Regulation of the proto‐oncogenes bcl‐2 and c‐myc by the Wilms’ tumor suppressor gene WT1. Cancer Res 1995; 55: 5386–9. [PubMed] [Google Scholar]
- 5. Inoue K, Sugiyama H, Ogawa H et al. WT1 as a new prognostic factor and a new marker for the detection of minimal residual disease in acute leukemia. Blood 1994; 84: 3071–9. [PubMed] [Google Scholar]
- 6. Tamaki H, Ogawa H, Ohyashiki K et al. The Wilms’ tumor gene WT1 is a good marker for diagnosis of disease progression of myelodysplastic syndromes. Leukemia 1999; 13: 393–9. [DOI] [PubMed] [Google Scholar]
- 7. Oji Y, Ogawa H, Tamaki H et al. Expression of the Wilms’ tumor gene WT1 in solid tumors and its involvement in tumor cell growth. Jpn J Cancer Res 1999; 90: 194–204. [DOI] [PMC free article] [PubMed] [Google Scholar]
- 8. Oka Y, Udaka K, Tsuboi A et al. Cancer immunotherapy targeting Wilms’ tumor gene WT1 product. J Immunol 2000; 164: 1873–80. [DOI] [PubMed] [Google Scholar]
- 9. Tsuboi A, Oka Y, Ogawa H et al. Cytotoxic T‐lymphocyte responses elicited to Wilms’ tumor gene WT1 product by DNA vaccination. J Clin Immunol 2000; 20: 195–202. [DOI] [PubMed] [Google Scholar]
- 10. Ohminami H, Yasukawa M, Fujita S. HLA class I‐restricted lysis of leukemia cells by a CD8(+) cytotoxic T‐lymphocyte clone specific for WT1 peptide. Blood 2000; 95: 286–93. [PubMed] [Google Scholar]
- 11. Gao L, Bellantuono I, Elsasser A et al. Selective elimination of leukemic CD34(+) progenitor cells by cytotoxic T lymphocytes specific for WT1. Blood 2000; 95: 2198–203. [PubMed] [Google Scholar]
- 12. Tsuboi A, Oka Y, Udaka K et al. Enhanced induction of human WT1‐specific cytotoxic T lymphocytes with a 9‐mer WT1 peptide modified at HLA‐A*2402‐binding residues. Cancer Immunol Immunother 2002; 51: 614–20. [DOI] [PMC free article] [PubMed] [Google Scholar]
- 13. Elisseeva OA, Oka Y, Tsuboi A et al. Humoral immune responses against Wilms tumor gene WT1 product in patients with hematopoietic malignancies. Blood 2002; 99: 3272–9. [DOI] [PubMed] [Google Scholar]
- 14. Wu F, Oka Y, Tsuboi A et al. Th1‐biased humoral immune responses against Wilms tumor gene WT1 product in the patients with hematopoietic malignancies. Leukemia 2005; 19: 268–74. [DOI] [PubMed] [Google Scholar]
- 15. Oka Y, Tsuboi A, Taguchi T et al. Induction of WT1 (Wilms’ tumor gene)‐specific cytotoxic T lymphocytes by WT1 peptide vaccine and the resultant cancer regression. Proc Natl Acad Sci U S A 2004; 101: 13885–90. [DOI] [PMC free article] [PubMed] [Google Scholar]
- 16. Kawakami M, Oka Y, Tsuboi A et al. Clinical and immunologic responses to very low‐dose vaccination with WT1 peptide (5 microg/body) in a patient with chronic myelomonocytic leukemia. Int J Hematol 2007; 85: 426–9. [DOI] [PubMed] [Google Scholar]
- 17. Valmori D, Dutoit V, Lienard D et al. Tetramer‐guided analysis of TCR beta‐chain usage reveals a large repertoire of melan‐A‐specific CD8 + T cells in melanoma patients. J Immunol 2000; 165: 533–8. [DOI] [PubMed] [Google Scholar]
- 18. Willhauck M, Mohler T, Scheibenbogen C et al. T‐cell receptor beta variable region diversity in melanoma metastases after interleukin 2‐based immunotherapy. Clin Cancer Res 1996; 2: 767–72. [PubMed] [Google Scholar]
- 19. Pilch H, Hohn H, Freitag K et al. Improved assessment of T‐cell receptor (TCR) VB repertoire in clinical specimens: combination of TCR‐CDR3 spectratyping with flow cytometry‐based TCR VB frequency analysis. Clin Diagn Lab Immunol 2002; 9: 257–66. [DOI] [PMC free article] [PubMed] [Google Scholar]
- 20. Sensi M, Salvi S, Castelli C et al. T cell receptor (TCR) structure of autologous melanoma‐reactive cytotoxic T lymphocyte (CTL) clones: tumor‐infiltrating lymphocytes overexpress in vivo the TCR beta chain sequence used by an HLA‐A2‐restricted and melanocyte‐lineage‐specific CTL clone. J Exp Med 1993; 178: 1231–46. [DOI] [PMC free article] [PubMed] [Google Scholar]
- 21. Dietrich PY, Walker PR, Quiquerez AL et al. Melanoma patients respond to a cytotoxic T lymphocyte‐defined self‐peptide with diverse and nonoverlapping T‐cell receptor repertoires. Cancer Res 2001; 61: 2047–54. [PubMed] [Google Scholar]
- 22. Valmori D, Dutoit V, Schnuriger V et al. Vaccination with a Melan‐A peptide selects an oligoclonal T cell population with increased functional avidity and tumor reactivity. J Immunol 2002; 168: 4231–40. [DOI] [PubMed] [Google Scholar]
- 23. Salvi S, Segalla F, Rao S et al. Overexpression of the T‐cell receptor beta‐chain variable region TCRBV14 in HLA‐A2‐matched primary human melanomas. Cancer Res 1995; 55: 3374–9. [PubMed] [Google Scholar]
- 24. Ostankovitch M, Le Gal FA, Connan F, Chassin D, Choppin J, Guillet JG. Generation of Melan‐A/MART‐1‐specific CD8 + cytotoxic T lymphocytes from human naive precursors: helper effect requirement for efficient primary cytotoxic T lymphocyte induction in vitro. Int J Cancer 1997; 72: 987–94. [DOI] [PubMed] [Google Scholar]
- 25. Romero P, Gervois N, Schneider J et al. Cytolytic T lymphocyte recognition of the immunodominant HLA‐A*0201‐restricted Melan‐A/MART‐1 antigenic peptide in melanoma. J Immunol 1997; 159: 2366–74. [PubMed] [Google Scholar]
- 26. Mandruzzato S, Rossi E, Bernardi F et al. Large and dissimilar repertoire of Melan‐A/MART‐1‐specific CTL in metastatic lesions and blood of a melanoma patient. J Immunol 2002; 169: 4017–24. [DOI] [PubMed] [Google Scholar]
- 27. Zhou J, Dudley ME, Rosenberg SA, Robbins PF. Selective growth, in vitro and in vivo, of individual T cell clones from tumor‐infiltrating lymphocytes obtained from patients with melanoma. J Immunol 2004; 173: 7622–9. [DOI] [PMC free article] [PubMed] [Google Scholar]
- 28. Price DA, Brenchley JM, Ruff LE et al. Avidity for antigen shapes clonal dominance in CD8 + T cell populations specific for persistent DNA viruses. J Exp Med 2005; 202: 1349–61. [DOI] [PMC free article] [PubMed] [Google Scholar]
- 29. Kalams SA, Johnson RP, Trocha AK et al. Longitudinal analysis of T cell receptor (TCR) gene usage by human immunodeficiency virus 1 envelope‐specific cytotoxic T lymphocyte clones reveals a limited TCR repertoire. J Exp Med 1994; 179: 1261–71. [DOI] [PMC free article] [PubMed] [Google Scholar]
- 30. Roers A, Montesinos‐Rongen M, Hansmann ML, Rajewsky K, Kuppers R. Amplification of TCRbeta gene rearrangements from micromanipulated single cells: T cells rosetting around Hodgkin and Reed‐Sternberg cells in Hodgkin’s disease are polyclonal. Eur J Immunol 1998; 28: 2424–31. [DOI] [PubMed] [Google Scholar]
- 31. Champagne P, Ogg GS, King AS et al. Skewed maturation of memory HIV‐specific CD8 T lymphocytes. Nature 2001; 410: 106–11. [DOI] [PubMed] [Google Scholar]
- 32. Polz MF, Cavanaugh CM. Bias in template‐to‐product ratios in multitemplate PCR. Appl Environ Microbiol 1998; 64: 3724–30. [DOI] [PMC free article] [PubMed] [Google Scholar]
- 33. Akolkar PN, Gulwani‐Akolkar B, Pergolizzi R, Bigler RD, Silver J. Influence of HLA genes on T cell receptor V segment frequencies and expression levels in peripheral blood lymphocytes. J Immunol 1993; 150: 2761–73. [PubMed] [Google Scholar]
- 34. Burrows SR, Silins SL, Cross SM et al. Human leukocyte antigen phenotype imposes complex constraints on the antigen‐specific cytotoxic T lymphocyte repertoire. Eur J Immunol 1997; 27: 178–82. [DOI] [PubMed] [Google Scholar]
- 35. Geursen A, Skinner MA, Townsend LA et al. Population study of T cell receptor V beta gene usage in peripheral blood lymphocytes: differences in ethnic groups. Clin Exp Immunol 1993; 94: 201–7. [DOI] [PMC free article] [PubMed] [Google Scholar]
- 36. Kasprowicz V, Isa A, Jeffery K et al. A highly restricted T‐cell receptor dominates the CD8 + T‐cell response to parvovirus B19 infection in HLA‐A*2402‐positive individuals. J Virol 2006; 80: 6697–701. [DOI] [PMC free article] [PubMed] [Google Scholar]
- 37. Kumamaru W, Nakamura S, Kadena T et al. T‐cell receptor Vbeta gene usage by T cells reactive with the tumor‐rejection antigen SART‐1 in oral squamous cell carcinoma. Int J Cancer 2004; 108: 686–95. [DOI] [PubMed] [Google Scholar]
- 38. Shimizu K, Yamaguchi Y, Ohta K, Miyahara E, Toge T. Analysis of T cell receptors reactive with squamous cell carcinoma antigen SART‐1 presented by the HLA‐A24 molecule. Oncol Rep 2002; 9: 599–605. [PubMed] [Google Scholar]
- 39. Gomi S, Nakao M, Niiya F et al. A cyclophilin B gene encodes antigenic epitopes recognized by HLA‐A24‐restricted and tumor‐specific CTLs. J Immunol 1999; 163: 4994–5004. [PubMed] [Google Scholar]