

Abstract
E‐cadherin plays a crucial role in epithelial cell–cell adhesion and in the maintenance of tissue architecture. Down‐regulation of E‐cadherin expression correlates with a strong invasive potential, resulting in poor prognosis in many human carcinomas, including breast cancer. Restoration of E‐cadherin can inhibit cell invasion and metastasis in many types of tumors. It has been demonstrated that promoter hypermethylation causes transcriptional down‐regulation of E‐cadherin. Here, using an RNAa technique specifically activating the expression of E‐cadherin through transcriptional regulation, we assessed the phenotype changes of a breast carcinoma cell line with transfection of small‐activating RNAs (saRNAs). We observed cell apoptosis, proliferation inhibition and reduction in human breast cancer migration in vitro. Animal experiment results showed that saRNA could inhibit tumor growth in vivo compared with scramble double‐small RNA (dsRNA).This study provides a new potential strategy for breast cancer therapy, and also demonstrates the potential for saRNA as a therapeutic option for enhancing tumor suppressor gene expression in breast cancer. (Cancer Sci 2010)
E‐Cadherin, encoded by the CDH1 gene, which is located on chromosome 16q22, is a transmembrane protein confined to epithelial cells and is mainly responsible for adherence junctions between them. Its extracellular region has a Ca2+‐dependent homophilic adhesion function and the cytoplasmic domain interacts with catenins.( 1 , 2 , 3 ) The critical importance of E‐cadherin to normal development and tissue function is demonstrated by the lethality of E‐cadherin gene knockout in mice in the very early stage of embryogenesis.( 4 ) There is a growing body of evidence suggesting that loss of E‐cadherin expression or mutations in the E‐cadherin gene may play a pivotal role in tumor progression as marked by increased mobility and invasiveness in a various cancers. It is also considered to be a tumor suppressor gene since restoration of E‐cadherin can inhibit cell invasion and metastasis in many types of tumors.( 5 , 6 , 7 , 8 ) Promoter hypermethylation is known to result in transcriptional down‐regulation of many genes, including the E‐cadherin gene. In general, the methylation profile of the E‐cadherin promoter fragment contains unmethylated or partially methylated CpG islands.( 9 ) Therefore, transcriptional activation of E‐cadherin expression by demethylation of promoter may represent an ideal therapy method for tumors.
RNA‐induced gene activation is a transcriptional gene activation phenomenon specifically induced by double‐small RNA (dsRNA) molecules that target gene promoter regions.( 10 ) This phenomenon was termed RNAa, and the dsRNA molecules were adopted by small‐activating RNAs (saRNAs). By targeting gene promoter regions, saRNAs induce the demethylation of histone, leading to transcriptional gene activation. It has been demonstrated that saRNA could inhibit cell proliferation and viability via up‐regulation of p21WAF1/CIP1 (p21) and E‐cadherin in human bladder cancer cells.( 10 , 11 , 12 ) Since activation of tumor suppressor genes with saRNAs offers a practical and cost‐effective approach to activate gene expression, RNAa may hold great promise as a therapeutic option for cancer.
Epithelial cancers account for 90% of cancer‐related mortality and among them, breast cancer is the leading cause of death, with annual mortality of 45 000 in 2008. One basic characteristic of cancer cells is that they adhere poorly to each other. Inactivation of E‐cadherin is important in the progression of sporadic breast cancer. E‐cadherin is completely and irreversibly lost in infiltrative lobular breast cancer, which suggests its function as a tumor suppressor in breast cancer genesis and development.( 6 , 13 , 14 )
In this study, by transfecting the saRNA targeting to the promoter region of E‐cadherin to human breast carcinoma cells MDA‐MB‐453 and MCF‐7, we observed activation of E‐cadherin expression in breast carcinoma cells. The enhanced E‐cadherin expression was correlated with a significant apoptosis and reduction in MDA‐MB‐453 migration in vitro. In vivo experiment showed that saRNA significantly inhibited tumor growth. This study also demonstrates the potential for saRNA as a therapeutic option for enhancing tumor suppressor gene expression in breast cancer.
Material and Methods
Cell culture and transfection. Human breast carcinoma cells (MDA‐MB‐453, MCF‐7) were cultured in Dulbecco’s modified Eagle’s medium (DMEM; Invitrogen, Carlsbad, CA, USA) supplemented with 10% fetal bovine serum and penicillin (100 Units/mL)/streptomycin (0.1 mg/mL) in 5% CO2 incubator at 37°C. Cells were seeded into six‐well plates with antibiotics‐free growth medium at a density of 0.8 × 10⁵ cells/well respectively and cultured overnight to (30–50%) confluence prior to transfection. Cells were transfected with 100 pmol/well of dsEcad‐215 and control dsRNA, respectively using the Lipofectamine2000 reagent (Invitrogen) according to the manufacturer’s protocols.
RNA isolation and semi‐quantitative RT‐PCR. Total RNA was extracted from MDA‐MB‐453 and MCF‐7 cells by using Trizol reagent according to the manufacturer’s instructions. Complementary DNA (cDNA) was generated from total RNA by reverse transcription using Moloney murine leukemia virus (M‐MLV). Polymerase chain reaction (PCR) amplification of the cDNA was performed in a reaction mixture with a final volume of 30 μL containing 2 μL of 4× dNTPs, one unit of Taq DNA polymerase, and 10 mmol/L of each paired primer specific to E‐cadherin. The primers used for qRT‐PCR of E‐cadherin were forward primer, 5′‐CGCCGAGAGCTACACGTTCA‐3′ and reverse primer, 5′‐TGTCGACCGGTGCAATCTTC‐3′.
Western blotting. The cells from experiment group and control groups were harvested and washed with PBS (pH 7.4) twice and resuspended in lysis buffer (1 mM dithiothreitol, 0.125 mM EDTA, 5% glycerol, 1 mM phenylmethylsulfonylfluoride, 1 μg/mL leupeptin, 1 μg/mL pepstatin, 1 μg/mL aprotinin, 1% Triton X‐100 in 12.5 mM Tris–HCl buffer, pH 7.0) on ice. The cell extracts were clarified by centrifugation and the protein concentrations were determined by using the Bio‐Rad protein assay kit (Bio‐Rad, Hercules, CA, USA). Each protein extract (25 μg) was electrophoresed on a 12% SDS‐polyacrylamide gel, transferred to PVDF membrane in a buffer containing 25 mM Tris–HCl (pH 8.3), 192 mM glycine, 20% (v/v) methanol, and was blocked in 5% (w/v) skimmed milk in Tris‐buffered saline Tween 20 (0.1% by volume, TBST) for 1 h at room temperature, and probed with specific primary antibodies overnight at 4°C. Then primary antibodies were removed and the blots were extensively washed with TBST three times. Blots were then incubated for 1 h at room temperature with the secondary antibodies (goat antirabbit antibody coupled to horseradish peroxidase, 1:3000 dilution) in 1% (w/v) skimmed milk dissolved in TBST. Following removal of the secondary antibody, blots were extensively washed as above for an hour and developed using the Enhanced Chemiluminescence Kit (NENTM Life Science Products, Boston, MA, USA). The primary antibodies used in this experiment for western blotting analyses were anti‐E‐cadherin (1:100; Santa Cruz Biotechnology, Santa Cruz, CA, USA), anti‐β‐actin (1:500; Sigma, St. Louis, MO, USA) antibody overnight at 4°C.
3‐(4, 5‐Dimethyl‐2‐thiazolyl)‐2, 5‐diphenyl‐2Htetrazolium bro‐mide (MTT) assay. The MTT assay was performed to assess the effect of E‐cadherin on cell proliferation. Transiently transfected breast carcinoma cells were plated in 96‐well plates at a density of 3.0 × 10³ cells/well for proliferation assay. Then for 5 days, every 24 h, a batch of cells were stained with 20 μL sterile MTT dye (5 mg/mL; Sigma) at 37°C for 4 h, then the culture medium was removed and 150 μL of DMSO was added and thoroughly mixed in for 10 min. Spectrometric absorbance at 570 nm was measured by using a microplate reader. All experiments were performed in triplicate.
Colony formation assay. Approximately 1.0 × 10³ MDA‐MB‐453 and MCF‐7 cells transiently transfected with dsEcad‐215, scramble dsRNA, and Mock were plated in 100‐mm culture dishes, respectively. After 18 days, cells were fixed with methanol and stained with 0.1% crystal violet. Visible colonies were manually counted.
Wound closure assay. Approximately 0.8 × 10⁵ MDA‐MB‐453 cells were plated in each well of a six‐well plate. After overnight incubation, the cells were transfected with dsRNAs (Mock, scramble, dsEcad‐ 215) for 72 h, respectively, and the cells reached full confluence. Monolayers of cells were scratched by scraping with a micropipette tip, rinsed several times with media to remove dislodged cells, and placed back in growth medium. The closure rate of each group was calculated 24 h after creating scratch.
Flow cytometric analysis for cell cycle and apoptosis. Approx‐imately 0.8 × 10⁵ cells were plated in each well of a six‐well plate (Fig. S1). After overnight incubation, the cells were tranfected with dsRNAs (Mock, scramble, dsEcad‐ 215) for 72 h. Cells were harvested with trypsinization, fixed with cold 70% ethanol, and stained by propidium iodide (PI) in PBS, and then analyzed for PI fluorescence intensity by flow cytometry to assess celluar DNA content. The relative proportions of cells in the G1, S, and G2/M phases of the cell cycle were determined from the flow cytometry data. Apoptosis was also measured with an Annexin V‐fluorescein isothiocyanate apoptosis detection kit (Zymed, San Fransisco, CA, USA). Briefly, the transfected cells were harvested, washed with ice‐cold PBS twice and resuspended in binding buffer. Annexin V‐fluorescein isothiocyanate (0.5 lg/mL) and propidium iodide (0.6 lg/mL) were then added to an aliquot (1.0× 10⁶ cells) of this cell suspension. After 15‐min incubation in the dark at room temperature, stained cells were immediately analyzed by FACSCalibur (BD, Franklin Lakes, NJ, USA). All of the samples were assayed in triplicate, and the cell apoptosis rate was calculated as follows: apoptosis rate = (apoptotic cell number/total cell number) × 100%.
TdT‐mediated dUTP nick end labeling (TUNEL) assay. The transfected and untransfected MDA‐MB‐453 and MCF‐7 cells were seeded, respectively, in a 100‐mm culture plate. The coverslip was placed on the culture plate beforehand to allow the growth of seeded cells. Then, the cells on coverslip were harvested on Days 1, 3, 5, and 7, respectively, and were used to detect the incorporation of labeled nucleotides to DNA strand breaks by TUNEL assay (Keygen Biotech, Nanjing, China) according to the manufacturer’s specifications.
In vivo antitumor activity of dsEcad‐215. MDA‐MB‐453 cells (1 × 10⁶) were injected subcutaneously into the right posterior limb of BALB/c nude mice (4–6 weeks old). When palpable tumors (about 140–160 mm3) arose within 16–21 days, mice were randomized to treatment and control groups. One group of five mice each was injected intratumorally in the right posterior limb with 30 μg of Lipofectamine2000‐encapsulated saRNA every 3 days for 3 weeks. Another two groups (five mice each) received weekly intratumoral injections of Lipofectamine2000‐encapsulated scramble dsRNA or Lipofectamine2000‐mixed PBS every 3 days for 3 weeks. Tumor growth was monitored by caliper‐measuring two perpendicular tumor diameters every 3 days, and the volume of the tumor was calculated with the formula: V = (width2 × length × 0.5). At the end of the experiment, tumor weight was assessed by sacrificing the mice, and by removing and weighing the tumor. All mice used in these experiments were cared for in accordance with the standards of the Institutional Animal Care and Use Committee under a protocol approved by Fourth Military Medical University.
Statistical analysis. Results are expressed as means ± SD. Statistical analyses were performed using SPSS statistical software (SPSS, Chicago, IL, USA). Student’s t‐test and one‐way anova followed by Dunnett’s multiple comparison tests were adopted. Values of P < 0.05 were considered as significant and indicated by asterisks in the figures.
Results
E‐cadherin was up‐regulated by saRNA in MDA‐MB‐453 and MCF‐7 cell lines. It has been demonstrated that a dsRNA targeting the E‐cadherin gene promoter at positions −215 and 302 relative to the transcription start site (dsEcad‐215,302) can activate the E‐cadherin expression.( 10 ) In our study, dsEcad‐215 and a scramble dsRNA were transiently transfected into MDA‐MB‐453 and MCF‐7 cells for 72 h, and mRNA and protein expressions of E‐cadherin were evaluated by semi‐quantitative RT‐PCR and western blotting, respectively. Up‐regulation of E‐cadherin expression was clearly observed (Fig. 1). Compared with Mock and scramble dsRNA transfections, dsEcad‐302 also caused a clear induction in E‐cadherin expression (Fig. S1).
Figure 1.
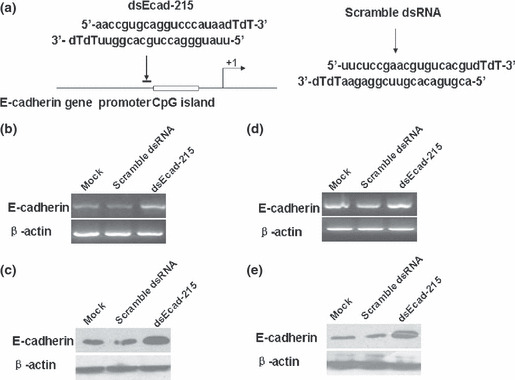
dsEcad‐215 induces E‐cadherin gene expression in MDA‐MB‐453 and MCF‐7 cell lines. (a) A schematic representation of dsEcad‐215 position and sequence on the promoter region and sequence of scramble dsRNA. Induction of E‐cadherin expression in MDA‐MB‐453 cells were detected by semi‐quantitative RT‐PCR (b) and western blotting (c), and the results were normalized to β‐actin. Induction of E‐cadherin expression in MCF‐7 was detected by semi‐quantitative RT‐PCR (d) and western blotting (e), and the results were normalized to β‐actin.
Breast carcinoma cell proliferation and colony formation were inhibited by E‐cadherin up‐regulation in vitro. Because E‐cadherin silencing contributes to malignant transformation whereas up‐regulation of E‐cadherin leads to an inhibition of tumor growth, we examined the E‐cadherin transcriptional activation on the proliferation of MDA‐MB‐453 and MCF‐7 cells in vitro. In this experiment, cellular proliferations were monitored by MTT assay daily for 5 days. The cell growth curve showed that compared with Mock‐ and scramble dsRNA‐transfected MDA‐MB‐453 and MCF‐7 cells, proliferation of dsEcad‐215‐transfected MDA‐MB‐453 (Fig. 2a) and MCF‐7 (Fig. 2c) cells was significantly inhibited in a time‐dependent manner, while scramble dsRNA‐transfected MDA‐MB‐453 and MCF‐7 cells showed no significant inhibition of proliferation. In the colony formation assay, as expected from the results of the MTT assay, the numbers of colonies were obviously decreased in dsEcad‐215‐transfected MDA‐MB‐453 and MCF‐7 cells compared with Mock‐ and scramble dsRNA‐transfected MDA‐MB‐453 (Fig. 2b) and MCF‐7 (Fig. 2d) cells. These results suggested that up‐regulation of E‐cadherin expression by saRNA could lead to significant inhibition of breast carcinoma cell proliferation in vitro.
Figure 2.
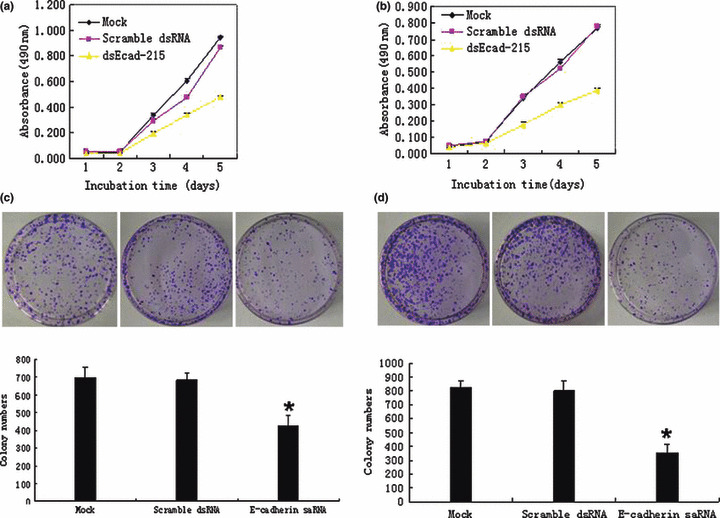
dsEcad‐215 specifically suppressed MDA‐MB‐453 and MCF‐7 cell proliferation and colony formation. The cell proliferation of Mock, scramble dsRNA, and dsEcad‐215 transiently transfected cells was measured by MTT assay. Up‐regulation of E‐cadherin clearly inhibited the cell proliferation of MDA‐MB‐453 (a) and MCF‐7 (b) cells in a time‐dependent manner. The cell proliferation of Mock showed no obvious changes compared with scramble dsRNA. The Mock‐, scramble dsRNA‐ and dsEcad‐215‐transfected MDA‐MB‐453 (c) and MCF‐7 (d) cells were seeded onto 100‐mm culture dishes at a concentration of 1 × 10³ cells and cultured for 17 days. The means ± SD of colony numbers was counted in three different dishes at 18 days after seeding, and the average number was plotted. The number of colonies in the MDA‐MB‐453 cell group (average colony number = 425) was significantly reduced (P < 0.05) compared with that seen in the other cell groups (average colony number = 696 and 682, respectively) (c). The number of colonies in the MCF‐7 cell group (average colony number = 353) was significantly reduced (P < 0.05) compared with that seen in the other cell groups (average colony number = 822 and 802, respectively) (d). Points and columns, mean; bars, SD; *P < 0.05.
Apoptosis was induced by up‐regulating E‐cadherin expression. To analyze the cell apoptosis rate induced by up‐regulation of E‐cadherin expression, dsEcad‐215 was transfected into MDA‐MB‐453 and MCF‐7 for 72 h, and cell apoptosis rates were analyzed by flow cytometry and TUNEL assay. As shown in Figure 3(a), the late apoptosis rate of dsEcad‐215‐transfected MDA‐MB‐453 cells significantly increased to 17.8% (Q2 region in the axes), compared with the apoptosis rates of Mock‐ and scramble dsRNA‐transfected cells (P < 0.05), while there were no differences in apoptosis rates among the latter two types of cells (P > 0.05); rates were 3.7% and 5.1%, respectively. The late apoptosis rate of dsEcad‐215‐transfected MCF‐7 significantly increased to 19.4% (P < 0.05), compared with the apoptosis rates of Mock‐ and control‐dsRNA‐transfected cells, which were 6.8% and 7.1% (P > 0.05), respectively (Fig. 3b). TUNEL assay based on the labeling of break DNA strand to detect the apoptosis cells showed that a dark brown DAB signal indicating positive staining was notably observed in dsEcad‐215‐transfected MDA‐MB‐453 and MCF‐7 cells, but not in Mock‐ and control‐dsRNA‐transfected cells at Day 4 after transfection (Fig. 3a,b). These results showed that the saRNA‐mediated up‐regualtion of E‐cadherin expression could lead to the acceleration of the apoptosis of human breast carcinoma cells.
Figure 3.
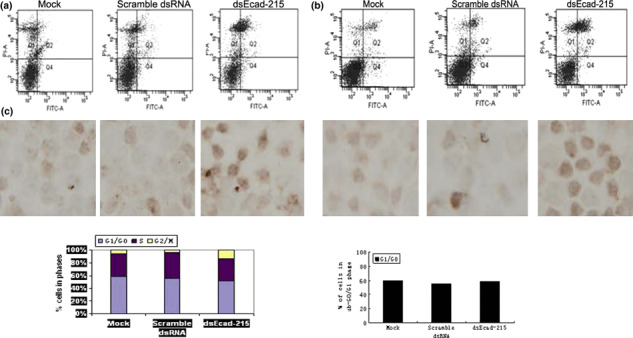
Effect of E‐cadherin up‐regulation on MDA‐MB‐453 and MCF‐7 cell apoptosis and cell cycle progression. (a) The apoptotic rate of MDA‐MB‐453 and MCF‐7 cells was detected by flow cytometry. The flow cytometry (FCM) results showed that the apoptotic rates of dsEcad‐215‐transfected MDA‐MB‐453 (a) and MCF‐7 (b) cells clearly increased, while there was no obvious differences in cell apoptosis among Mock‐ and scramble dsRNA‐transfected cells. Q1, necrosis cells; Q2, late apoptotic cells; Q3, live cells; Q4, early apoptotic cells. TUNEL assay was performed to detect apoptotic cells. Compared with control cells, dsEcad‐215‐transfected cells showed an increasing dark brown‐positive signal located in nucleus. (c) Effects of dsEcad‐215 on the cell cycle progression of MDA‐MB‐453 cells were analyzed by flow cytometry. The percentage of dsEcad‐215‐transfected cells (G2/M phase) increased to 15.6%, and to 5.7% and 3.85%, respectively, in Mock‐ and scramble dsRNA‐transfected cells.
Effect of E‐cadherin on the cell cycle. Cell cycle analysis of Mock‐, scramble dsRNA‐, and dsEcad‐215‐transfected MDA‐MB‐453 cells was conducted by flow cytometry. The percentage of the cells in the G2/M phase was significantly increased in dsEcad‐215‐transfected cells (15.6%) compared with those in the Mock‐ and scramble dsRNA‐transfected cells (5.7% and 3.85%, respectively) (Fig. 3c). The results indicated that cells transfected with dsEcad‐215 could be blocked in the G2/M phase, which promoted the apoptosis of cells.
Expression of survivin was inhibited by dsEcad‐215 transfection. It is known that caveolin‐1 and E‐cadherin cooperated in the suppressing of survivin expression. Re‐expression of E‐cadherin in HT29 (US) cells restored the ability of caveolin‐1 to down‐regulate survivin expression.( 15 ) To explore the possible mechanism that promoted apoptosis with the increasing of E‐cadherin expression, we investigated the changes to survivin expression after up‐regulation of E‐cadherin. The data showed that expression of survivin was clearly decreased both in mRNA and protein levels in dsEcad‐215‐transfected MDA‐MB‐453 and MCF‐7 cells (Fig. 4), which may be in charge of apoptosis induced by up‐regulation of E‐cadherin.
Figure 4.
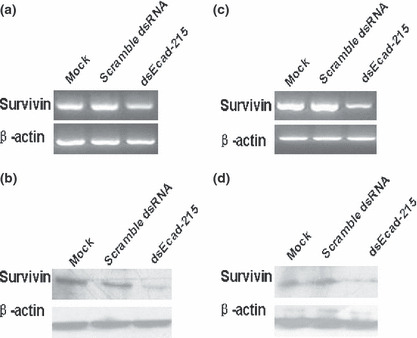
dsEcad‐215 induces down‐regulation of survivin expression. After transfection of Mock, scramble dsRNA, and dsEcad‐215 for 72 h, expression of survivin in MDA‐MB‐453 cells was detected by semi‐quantitative RT‐PCR (a) and western blotting (b), and the results were normalized to β‐actin. Expression of survivin in MCF‐7 was detected by semi‐quantitative RT‐PCR (c) and western blotting (d), and the results were normalized to β‐actin.
MDA‐MB‐453 and MCF‐7 cell migration was inhibited by up‐regulation of E‐cadherin. It is generally reported that loss of E‐cadherin expression or function leads to a more invasive phenotype, and restoration of E‐cadherin by conventional means can inhibit cell invasion in many types of tumors.( 16 , 17 ) To explore the effect of E‐cadherin up‐regulation induced by transcriptional activation on migration of breast carcinoma cells in vitro, wound closure assay was performed to examine whether migration of MDA‐MB‐453 and MCF‐7 cells transfected with dsEcad‐215 was inhibited. As shown in Figure 5, dsEcad‐215‐transfected MDA‐MB‐453 and MCF‐7 cells both exhibited slower closure ratios compared with those of Mock‐ and scramble dsRNA‐transfected cells. Based on the results of cell proliferation assay by MTT, we could conclude that the decreased migration of cells might be due to the change in cell proliferation and adhesion between cells.
Figure 5.
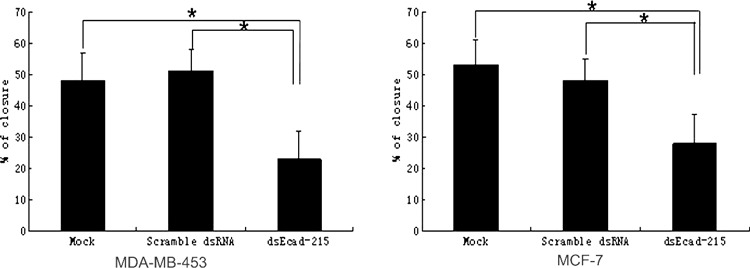
Effect of dsEcad‐215 on MDA‐MB‐453 and MCF‐7 cell migration. The cell migration of Mock‐, scramble dsRNA‐ and dsEcad‐215‐transfected cells was determined by wound closure assays. Confluent MDA‐MB‐453 and MCF‐7 cells were scratched by a micropipette tip at 72 h after transfection. Closure rates after scratching at 24 h were calculated. The closure rate of dsEcad‐215‐transfected MDA‐MB‐453 was significantly decreased (23%) compared with the closure rates of Mock‐ and scramble dsRNA‐transfected cells (P < 0.05), while there were no differences in closure rates between the later two kind of cells (P > 0.05), which were 49% and 51%, respectively. The closure rate of dsEcad‐215‐transfected MCF‐7 significantly decreased (28%) compared with the closure rates of Mock‐ and scramble dsRNA‐transfected cells (P < 0.05), whereas the closure rates of the latter two groups were 53% and 48%, respectively (P < 0.05). Columns, mean; bars, SD; *P < 0.05.
Up‐regulation of E‐cadherin expression suppresses MDA‐MB‐453 cell tumor growth in nude mice. The in vivo antitumor activity of dsEcad‐215 was also tested in nude mouse models. When palpable tumors arose in mice injected subcutaneously with MDA‐MB‐453 cells, the mice received 30 μg (100 μL) of Lipofectamine2000‐encapsulated dsEcad‐215 intratumorally every 3 days in the right posterior limb for 3 weeks or intratumoral injections of 30 μg (100 μL) scramble dsRNA or PBS–Lipofectamine2000 (100 μL). As shown in Figure 6(a), the tumors of mice treated with dsEcad‐215 developed more slowly than the groups treated with scramble dsRNA and PBS. As a result, the average tumor weight of dsEcad‐215‐treated cells (average tumor weight = 0.215 g, P < 0.05) was significantly less than that of other cells (average tumor weight = 0.538 and 0.503 g) (Fig. 6b,c). These experimental data showed that RNAa‐mediated up‐regulation of E‐cadherin expression exerted a potent growth inhibitory effect on MDA‐MB‐453 cells in vivo.
Figure 6.
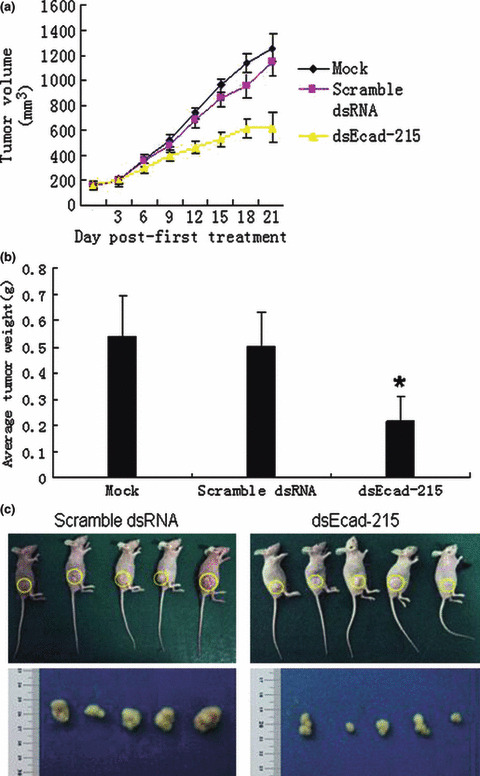
Up‐regulation of E‐cadherin suppresses tumor growth of MDA‐MB‐453 cells in nude mice. Palpable tumors (about 160 mm3) received intra‐tumoral injections of 30 μg of Lipofectamine2000‐encapsulated Mock, scramble dsRNA, or dsEcad‐215 in the right posterior limb every 3 days for 3 weeks. (a) Tumor size was measured over a 3‐week period and tumor volume was calculated by the formula (width2 × length × 0.5). (b,c) Tumor weight (g) was recorded at the end of the experiment. Points and columns, mean; bars, SD.
Discussion
Traditional treatment of breast cancer generally comprises a combination of the three classic strategies for malignant tumors: surgery accompanied by radio‐ and chemotherapy. In the past few years, many encouraging advancements have been made in understanding the molecular mechanisms underlying carcinogenesis and tumor progression. These improvements have led to the identification of promising new targets for cancer therapy. Many researchers have been drawn to down‐regulating the expression of tumor and tumor‐related genes (such as human epidermal growth factor receptor‐2 [HER2] and vascular endothelial growth factor [VEGF]) in breast cancer,( 18 , 19 ) while up‐regulating the expression of tumor suppressor genes that have loss of expression in breast cancer may provide an additional promising strategy.
E‐cadherin, a well‐characterized cell adhesion molecule, is essential for cell–cell adhesion, which in turn regulates various aspects of cell fate including developmental decisions, cellular differentiation, and possibly cell survival.( 20 , 21 , 22 ) E‐cadherin also has an essential function in normal physiologic processes such as development, cell polarity, and morphology,( 23 ) as well as in pathologic states such as epithelial–mesenchymal transition (EMT), a process whereby tumor cells lose their epithelial markers and migrate to distal organs. E‐cadherin is a tumor suppressor protein that is used as a prognostic marker for breast cancer, and frequent down‐regulation of E‐cadherin during the progression of cancer correlates with aggressive behavior of tumors and a poor prognosis.( 24 ) Based on these phenomena, increasing the endogenous or exogenous expression of E‐cadherin may represent an ideal therapy trend for tumor therapy research. In this study, we transcriptionally up‐regulated the expression of E‐cadherin using an saRNA targeting the promoter region of E‐cadherin, which has been demonstrated to activate the expression of targeted gene through histone demethylation. Reverse transcription–PCR and western blotting results showed that the expression of E‐cadherin in cells transfected with saRNA was obviously increased compared with scrambled dsRNA, suggesting that the expression of E‐cadherin could be increased in breast cancer cells by saRNA transfection.
We then detected the phenotype changes of cancer cells transfected with saRNA. The results showed that up‐regulating E‐cadherin by transcriptional activation inhibited the proliferation and colony formation of breast cancer cells. Also, endogenous E‐cadherin up‐regulation induced cell accumulation in the G2/M phase and final apoptosis. It is reported that E‐cadherin can suppress expression of survivin in the HT29 cell line. In our study, we also found that expression of survivin was clearly decreased both in mRNA and protein levels, which are possibly in charge of apoptosis induced by up‐regulation of E‐cadherin. As loss of cell–cell adhesion in the epithelial dedicates to mesenchymal transition which is associated with an invasive phenotype, we explored the influence of endogenous E‐cadherin up‐regulation on mobility in breast cancer. Our data showed that up‐regulation of E‐cadherin could decrease the mobility of breast cancer cells, and it was speculated that compact cohesion mediated by E‐cadherin inhibits the mobility of malignant cells (Fig. S2).
As a result of E‐cadherin up‐regulation, a significant growth inhibition of xenograft was observed in our experiment, which demonstrated another promising therapy strategy for breast cancer (Fig. S3). Taken together, this study demonstrates that up‐regulating expression of endogenous E‐cadherin in breast cancer can inhibit proliferation, promote apoptosis, decrease mobility, and thus inhibit tumor growth in vivo, which may significantly contribute to therapy of breast cancer. Further research should be focused on delivery strategies that can direct small double activation RNA specifically into tumor cells with low toxicity and high efficacy.
Acknowledgments
This study was supported by grants from the National Natural Science Foundation of China (no. 30772181). We thank all clinical laboratory staff at Tangdu Hospital, Fourth Military Medical University, for their sincere help and technical support.
Supporting information
Fig. S1. dsEcad‐302 induces E‐cadherin gene expression in MDA‐MB‐453 and MCF‐7 cell lines. Induction of E‐cadherin expression was detected by semi‐quantitative RT‐PCR and the results were normalized to β‐actin.
Fig. S2. Expressions of E‐cadherin in tumor tissue treatment with dsEcad‐215 were assessed by immunohistochemical staining. The expression of E‐cadherin proteins was clearly increased in dsEcad‐215‐treated tumor tissue compared with Mock‐ and scramble dsRNA‐treated tumor tissues.
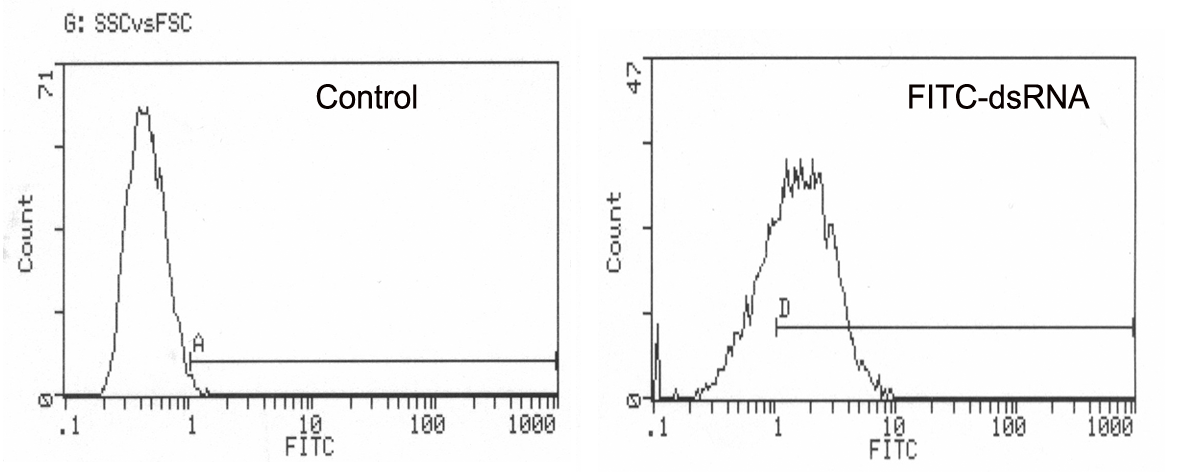
Fig. S3. Transfection efficiency of FITC‐labeled dsRNA in the MDA‐MB‐453 cell line. The transfection efficiency of dsRNA in MDA‐MB‐453 was detected by flow cytometry; the percentage of FITC‐labeled cells was 72.1% compared with 1% in the Mock‐transfected group.
Please note: Wiley‐Blackwell are not responsible for the content or functionality of any supporting materials supplied by the authors. Any queries (other than missing material) should be directed to the corresponding author for the article.
Supporting info item
Supporting info item
Supporting info item
References
- 1. Nelson WJ. Regulation of cell–cell adhesion by the cadherin‐catenin complex. Biochem Soc Trans 2008; 36: 149–55. [DOI] [PMC free article] [PubMed] [Google Scholar]
- 2. Cavallaro U, Christofori G. Cell adhesion and signaling by cadherins and Ig‐CAMs in cancer. Nat Rev Cancer 2004; 4:118–32. [DOI] [PubMed] [Google Scholar]
- 3. Gumbiner BM. Regulation of cadherin‐mediated adhesion in morphogenesis. Nat Rev Mol Cell Biol 2005; 6: 622–34. [DOI] [PubMed] [Google Scholar]
- 4. Larue L, Ohsugi M, Hirchenhain J et al. E‐cadherin null mutant embryos fail to form a trophectoderm epithelium. Proc Natl Acad Sci USA 1994; 91: 8263–7. [DOI] [PMC free article] [PubMed] [Google Scholar]
- 5. Birchmeier W, Behrens J. Cadherin expression in carcinomas: role in the formation of cell junctions and the prevention of invasiveness. Biochim Biophys Acta 1994; 1198: 11–26. [DOI] [PubMed] [Google Scholar]
- 6. Onder TT, Gupta PB, Mani SA et al. Loss of E‐cadherin promotes metastasis via multiple downstream transcriptional pathways. Cancer Res 2008; 68: 3645–54. [DOI] [PubMed] [Google Scholar]
- 7. Cleton‐Jansen AM, Moerland EW, Kuipers‐Dijkshoorn NJ et al. At least two different regions are involved in allelic imbalance on chromosome arm 16q in breast cancer. Genes Chromosomes Cancer 1994; 9: 101–7. [DOI] [PubMed] [Google Scholar]
- 8. Mao Q, Li YB, Zheng XY et al. Up‐regulation of E‐cadherin by small activating RNA inhibits cell invasion and migration in 5637 human bladder cancer cells. Biochem Biophys Res Commun 2008; 375: 466–70. [DOI] [PubMed] [Google Scholar]
- 9. Graff JR, Herman JG, Lapidus RG et al. E‐cadherin expression is silenced by DNA hypermethylation in human breast and prostate carcinomas. Cancer Res 1995; 55: 5195–9. [PubMed] [Google Scholar]
- 10. Li LC, Okino ST, Zhao H et al. Small dsRNAs induce transcrip‐tional activation in human cells. Proc Natl Acad Sci USA 2006; 103: 17337–42. [DOI] [PMC free article] [PubMed] [Google Scholar]
- 11. Chen Z, Place RF, Jia ZJ et al. Antitumor effect of dsRNA‐induced p21WAF1/CIP1 gene activation in human bladder cancer cells. Mol Cancer Ther 2008; 7: 698–703. [DOI] [PubMed] [Google Scholar]
- 12. Yang K, Zheng XY, Qin J et al. Up‐regulation of p21WAF1/Cip1 by saran induces G1‐phase arrest and apoptosis in T24 human bladder cancer cells. Cancer Lett 2008; 265: 206–14. [DOI] [PubMed] [Google Scholar]
- 13. Wong AS, Gumbiner BM. Adhesion‐independent mechanism for suppression of tumor cell invasion by E‐cadherin. J Cell Biol 2003; 161: 1191–203. [DOI] [PMC free article] [PubMed] [Google Scholar]
- 14. Somesh B, Suresh KA. Molecular mechanisms controlling E‐cadherin expression in breast cancer. Biochem Biophys Res Commun 2009; 384: 6–11. [DOI] [PMC free article] [PubMed] [Google Scholar]
- 15. Torres VA, Tapia JC, Rodriguez DA et al. E‐cadherin is required for caveolin‐1‐mediated down‐regulation of the inhibitor of apoptosis protein survivin via reduced beta‐catenin‐Tcf/Lef‐dependent transcription. Mol Cell Biol 2007; 27: 7703–17. [DOI] [PMC free article] [PubMed] [Google Scholar]
- 16. Deplazes J, Fuchs M, Rauser S et al. Rac1 and Rho contribute to the migratory and invasive phenotype associated with somatic E‐cadherin mutation. Hum Mol Genet 2009; 18: 3632–44. [DOI] [PubMed] [Google Scholar]
- 17. Perl AK, Wilgenbus P, Dahl U et al. A causal role for E‐cadherin in the transition from adenoma to carcinoma. Nature 1998; 392: 190–3. [DOI] [PubMed] [Google Scholar]
- 18. Ross JS. Breast cancer biomarkers and HER2 testing after 10 years of anti‐HER2 therapy. Drug News Perspect 2009; 22: 93–106. [DOI] [PubMed] [Google Scholar]
- 19. Schneider BP, Sledge GWJ. Drug insight: VEGF as a therapeutic target for breast cancer. Nat Clin Pract Oncol 2007; 4: 181–9. [DOI] [PubMed] [Google Scholar]
- 20. Peifer M. Beta‐catenin as oncogene: the smoking gun. Science 1997; 275: 1752–3. [DOI] [PubMed] [Google Scholar]
- 21. Yagi T, Takeichi M. Cadherin superfamily genes: functions, genomic organization, and neurologic diversity. Genes Dev 2000; 14: 1169–80. [PubMed] [Google Scholar]
- 22. Bonitsis N, Batistatou A, Karantima S et al. Cadherin superfamily genes: functions, genomic organization, and neurologic diversity. Exp Oncol 2006; 28: 187–93. 17080010 [Google Scholar]
- 23. Yang J, Weinberg RA. Epithelial‐mesenchymal transition: at the crossroads of development and tumor metastasis. Dev Cell 2008; 14: 818–29. [DOI] [PubMed] [Google Scholar]
- 24. Mohammadizadeh F, Ghasemibasir H, Rajabi P et al. Correlation of E‐cadherin expression and routine immunohistochemistry panel in breast invasive ductal carcinoma. Cancer Biomark 2009; 5: 1–8. [DOI] [PubMed] [Google Scholar]
Associated Data
This section collects any data citations, data availability statements, or supplementary materials included in this article.
Supplementary Materials
Fig. S1. dsEcad‐302 induces E‐cadherin gene expression in MDA‐MB‐453 and MCF‐7 cell lines. Induction of E‐cadherin expression was detected by semi‐quantitative RT‐PCR and the results were normalized to β‐actin.
Fig. S2. Expressions of E‐cadherin in tumor tissue treatment with dsEcad‐215 were assessed by immunohistochemical staining. The expression of E‐cadherin proteins was clearly increased in dsEcad‐215‐treated tumor tissue compared with Mock‐ and scramble dsRNA‐treated tumor tissues.
Fig. S3. Transfection efficiency of FITC‐labeled dsRNA in the MDA‐MB‐453 cell line. The transfection efficiency of dsRNA in MDA‐MB‐453 was detected by flow cytometry; the percentage of FITC‐labeled cells was 72.1% compared with 1% in the Mock‐transfected group.
Please note: Wiley‐Blackwell are not responsible for the content or functionality of any supporting materials supplied by the authors. Any queries (other than missing material) should be directed to the corresponding author for the article.
Supporting info item
Supporting info item
Supporting info item