

Abstract
In tumor‐bearing patients, tumor‐associated antigen (TAA)‐specific CTLs are spontaneously induced as a result of immune response to TAAs and play an important role in anti‐tumor immunity. Wilms’ tumor gene 1 (WT1) is overexpressed in various types of tumor and WT1 protein is a promising pan‐TAA because of its high immunogenicity. In this study, to clarify the immune response to the WT1 antigen, WT1‐specific CD8+ T cells that were spontaneously induced in patients with solid tumor were comparatively analyzed in both bone marrow (BM) and peripheral blood (PB). WT1‐specific CD8+ T cells more frequently existed in BM than in PB, whereas frequencies of naïve (CCR7+ CD45RA+), central memory (CCR7+ CD45RA−), effector‐memory (CCR7− CD45RA−), and effector (CCR7− CD45RA+) subsets were not significantly different between BM and PB. However, analysis of these subsets for the expression of CD57 and CD28, which were associated with differentiation, revealed that effector‐memory and effector subsets of the WT1‐specific CD8+ T cells in BM had less differentiated phenotypes and more proliferative potential than those in PB. Furthermore, CD107a/b functional assay for WT1 peptide‐specific cytotoxic potential and carboxyfluorescein diacetate succinimidyl ester dilution assay for WT1 peptide‐specific proliferation also showed that WT1‐specific CD8+ T cells in BM were less cytotoxic and more proliferative in response to WT1 peptide than those in PB. These results implied that BM played an important role as a secondary lymphoid organ in tumor‐bearing patients. Preferential residence of WT1‐specific CD8+ T cells in BM could be, at least in part, explained by higher expression of chemokine receptor CCR5, whose ligand was expressed on BM fibroblasts on the WT1‐specific CD8+ T cells in BM, compared to those in PB. These results should provide us with an insight into WT1‐specific immune response in tumor‐bearing patients and give us an idea of enhancement of clinical response in WT1 protein‐targeted immunotherapy.
(Cancer Sci 2010; 101: 848–854)
There is accumulating evidence that the immune system has the ability to recognize tumor‐associated antigens (TAAs) and to eradicate the TAA‐expressing malignant cells, also called ‘tumor immunosurveillance’.( 1 , 2 ) In tumor immunosurveillance, it is generally thought that CD8+ CTLs are the main effector cells because they can effectively expand and kill malignant cells. Therefore, the most common approaches to combat tumors have centered on the induction of TAA‐specific CTLs. Recent studies showed that CTLs with memory phenotypes also had potent anti‐tumor activity.( 3 ) Thus, not only the induction of effector CTLs but also maintenance of memory CTLs are required for ideal anti‐tumor immune response in tumor‐bearing patients. Regarding the maintenance of CTLs, infectious models using pathogens were well established. Interestingly, in chronic infection, in which antigens constitutively existed, it was reported that CTLs were continually activated by the antigens, finally resulting in exhaustion of the CTLs.( 4 ) However, in tumor‐bearing patients, TAAs constitutively exist for a long time, like the chronic infection. In contrast to patients with chronic infection, it appears that spontaneously induced TAA‐specific CTLs in tumor‐bearing patients are not exhausted but rather can be activated and expanded when the patients are treated with TAA peptide vaccines, because a considerable number of investigations showed the generation of TAA‐specific CTLs from peripheral blood (PB) of tumor‐bearing patients and an increase in CTL frequencies after treatment with TAA‐specific vaccines.( 5 , 6 , 7 , 8 ) This discrepancy in responsibility of CTLs between chronic infection and tumor bearing indicates the existence of a unique mechanism of maintenance of functional TAA‐specific CTLs in tumor‐bearing patients. Thus, to elucidate the unique mechanism, comprehensive analysis of the spontaneously induced TAA‐specific CTLs is important.
Bone marrow (BM) has recently been shown to be an important site for T cell priming and reactivation, generation of T cell memory and recruitment of large amounts of circulating memory T cells and antigen‐loaded dendritic cells (DCs).( 9 , 10 , 11 , 12 , 13 ) Memory CD8+ T cells in BM are more activated than those in the lymphoid periphery, and it was proposed that memory CD8+ T cells in BM might receive stimulation from BM‐resident cells through cell–cell contact or cytokines such as interleukin (IL)‐7 or ‐15, resulting in their long‐term maintenance in BM.( 12 , 14 , 15 , 16 , 17 , 18 ) These findings indicated that BM was a crucial organ for migration of mature T cells and greatly contributed to long‐term T cell memory. However, these findings mainly resulted from the analysis of immune responses to foreign pathogens such as virus, and the role of BM in immune response to self‐antigens such as TAAs has not been investigated in detail.
Wilms’ tumor gene (WT1), which has an oncogenic function, is highly expressed in various kinds of hematological malignancies and solid tumors.( 19 , 20 , 21 , 22 , 23 ) Previous studies indicated that stimulation of PBMCs with MHC class I‐restricted WT1 protein‐derived peptides induced WT1‐specific CD8+ T cells in an MHC class I‐restricted manner, and the induced WT1‐specific CD8+ T cells specifically killed WT1‐expressing tumor cells without affecting normal cells that physiologically expressed WT1, indicating that WT1 could be a promising target antigen for cancer immunotherapy.( 22 , 23 , 24 , 25 , 26 , 27 ) WT1‐specific CD8+ T cells and WT1 IgM and IgG antibodies were spontaneously induced in patients with WT1‐expressing tumors.( 28 ) Clinical trials of WT1 peptide vaccination are now being carried out for patients with various types of malignancies, and WT1‐specific CD8+ T cell responses and the resultant clinical responses have been reported.( 5 , 21 , 29 , 30 , 31 , 32 , 33 , 34 ) However, detailed analysis of spontaneously induced WT1‐specific CD8+ T cells in tumor‐bearing patients has not yet been done. Furthermore, the majority of the findings resulted from the analysis of PB, and there is little data about WT1‐specific CD8+ T cells in BM, an important site for immune response to TAAs. Therefore, detailed comparative analysis of WT1‐specific CD8+ T cells in both PB and BM is interesting and necessary to understand further the WT1‐directed immune responses, which should lead to enhancement of the clinical response of WT1 protein‐targeted immunotherapy.
In the present study, we comparatively analyzed WT1‐specific CD8+ T cells in BM and PB in solid tumor‐bearing patients using multicolor flowcytometry for cell surface differentiation markers, CD107a/b functional assay for WT1 peptide‐specific cytotoxic potential, and carboxyfluorescein diacetate succinimidyl ester (CFSE) dilution assay for WT1 peptide‐specific proliferation, and describe that WT1‐specific CD8+ T cells in BM are less differentiated and more proliferative than those in PB, implying an important role of BM as a secondary lymphoid organ.
Materials and Methods
Patients and healthy donors.
Three patients with lung cancer, two patients with ovarian cancer, one patient with osteosarcoma, and one patient with soft‐tissue sarcoma were analyzed (Table 1). WT1 expression in tumor cells was determined by immunohistochemistry. No bone marrow metastasis was detected in any patient. After written informed consent was given, PB and BM samples were obtained from seven HLA‐A*2402+ patients. PB samples were also obtained from four HLA‐A*2402+ healthy donors. PBMCs and BM mononuclear cells (BMMCs) were isolated by density gradient centrifugation using Ficoll–Hypaque and cryopreserved until analysis.
Table 1.
Profile of patients who participated in this study
| Pt. No. | Age, years/sex | Disease | Clinical stage | Prior treatments |
|---|---|---|---|---|
| 1 | 56/F | Ovarian cancer (Serous papillary adenocarcinoma) | IIIc | Chemo |
| 2 | 72/F | Ovarian cancer (Carcinosarcoma) | II | Chemo |
| 3 | 16/F | Osteosarcoma | II | Chemo/TAE |
| 4 | 51/M | Soft‐tissue sarcoma(Clear cell sarcoma) | IV | Chemo/TAE |
| 5 | 63/M | Lung cancer(Squamous cell carcinoma) | IIIb | Chemo/RT |
| 6 | 74/M | Lung cancer(Adenocarcinoma) | IV | Chemo/RT |
| 7 | 74/M | Lung cancer (Squamous cell carcinoma) | IV | Ope/RT |
Chemo, chemotherapy; F, female; M, male; Ope, operation; Pt., patient; RT, radiation therapy; TAE, transcatheter arterial embolization.
Flow cytometric analysis.
PBMCs and BMMCs were incubated with phycoerythrin (PE)‐conjugated HLA‐A*2402/WT1235–243 tetramer (MBL, Tokyo, Japan) in FACS buffer composed of PBS and 5% FBS at 37°C for 30 min. Subsequently, these cells were stained with a mixture of mAbs: (a) anti‐CD8‐APC‐Cy7 (BD Biosciences, San Diego, CA, USA), anti‐CD45RA‐ECD (Beckman Coulter, Marseille, France), anti‐CCR7‐PE‐Cy7 (BD Biosciences), FITC‐labeled‐anti‐CD4 (Biolegend, San Diego, CA, USA), ‐CD14 (BD Biosciences), ‐CD16 (eBioscience, San Diego, CA, USA), ‐CD19, ‐CD33, ‐CD34 (all BD Biosciences), and ‐CD56 (eBioscience); or (b) anti‐CD8‐APC‐Cy7, anti‐CD45RA‐ECD, anti‐CCR7‐PE‐Cy7, anti‐CD57‐APC (Biolegend), and anti‐CD28‐FITC (eBioscience), at 4°C for 20 min, washed three times, and resuspended in FACS buffer. In staining with (a), CD8+ and CD4−, CD14−, CD16− CD19−, CD33−, CD34−, and CD56− cells were defined as CD8+ T cells. CD8low+ cells, in which natural killer (NK) cells were contaminated, were gated out from the gating for CD8+ T cells, because cells tended to give rise to non‐specific binding to WT1 tetramer. Data acquisition was carried out on a FACSAria instrument (BD Biosciences), and the data were analyzed using FACSDiva software (BD Biosciences).
CD107a/b assay.
PBMCs and BMMCs were stimulated in vitro with 10 μg/mL natural 9‐mer WT1235 peptide or mERK (QYIHSANVL) peptide (irrelevant peptide) in the presence of BD GolgiStop (BD Biosciences) and FITC‐conjugated mAbs for CD107a and CD107b (BD Biosciences) for 3 h. The cells were then harvested, washed, stained with mAbs for anti‐CD8‐APC‐Cy7, anti‐CD45RA‐ECD, and anti‐CCR7‐PE‐Cy7, and gated on lymphocytes. Frequencies of CD107a/b+ cells induced specifically by WT1 peptide stimulation were calculated by subtracting the frequencies of CD107a/b+ cells induced by irrelevant mERK peptide stimulation from those of CD107a/b+ cells induced by WT1 peptide stimulation.
Proliferation assay.
Proliferative potential of WT1 peptide‐specific CTLs was examined according to previous reports.( 35 ) Briefly, PBMC and BMMC were labeled with 2.5 μm CFSE (Molecular Probes, Eugene, OR, USA), and 2 × 10⁵ cells were plated in 96‐well round plates in 100 μL X‐VIVO 15 with 5% AB serum. The cells were stimulated with natural 9‐mer WT1235–243 peptide at a concentration of 10 μg/mL. After 2 days of culture, 100 μL X‐VIVO 15 medium with 5% AB serum containing IL‐2 (100 IU/mL) was added. After 10 days of peptide stimulation, the cells were re‐stimulated for 6 h with or without the WT1 peptide (10 μg/mL), with the addition of 10 μg/mL Brefeldin A (SIGMA) for the last 5 h to block cytokine secretion. After 6 h of WT1 peptide stimulation, cells were washed, stained with anti‐CD8‐APC‐Cy‐7 and anti‐CD3‐PerCP, fixed, permeabilized, and stained with anti‐interferon (IFN)‐γ‐APC. CD3+ CD8+ IFN‐γ+ cells were analyzed for CFSE dilution.
Statistical analysis.
Differences between test groups were analyzed using the Mann–Whitney U‐test.
Results
Bone marrow contains WT1‐specific CD8+ T cells at higher frequencies than PB in patients with solid tumor.
Frequencies of WT1 tetramer+ CD8+ T cells in total CD8+ T cells were measured in BM and PB by staining the mononuclear cells with HLA‐A*2402/WT1 tetramer. BMMCs and PBMCs from seven HLA‐A*2402+ patients with solid tumor were examined (Table 1 and Fig. 1). The frequencies of WT1 tetramer+ CD8+ T cells in CD8+ T cells were significantly higher in BM than in PB (median, 0.47%vs 0.22%; P < 0.05) (Fig. 1B). For reference, PB from four HLA‐A*2402+ healthy donors were similarly examined. Frequencies of WT1 tetramer+ CD8+ T cells in PB were significantly lower than those in BM and PB of seven patients (median, 0.05% [PB in healthy donors] vs 0.47% [BM in patients], 0.22% [PB in patients]; P < 0.01) (Fig. 1B), which was consistent with previous reports.( 5 )
Figure 1.
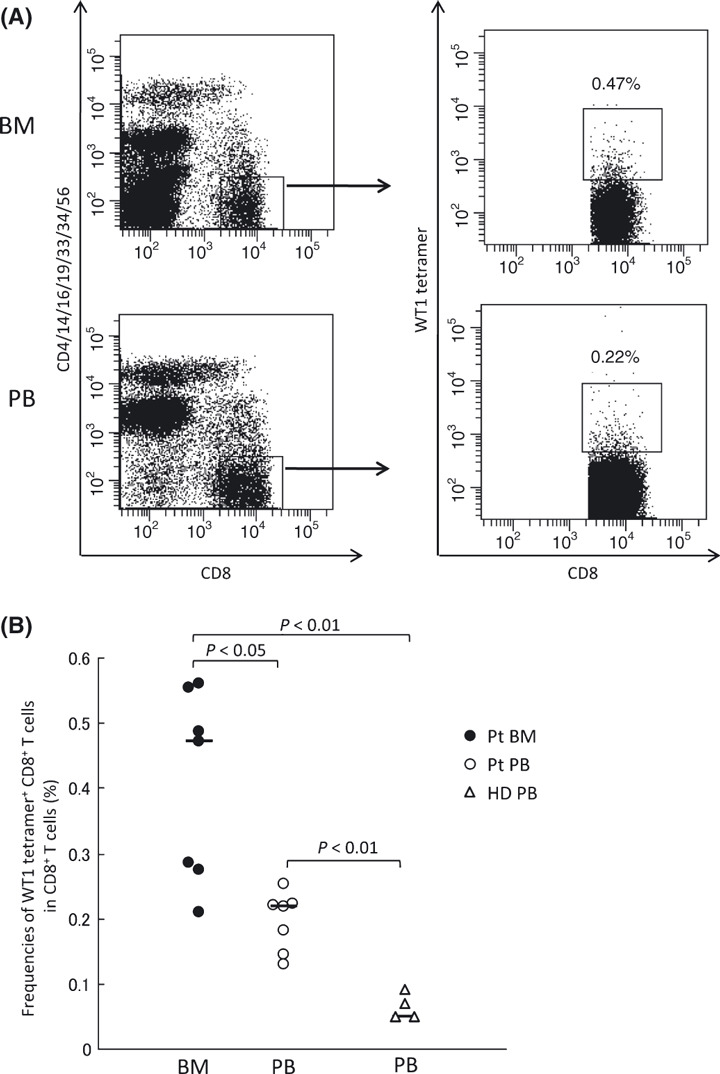
Frequencies of WT1 tetramer+ CD8+ T cells in bone marrow (BM) and peripheral blood (PB) in patients with solid tumors. (A) Representative flow cytometric analysis of WT1 tetramer+ CD8+ T cells. Mononuclear cells from BM and PB were gated on CD8+, CD4−, CD14−, CD16−, CD19−, CD33−, CD34−, and CD56− cells, and WT1 tetramer+ CD8+ T cells were defined as WT1‐specific CD8+ T cells. (B) Frequencies of WT1 tetramer+ CD8+ T cells in CD8+ T cells in BM (closed circles) and PB (open circles) from patients (Pt), and PB from healthy donors (HD; open triangles). The horizontal bars indicate median values of the frequencies.
Effector‐memory and effector subsets of WT1‐specific CD8+ T cells in BM had less differentiated and more proliferative phenotypes than those in PB.
To elucidate whether the WT1‐specific CD8+ T cells in BM phenotypically differed from those in PB, WT1‐specific CD8+ T cells are phenotypically classified into four distinct differentiation stages based on surface expression of CCR7 and CD45RA: naïve (N), CCR7+ CD45RA+; central memory (CM), CCR7+ CD45RA−; effector‐memory (EM), CCR7− CD45RA−; and effector (E), CCR7− CD45RA+.( 36 , 37 ) It is well known that CD8+ T cells differentiate as follows: N→CM→EM→E (Fig. 2A). As shown in Figure 2B, the majority of the WT1 tetramer+ CD8+ T cells belonged to EM and E subsets, and there was no significant difference in the frequencies of N, CM, EM, and E subsets of WT1 tetramer+ CD8+ T cells between BM and PB (Fig. 2C).
Figure 2.
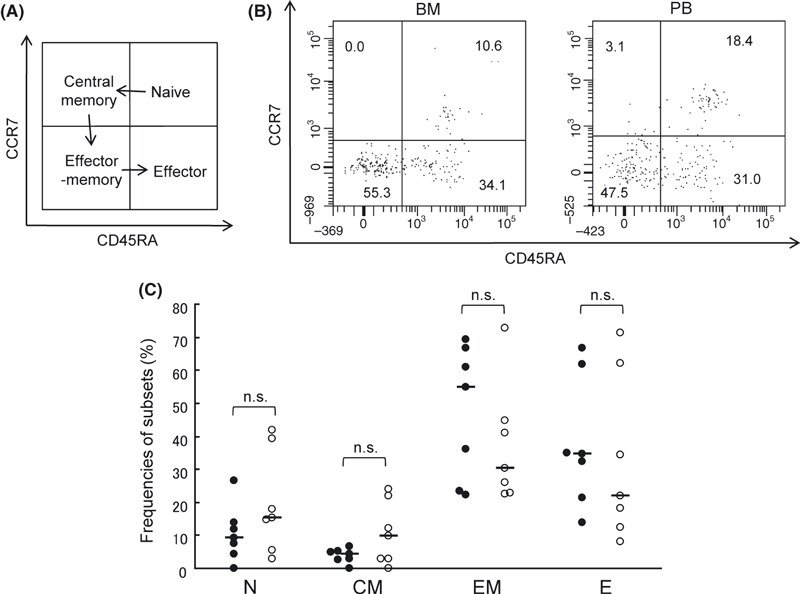
Subset composition of WT1 tetramer+ CD8+ T cells in bone marrow (BM) and peripheral blood (PB). (A) WT1 tetramer+ CD8+ T cells are divided into four subsets according to the expression of CCR7 and CD45RA and differentiate as follows: naïve (N), CCR7+ CD45RA+ → central memory (CM), CCR7+ CD45RA− → effector‐ memory (EM), CCR7− CD45RA− → effector (E), CCR7− CD45RA+. (B) Representative subset analysis of WT1 tetramer+ CD8+ T cells in BM and PB. Frequencies of N, CM, EM, and E subsets are shown. (C), Frequencies of each subset of WT1 tetramer+ CD8+ T cells in BM (closed circles) and PB (open circles) are shown. The horizontal bars indicate median values of the frequencies.
Subsets EM and E of WT1 tetramer+ CD8+ T cells, which accounted for the majority of the T cells, were further examined for the expression of CD57. Low CD57 expression means that cells are less differentiated and have sufficient proliferative potential. As shown in Figure 3A, frequencies of CD57+ cells in E subset of WT1 tetramer+ CD8+ T cells were lower in BM than in PB (median, 28.5%vs 61.0%; P < 0.05). However, frequencies of CD57+ cells in EM subset of WT1 tetramer+ CD8+ T cells were not significantly different between BM and PB. These results indicated that E subset of WT1 tetramer+ CD8+ T cells in BM had less differentiated and more proliferative phenotypes than that in PB.
Figure 3.
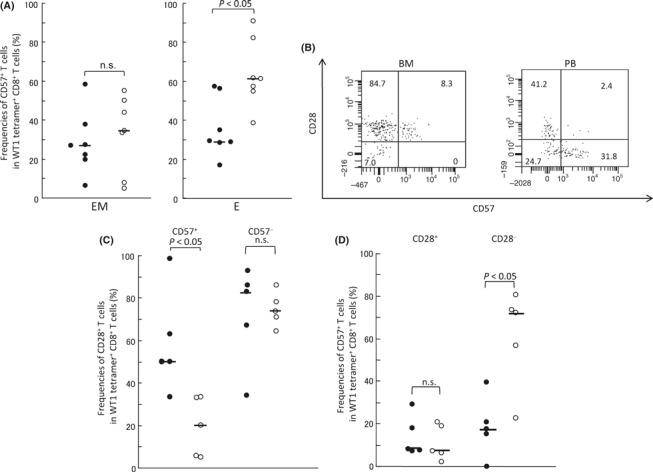
Effector‐memory (EM) and effector (E) subsets of WT1 tetramer+ CD8+ T cells in bone marrow (BM) had less differentiated and more proliferative phenotypes than those in peripheral blood (PB). (A) Frequencies of CD57+ cells in EM and E subsets of WT1 tetramer+ CD8+ T cells in BM (closed circles) and PB (open circles). (B) Representative dot‐plots of FACS analysis of CD28 and CD57 expression in the EM subset. Numbers represent frequencies (%) of cells in each fraction. (C) Frequencies of CD28+ T cells in the CD57+ or CD57− EM subset in WT1 tetramer+ CD8+ T cells in BM (closed circles) and PB (open circles). (D) Frequencies of CD57+ T cells in the CD28+ or CD28− EM subset in WT1 tetramer+ CD8+ T cells in BM (closed circles) and PB (open circles). Two patients were not evaluated because of the small number of cells. Horizontal bars indicate median values of the frequencies. n.s., not significant.
Next, EM subset of WT1 tetramer+ CD8+ T cells, in which no significant difference in CD57 expression was found between BM and PB, was further examined for the expression of CD28, whose high expression means less differentiated state and sufficient proliferative potential (Fig. 3).( 38 , 39 ) In CD57+ cells in EM subset, CD28+ cells (less differentiated) were more in BM than in PB (median, 50.0%vs 20.0%; P < 0.05), whereas in CD28− cells in EM subset, CD57+ cells (more differentiated) were less in BM than in PB (median, 16.6%vs 71.4%; P < 0.05) (Fig. 3C,D). These results showed that WT1 tetramer+ CD8+ T cells in EM subset also had less differentiated phenotype in BM than in PB. Taken together, these results indicated that both EM and E subsets of WT1 tetramer+ CD8+ T cells in BM had less differentiated and more proliferative phenotypes than those of WT1 tetramer+ CD8+ T cells in PB.
WT1‐specific CD8+ T cells in BM have higher proliferative potential than those in PB.
As we demonstrated that EM and E subsets of WT1‐specific CD8+ T cells in BM had less differentiated and more proliferative phenotypes than those in PB, proliferative activity of WT1‐specific CD8+ T cells was examined. CFSE‐labeled BMMCs and PBMCs were stimulated with WT1 peptide. After 10 days of the peptide stimulation, expanded BMMCs and PBMCs were restimulated with WT1 peptide for 6 h and analyzed for CFSE dilution in WT1 peptide‐responding IFN‐γ+ CD3+ CD8+ cells (Fig. 4). A substantial number of IFN‐γ+ cells were detected after the stimulation with WT1 peptide (Fig. 4A), but only a few IFN‐γ+ cells were detected without the stimulation (negative control; data not shown). CFSE dilution profile of the IFN‐γ+ cells and its mean fluorescence intensity (MFI, 3008.5 [PB] vs 11 051 [BM]; P < 0.05) showed that IFN‐γ+ CD3+ CD8+ cells in BM were more proliferative than those in PB (Fig. 4B). These results indicated that WT1‐specific CD8+ T cells in BM had higher proliferative potential than those in PB.
Figure 4.
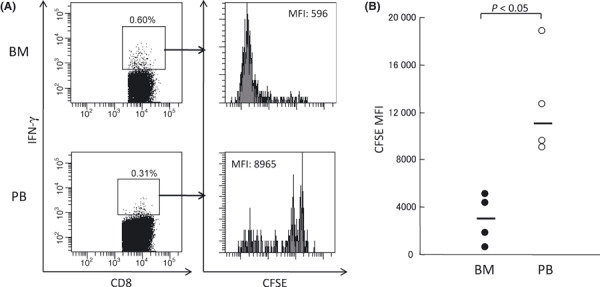
Proliferative potential of WT1‐reactive CD8+ T cells. Carboxyfluorescein diacetate succinimidyl ester (CFSE)‐labeled bone marrow (BM) and peripheral blood (PB) mononuclear cells were stimulated with WT1 peptides, and CFSE dilution was analyzed by FACS. (A) Representative flow cytometric analysis of CFSE dilution in interferon (IFN)‐γ+ CD8+ CD3+ T cells. (B) CFSE mean fluorescence intensity (MFI) of IFN‐γ+ CD8+ CD3+ T cells in BM (closed circles) and PB (open circles). Horizontal bars indicate median values of MFI.
WT1‐specific CD8+ T cells in BM have lower cytotoxic potential than those in PB.
Cytotoxic potential of WT1 tetramer+ CD8+ T cells was analyzed by CD107a/b assay, because the assay was shown to strongly correlate with killing activity of CTLs.( 40 ) BMMCs and PBMCs were stimulated with WT1 peptide or mERK irrelevant peptide, then frequencies of CD107a/b‐expressing cells were examined. As shown in Figure 5A, the frequencies of CD107a/b‐expressing cells in WT1 tetramer+ CD8+ T cells were lower in BM than in PB (median, 12.4%vs 33.7%; P < 0.05). Furthermore, CD107a/b expression on EM and E subsets of WT1 tetramer+ CD8+ T cells was investigated in BM and PB. As shown in Figure 5B, frequencies of CD107a/b‐expressing cells in EM and E subsets of WT1 tetramer+ CD8+ T cells were significantly lower in BM than in PB (EM, 9.1%vs 25.0%, P < 0.05; E, 0.8%vs 36.7%, P < 0.05). These results strongly indicated that WT1‐specific cytotoxic potential of WT1‐specific CD8+ T cells in BM was lower than that of WT1‐specific CD8+ T cells in PB.
Figure 5.
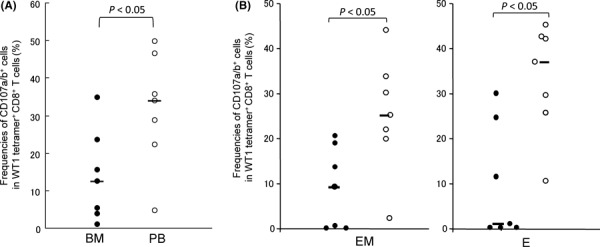
Cytotoxic potential of WT1 tetramer+ CD8+ T cells. Mononuclear cells from bone marrow (BM) and peripheral blood (PB) were stimulated with WT1 peptide, then CD107a/b cell surface expression was examined. (A) Frequencies of CD107a/b+ cells in WT1 tetramer+ CD8+ T cells in BM (closed circles) and PB (open circles). (B) Frequencies of CD107a/b+ cells in effector‐memory (EM) and effector (E) subsets in WT1 tetramer+ CD8+ T cells in BM (closed circles) and PB (open circles). Horizontal bars indicate median values of the frequencies.
Expression of chemokine receptor CCR5 on WT1‐specific CD8+ T cells higher in BM than in PB.
Expression levels of chemokine receptors CCR5 and CXCR4 on WT1 tetramer+ CD8+ T cells were examined in BM and PB. As shown in Figure 6, frequencies of CCR5+ cells in WT1 tetramer+ CD8+ T cells were significantly higher in BM than in PB (median, 64.3%vs 52.5%; P < 0.05). Frequencies of CXCR4+ cells in WT1 tetramer+ CD8+ T cells tended to be higher in BM than in PB, although they were not statistically significant (median, 49.3%vs 35.7%, not significant) (data not shown). Ligands CCL5 and SDF‐1 for chemokine receptors CCR5 and CXCR4, respectively, are highly expressed in the BM microenvironment and play an important role in interaction between the cells with these chemokine receptors and the BM microenvironment. Therefore, these results, at least in part, gave us an explanation for the preferential residence of WT1‐specific CD8+ T cells in BM compared to PB.
Figure 6.
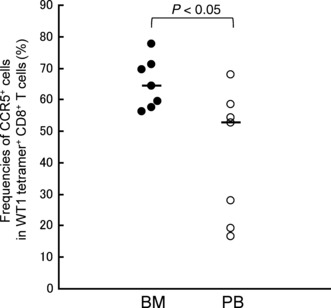
Expression of chemokine receptor CCR5 on WT1 tetramer+ CD8+ T cells. Frequencies of CCR5+ cells in WT1 tetramer+ CD8+ T cells in bone marrow (BM; closed circles) and peripheral blood (PB; open circles). Horizontal bars indicate median values of the frequencies.
Discussion
The present study showed for the first time the characterization of WT1‐specific CD8+ T cells that were spontaneously induced as a result of stimulating the immune system by highly WT1‐expressing tumor cells in patients with solid tumor. In comparison with WT1‐specific CD8+ T cells in PB, those in BM were higher in frequency, less differentiated, and more proliferative, and had less cytotoxic potential. The preferential residence of WT1‐specific CD8+ T cells in BM could be explained, at least in part, by the higher expression of chemokine receptors CCR5 and CXCR4 on WT 1‐specific CD8+ T cells in BM compared to WT1‐specific CD8+ T cells in PB.
Our results allowed us to consider that BM provided an important site for priming and reactivation of CD8+ T cells with TAAs, that is, BM functioned as a secondary lymphoid organ. It has been reported that differentiated DCs constitutively traffic from peripheral tissues to blood and the circulating DCs home with a rather high tropism to BM, where the DCs activate naïve and resident T cells.( 10 , 11 , 12 , 13 , 41 ) Therefore, it appeared that DCs that captured WT1 antigen, which was produced from WT1‐expressing tumor cells, in peripheral sites homed to BM, presented the WT1 antigen to circulating naïve CD8+ T cells and resident CD8+ T cells and activated them. It then seems that the activated WT1‐specific CD8+ T cells differentiated into the CD8+ T cells with more matured phenotypes, which finally migrated from BM to tumor sites through PB and exerted cytotoxic activity there. Others analyzed MUC‐1‐ or Her2/neu‐specific CD8+ T cells that were spontaneously induced in tumor‐bearing patients by using the corresponding tetramers and reported no difference in the frequencies of the CD8+ T cells between BM and PB.( 42 , 43 ) However, as further detailed analysis of the CD8+ T cells was not done in these studies, the cause of the discrepancy between our results and theirs cannot be discussed in detail.
Concerning another aspect of BM function, a number of reports showed that BM was a pooling site of memory T cells.( 12 , 14 , 16 , 18 , 41 , 44 , 45 , 46 , 47 , 48 , 49 ) Adoptive T cell transfer studies showed that memory T cells migrated to BM and preferentially proliferated there through the signals by cytokines such as IL‐7 and IL‐15.( 14 , 16 ) Thus, BM plays an important role in the maintenance of memory T cells. Our present study also showed that WT1‐specific effector‐memory and effector CD8+ T cells accumulated in BM in patients with WT1‐expressing solid tumor. Furthermore, our detailed phenotype analysis showed that WT1‐specific CD8+ T cells in E and EM subsets in BM had unique phenotypes, such as less differentiated state, more proliferative potential, and less cytotoxic, compared to those in E and EM subsets in PB. T cells with low expression of CD57 and high expression of CD28 are considered to sustain sufficient proliferative potential and less cytotoxic potential. Conversely, high expression of CD57 and low expression of CD28 are associated with replicatively senescent T cells and clonally exhausted T cells with cytotoxic potential, respectively.( 38 , 39 , 50 , 51 , 52 ) In the T cells with these characteristics, T‐cell receptor management extra circles (TREC) levels were very low and telomere lengths were shortened, and hence these T cells apoptose by antigen stimulation.( 39 , 53 ) Therefore, our phenotype analysis suggested that WT1‐specific CD8+ T cells in EM and E subsets in BM sustained more sufficient proliferative potential and less cytotoxic potential, compared to those in EM and E subsets in PB. CD107a/b assay, a functional assay to examine cytotoxicity, also revealed that WT1‐specific CD8+ T cells in BM had less cytotoxic potential than those in PB, consistent with the results of the phenotype analysis of CD57 and CD28 expression. In the CD107a/b assay presented here, whole BMMCs and PBMCs were used. To confirm our present results, CD107a/b assay was applied to EM and E subsets FACS‐sorted from another patient. As expected, frequencies of CD107a/b‐expressing cells in WT1 tetramer+ CD8+ T cells in purified EM and E subsets were lower in BM than in PB, confirming our results. Furthermore, proliferation assay by CFSE dilution that showed higher proliferative potential of WT1‐specific CD8+ T cells in BM than in PB was also compatible with the results of phenotype analysis. These results suggested that WT1‐specific CD8+ T cells with more proliferative and less cytotoxic potential could be maintained in the BM until they are reactivated by DCs.
WT1‐specific CD8+ T cells in BM expressed chemokine receptors CCR5 and CXCR4 at higher frequencies than those in PB. CCL3 and CCL5, ligands for CCR5, were expressed on BM fibroblasts, and CXCL12, a ligand for CXCR4, was produced on BM stromal cells and endothelium of BM microvessels.( 54 , 55 , 56 ) Therefore, preferential homing and localization of WT1‐specific CD8+ T cells to BM should be ascribed to preferential interaction between chemokine receptors on the T cells and its ligands in the BM microenvironment. It appears to be reasonable to consider that downregulation of such chemokine receptors on the T cells promotes emigration of the T cells from BM to PB. These findings also allowed us to consider BM as a secondary lymphoid organ.
Acknowledgment
The excellent help of T. Umeda as a research nurse is acknowledged.
References
- 1. Dunn GP, Bruce AT, Ikeda H, Old LJ, Schreiber RD. Cancer immunoediting: from immunosurveillance to tumor escape. Nat Immunol 2002; 3: 991–8. [DOI] [PubMed] [Google Scholar]
- 2. Malmberg KJ, Ljunggren HG. Escape from immune‐ and nonimmune‐mediated tumor surveillance. Semin Cancer Biol 2006; 16: 16–31. [DOI] [PubMed] [Google Scholar]
- 3. Klebanoff CA, Gattinoni L, Restifo NP. CD8+ T‐cell memory in tumor immunology and immunotherapy. Immunol Rev 2006; 211: 214–24. [DOI] [PMC free article] [PubMed] [Google Scholar]
- 4. Ibegbu CC, Xu YX, Harris W, Maggio D, Miller JD, Kourtis AP. Expression of killer cell lectin‐like receptor G1 on antigen‐specific human CD8+ T lymphocytes during active, latent, and resolved infection and its relation with CD57. J Immunol 2005; 174: 6088–94. [DOI] [PubMed] [Google Scholar]
- 5. Oka Y, Tsuboi A, Taguchi T et al. Induction of WT1 (Wilms’ tumor gene)‐specific cytotoxic T lymphocytes by WT1 peptide vaccine and the resultant cancer regression. Proc Natl Acad Sci U S A 2004; 101: 13885–90. [DOI] [PMC free article] [PubMed] [Google Scholar]
- 6. Pittet MJ, Speiser DE, Lienard D et al. Expansion and functional maturation of human tumor antigen‐specific CD8+ T cells after vaccination with antigenic peptide. Clin Cancer Res 2001; 7: 796s–803s. [PubMed] [Google Scholar]
- 7. Walker EB, Haley D, Miller W et al. gp100(209‐2M) peptide immunization of human lymphocyte antigen‐A2+ stage I‐III melanoma patients induces significant increase in antigen‐specific effector and long‐term memory CD8+ T cells. Clin Cancer Res 2004; 10: 668–80. [DOI] [PubMed] [Google Scholar]
- 8. Romero P, Valmori D, Pittet MJ et al. Antigenicity and immunogenicity of Melan‐A/MART‐1 derived peptides as targets for tumor reactive CTL in human melanoma. Immunol Rev 2002; 188: 81–96. [DOI] [PubMed] [Google Scholar]
- 9. Letsch A, Knoedler M, Na IK et al. CMV‐specific central memory T cells reside in bone marrow. Eur J Immunol 2007; 37: 3063–8. [DOI] [PubMed] [Google Scholar]
- 10. Cavanagh LL, Bonasio R, Mazo IB et al. Activation of bone marrow‐resident memory T cells by circulating, antigen‐bearing dendritic cells. Nat Immunol 2005; 6: 1029–37. [DOI] [PMC free article] [PubMed] [Google Scholar]
- 11. Feuerer M, Beckhove P, Garbi N et al. Bone marrow as a priming site for T‐cell responses to blood‐borne antigen. Nat Med 2003; 9: 1151–7. [DOI] [PubMed] [Google Scholar]
- 12. Di Rosa F, Pabst R. The bone marrow: a nest for migratory memory T cells. Trends Immunol 2005; 26: 360–6. [DOI] [PubMed] [Google Scholar]
- 13. Bonasio R, von Andrian UH. Generation, migration and function of circulating dendritic cells. Curr Opin Immunol 2006; 18: 503–11. [DOI] [PubMed] [Google Scholar]
- 14. Becker TC, Coley SM, Wherry EJ, Ahmed R. Bone marrow is a preferred site for homeostatic proliferation of memory CD8 T cells. J Immunol 2005; 174: 1269–73. [DOI] [PubMed] [Google Scholar]
- 15. Di Rosa F, Santoni A. Bone marrow CD8 T cells are in a different activation state than those in lymphoid periphery. Eur J Immunol 2002; 32: 1873–80. [DOI] [PubMed] [Google Scholar]
- 16. Parretta E, Cassese G, Barba P, Santoni A, Guardiola J, Di Rosa F. CD8 cell division maintaining cytotoxic memory occurs predominantly in the bone marrow. J Immunol 2005; 174: 7654–64. [DOI] [PubMed] [Google Scholar]
- 17. Cassese G, Parretta E, Pisapia L, Santoni A, Guardiola J, Di Rosa F. Bone marrow CD8 cells down‐modulate membrane IL‐7Ralpha expression and exhibit increased STAT‐5 and p38 MAPK phosphorylation in the organ environment. Blood 2007; 110: 1960–9. [DOI] [PubMed] [Google Scholar]
- 18. Mazo IB, Honczarenko M, Leung H et al. Bone marrow is a major reservoir and site of recruitment for central memory CD8+ T cells. Immunity 2005; 22: 259–70. [DOI] [PubMed] [Google Scholar]
- 19. Oji Y, Miyoshi S, Maeda H et al. Overexpression of the Wilms’ tumor gene WT1 in de novo lung cancers. Int J Cancer 2002; 100: 297–303. [DOI] [PubMed] [Google Scholar]
- 20. Oji Y, Ogawa H, Tamaki H et al. Expression of the Wilms’ tumor gene WT1 in solid tumors and its involvement in tumor cell growth. Jpn J Cancer Res 1999; 90: 194–204. [DOI] [PMC free article] [PubMed] [Google Scholar]
- 21. Oji Y, Suzuki T, Nakano Y et al. Overexpression of the Wilms’ tumor gene W T1 in primary astrocytic tumors. Cancer Sci 2004; 95: 822–7. [DOI] [PMC free article] [PubMed] [Google Scholar]
- 22. Oka Y, Tsuboi A, Kawakami M et al. Development of WT1 peptide cancer vaccine against hematopoietic malignancies and solid cancers. Curr Med Chem 2006; 13: 2345–52. [DOI] [PubMed] [Google Scholar]
- 23. Sugiyama H. Wilms’ tumor gene WT1: its oncogenic function and clinical application. Int J Hematol 2001; 73: 177–87. [DOI] [PubMed] [Google Scholar]
- 24. Oka Y, Udaka K, Tsuboi A et al. Cancer immunotherapy targeting Wilms’ tumor gene WT1 product. J Immunol 2000; 164: 1873–80. [DOI] [PubMed] [Google Scholar]
- 25. Oka Y, Elisseeva OA, Tsuboi A et al. Human cytotoxic T‐lymphocyte responses specific for peptides of the wild‐type Wilms’ tumor gene (WT1) product. Immunogenetics 2000; 51: 99–107. [DOI] [PubMed] [Google Scholar]
- 26. Ohminami H, Yasukawa M, Fujita S. HLA class I‐restricted lysis of leukemia cells by a CD8(+) cytotoxic T‐lymphocyte clone specific for WT1 peptide. Blood 2000; 95: 286–93. [PubMed] [Google Scholar]
- 27. Tsuboi A, Oka Y, Udaka K et al. Enhanced induction of human WT1‐specific cytotoxic T lymphocytes with a 9‐mer WT1 peptide modified at HLA‐A*2402‐binding residues. Cancer Immunol Immunother 2002; 51: 614–20. [DOI] [PMC free article] [PubMed] [Google Scholar]
- 28. Elisseeva OA, Oka Y, Tsuboi A et al. Humoral immune responses against Wilms tumor gene WT1 product in patients with hematopoietic malignancies. Blood 2002; 99: 3272–9. [DOI] [PubMed] [Google Scholar]
- 29. Tsuboi A, Oka Y, Osaki T et al. WT1 peptide‐based immunotherapy for patients with lung cancer: report of two cases. Microbiol Immunol 2004; 48: 175–84. [DOI] [PubMed] [Google Scholar]
- 30. Oka Y, Tsuboi A, Murakami M et al. Wilms tumor gene peptide‐based immunotherapy for patients with overt leukemia from myelodysplastic syndrome (MDS) or MDS with myelofibrosis. Int J Hematol 2003; 78: 56–61. [DOI] [PubMed] [Google Scholar]
- 31. Oka Y, Tsuboi A, Elisseeva OA et al. WT1 peptide cancer vaccine for patients with hematopoietic malignancies and solid cancers. ScientificWorldJournal 2007; 7: 649–65. [DOI] [PMC free article] [PubMed] [Google Scholar]
- 32. Izumoto S, Tsuboi A, Oka Y et al. Phase II clinical trial of Wilms tumor 1 peptide vaccination for patients with recurrent glioblastoma multiforme. J Neurosurg 2008; 108: 963–71. [DOI] [PubMed] [Google Scholar]
- 33. Iiyama T, Udaka K, Takeda S et al. WT1 (Wilms’ tumor 1) peptide immunotherapy for renal cell carcinoma. Microbiol Immunol 2007; 51: 519–30. [DOI] [PubMed] [Google Scholar]
- 34. Rezvani K, Yong AS, Mielke S et al. Leukemia‐associated antigen‐specific T‐cell responses following combined PR1 and WT1 peptide vaccination in patients with myeloid malignancies. Blood 2008; 111: 236–42. [DOI] [PMC free article] [PubMed] [Google Scholar]
- 35. Bozzacco L, Trumpfheller C, Siegal FP et al. DEC‐205 receptor on dendritic cells mediates presentation of HIV gag protein to CD8+ T cells in a spectrum of human MHC I haplotypes. Proc Natl Acad Sci U S A 2007; 104: 1289–94. [DOI] [PMC free article] [PubMed] [Google Scholar]
- 36. Sallusto F, Lenig D, Forster R, Lipp M, Lanzavecchia A. Two subsets of memory T lymphocytes with distinct homing potentials and effector functions. Nature 1999; 401: 708–12. [DOI] [PubMed] [Google Scholar]
- 37. Sallusto F, Mackay CR, Lanzavecchia A. The role of chemokine receptors in primary, effector, and memory immune responses. Annu Rev Immunol 2000; 18: 593–620. [DOI] [PubMed] [Google Scholar]
- 38. Monteiro J, Batliwalla F, Ostrer H, Gregersen PK. Shortened telomeres in clonally expanded CD28‐CD8+ T cells imply a replicative history that is distinct from their CD28 + CD8+ counterparts. J Immunol 1996; 156: 3587–90. [PubMed] [Google Scholar]
- 39. Weng NP, Akbar AN, Goronzy J. CD28(−) T cells: their role in the age‐associated decline of immune function. Trends Immunol 2009; 30: 306–12. [DOI] [PMC free article] [PubMed] [Google Scholar]
- 40. Rubio V, Stuge TB, Singh N et al. Ex vivo identification, isolation and analysis of tumor‐cytolytic T cells. Nat Med 2003; 9: 1377–82. [DOI] [PubMed] [Google Scholar]
- 41. Di Rosa F. T‐lymphocyte interaction with stromal, bone and hematopoietic cells in the bone marrow. Immunol Cell Biol 2009; 87: 20–9. [DOI] [PubMed] [Google Scholar]
- 42. Feuerer M, Beckhove P, Bai L et al. Therapy of human tumors in NOD/SCID mice with patient‐derived reactivated memory T cells from bone marrow. Nat Med 2001; 7: 452–8. [DOI] [PubMed] [Google Scholar]
- 43. Beckhove P, Feuerer M, Dolenc M et al. Specifically activated memory T cell subsets from cancer patients recognize and reject xenotransplanted autologous tumors. J Clin Invest 2004; 114: 67–76. [DOI] [PMC free article] [PubMed] [Google Scholar]
- 44. Price PW, Cerny J. Characterization of CD4+ T cells in mouse bone marrow I. Increased activated/memory phenotype and altered TCR Vbeta repertoire. Eur J Immunol 1999; 29: 1051–6. [DOI] [PubMed] [Google Scholar]
- 45. Slifka MK, Whitmire JK, Ahmed R. Bone marrow contains virus‐specific cytotoxic T lymphocytes. Blood 1997; 90: 2103–8. [PubMed] [Google Scholar]
- 46. Zhang X, Dong H, Lin W et al. Human bone marrow: a reservoir for “enhanced effector memory” CD8+ T cells with potent recall function. J Immunol 2006; 177: 6730–7. [DOI] [PubMed] [Google Scholar]
- 47. Tokoyoda K, Zehentmeier S, Hegazy AN et al. Professional memory CD4+ T lymphocytes preferentially reside and rest in the bone marrow. Immunity 2009; 30: 721–30. [DOI] [PubMed] [Google Scholar]
- 48. Racanelli V, Frassanito MA, Leone P, Brunetti C, Ruggieri S, Dammacco F. Bone marrow of persistently hepatitis C virus‐infected individuals accumulates memory CD8+ T cells specific for current and historical viral antigens: a study in patients with benign hematological disorders. J Immunol 2007; 179: 5387–98. [DOI] [PubMed] [Google Scholar]
- 49. Palendira U, Chinn R, Raza W et al. Selective accumulation of virus‐specific CD8+ T cells with unique homing phenotype within the human bone marrow. Blood 2008; 112: 3293–302. [DOI] [PubMed] [Google Scholar]
- 50. Sze DM, Giesajtis G, Brown RD et al. Clonal cytotoxic T cells are expanded in myeloma and reside in the CD8(+)CD57(+)CD28(–) compartment. Blood 2001; 98: 2817–27. [DOI] [PubMed] [Google Scholar]
- 51. Champagne P, Ogg GS, King AS et al. Skewed maturation of memory HIV‐specific CD8 T lymphocytes. Nature 2001; 410: 106–11. [DOI] [PubMed] [Google Scholar]
- 52. Bandres E, Merino J, Vazquez B et al. The increase of IFN‐gamma production through aging correlates with the expanded CD8(+high)CD28(–)CD57(+) subpopulation. Clin Immunol 2000; 96: 230–5. [DOI] [PubMed] [Google Scholar]
- 53. Brenchley JM, Karandikar NJ, Betts MR et al. Expression of CD57 defines replicative senescence and antigen‐induced apoptotic death of CD8+ T cells. Blood 2003; 101: 2711–20. [DOI] [PubMed] [Google Scholar]
- 54. Bleul CC, Fuhlbrigge RC, Casasnovas JM, Aiuti A, Springer TA. A highly efficacious lymphocyte chemoattractant, stromal cell‐derived factor 1 (SDF‐1). J Exp Med 1996; 184: 1101–9. [DOI] [PMC free article] [PubMed] [Google Scholar]
- 55. Peled A, Grabovsky V, Habler L et al. The chemokine SDF‐1 stimulates integrin‐mediated arrest of CD34(+) cells on vascular endothelium under shear flow. J Clin Invest 1999; 104: 1199–211. [DOI] [PMC free article] [PubMed] [Google Scholar]
- 56. Brouty‐Boye D, Doucet C, Clay D, Le Bousse‐Kerdiles MC, Lampidis TJ, Azzarone B. Phenotypic diversity in human fibroblasts from myelometaplasic and non‐myelometaplasic hematopoietic tissues. Int J Cancer 1998; 76: 767–73. [DOI] [PubMed] [Google Scholar]