Abstract
Gangliosides are expressed in neuroectoderm‐derived tumors, and seemed to play roles in the regulation of cancer properties. To examine the behavior and roles of individual gangliosides, GM1/GD1b/GA1 synthase cDNA was introduced into the melanoma cell line SK‐MEL‐37, and changes in tumor phenotypes were analyzed. The transfectant cells showed neo‐expression of GD1b, GT1b, and GM1, and reduced expression of GM3, GM2, GD2, and GD3. Function analyses revealed that the transfectant cells had definite reduction in cell growth and invasion. Tyrosine‐phosphorylation levels of proteins such as p130Cas and paxillin were also reduced in the transfectants. These results suggested that the expression of GM1/GD1b/GA1 synthase resulted in the suppression of tumor properties. In the analyses of the floating patterns of gangliosides using fractions from sucrose density gradient ultracentrifugation of TritonX‐100 extracts, the majority of gangliosides were found in glycolipid‐enriched microdomain (GEM)/raft fractions, while GD3, GD1b, and GT1b in the transfectant cells tended to disperse to non‐GEM/raft fractions. Furthermore, GD3, GD1b, and GT1b in non‐GEM/raft dominantly had unsaturated fatty acids, while those in GEM/rafts contained more saturated forms than in non‐GEM/rafts. This might be a mechanism for the decreased tumor properties in the transfectants of GM1/GD1b/GA1 synthase cDNA. (Cancer Sci 2010)
Gangliosides, sialic acid‐containing glycosphingolipids, are highly expressed in the nervous tissues of mammals and birds.( 1 ) They are also strongly expressed in neuroectoderm‐derived tumor cells.( 2 , 3 ) In particular, ganglioside GD3, a typical disialyl‐ganglioside, is specifically expressed in human melanomas and melanoma cell lines,( 3 ) while the normal counterparts, melanocytes scarcely express GD3.( 4 ) Therefore, GD3 has been used as a target of melanoma therapy with anti‐GD3 monoclonal antibodies (mAbs).( 5 , 6 )
Although the implication of GD3 in biological features of melanomas has not well been understood, its role in melanoma cells has recently been demonstrated using transfectant cells of GD3 synthase cDNA by our group.( 7 ) In the studies, it was shown that adaptor molecules were activated more strongly in GD3‐positive cells, leading to increased cell proliferation and invasion. These results suggested that GD3 enhances malignant signals mediated through growth factor receptors at microdomains in the plasma membrane of melanoma cells.( 8 )
As a marker for the microdomain, ganglioside GM1 has been widely used.( 9 ) Since we isolated cDNA clones of GM1/GD1b/GA1 synthase,( 10 ) we have reported that expression of GM1 synthase resulted in reduced cell growth( 11 ) or metastasis.( 12 ) These results suggest that expression of GM1/GD1b/GA1 synthase gene and/or GM1 itself generally suppress malignant properties of murine cancer cells.
In this study, we established transfectant cells of the human melanoma line SK‐MEL‐37 (BD) using GM1/GD1b/GA1 synthase cDNA, and analyzed the effects on the tumor properties. Consequently, expression of GM1/GD1b/GA1 synthase gene in the human melanoma line resulted in suppression of cell proliferation and invasion. Molecular mechanisms for the suppressive effects with a focus on the changes in the ganglioside composition and localization in the cells were analyzed.
Materials and Methods
Antibodies. Anti‐caveolin‐1 (rabbit IgG), anti‐p130Cas (rabbit IgG) and anti‐FAK (rabbit IgG) were purchased from Santa Cruz Biotechnology (Santa Cruz, CA, USA). Anti‐flotillin‐1 (mouse monoclonal IgG1) was from Transduction Laboratories (Lexington, KY, USA). Anti‐rabbit IgG conjugated with horseradish peroxidase (HRP) were from Cell Signaling Technology (Beverly, MA, USA). Anti‐PYK2 (mouse IgG1) and anti‐paxillin (mouse IgG1) was from BD Transduction (San Jose, CA, USA), and anti‐PYK2 (rabbit IgG) was from Cell Signaling (Beverly, MA, USA). Anti‐mouse IgG conjugated with HRP was from Amersham Pharmacia Biotech (Little Chalfont, Bucks, UK). Cholera toxin B (CTx‐B) subunit‐biotin conjugate was from List Biological Labs (Campbell, CA, USA). The following anti‐ganglioside mAbs were used as described previously:( 11 , 13 ) mAbM2590 (GM3), mAb10‐11 (GM2), mAb229 (GA1), mAb92‐22 (GD1a), mAbR24 (GD3), mAb220‐51 (GD2), mAb370 (GD1b), and mAb549 (GT1b). The ABC‐PO kit was from Vector Laboratories (Burlingame, CA, USA) and HRP‐1000 was from Konica (Tokyo, Japan).
Construction of a GM1 synthase expression vector. Rat β1,3‐galactosyltransferase cDNA clone pM1T‐9( 10 ) was digested with XhoI, XbaI and inserted into the same sites of pMIKneo to obtain pMIKneo/M1T‐9. pMIKneo, a mammalian expression vector and the SRα promoter was a generous gift from Dr K. Maruyama (Tokyo Medical and Dental University, Tokyo).
Cell culture and transfection. SK‐MEL‐37 (BD) was maintained in Dulbecco’s modified Eagle medium (DMEM) supplemented with 7.5% fetal calf serum (FCS) at 37°C in a humidified atmosphere containing 5% CO2. The pMIK/neo/MT‐9 was transfected into cells with Lipofectamine 2000 (Invitrogen, Carlsbad, CA, USA) according to the manufacturer’s instruction. Stably transfected cells were selected in the presence of 350 μg/mL G418.
Flow cytometry. The cell surface expression of GM1 and other gangliosides was analyzed by flow cytometry (Becton Dickinson, Mountain View, CA, USA) as described.( 14 ) Control samples were prepared by using non‐relevant mAbs with the same subclasses for individual mAbs.
3‐(4,5‐Dimethylthiazol‐2‐yl)‐2,5‐diphenyl tetrazolium bromide (MTT) assay. Cells (4 × 10³) in a serum‐containing medium were plated in 96‐well plates. At days 1–5 of culture, the MTT assay was performed. Cell growth was quantified by assessing the reduction of MTT to formazan based on absorbance at 590 nm by using an Immuno Mini NJ‐2300 ELISA reader (System Instruments, Tokyo, Japan).
In vitro invasion assay. Invasion assays with Boyden chamber were performed as described.( 14 ) In brief, Matrigel (Becton Dickinson) was diluted with ice‐cold phosphate buffered saline (PBS) (100 μg/mL), and added (0.6 mL) to each filter (polyethylene terephthalate membrane, 8‐μm pore, 23.1 mm in diameter; Falcon 3093), and left to be polymerized. They were dried overnight. The membrane was reconstituted with serum‐free medium. The lower chamber (six‐well plate; Falcon 3502) was filled with the culture medium with or without serum before the chamber was assembled. Cells (2 × 10⁵ cells/well) were added to serum‐free medium in the upper chamber and incubated for 24 h. Cells on the reverse surface of the filter were stained with Giemsa (Wako Pure Chemical, Tokyo, Japan), and counted under microscopy.
Preparation of cell lysates. Cells (2 × 10⁵) were plated in a 6‐cm dish. After treatments, cells were lysed with a lysis buffer (20 mM Tris–HCl, pH 7.5, 150 mM NaCl, 1 mM Na2EDTA, 1 mM EGTA, 1% Triton X‐100, 2.5 mM sodium pyrophosphate, 1 mM β‐glycerophosphate, 1 mM Na3VO4, 1 μg/mL leupeptin, 1 mM PMSF) and insoluble materials were removed by centrifugation at 4°C at 10 000 g for 10 min.
Western immunoblotting (IB). Lysates were separated with SDS/PAGE using 10–15% gels. The separated proteins were transferred onto an Immobilon‐P membrane (Millipore, Bedford, MA, USA). Blots were blocked with 3% bovine serum albumin (BSA) in PBS containing 0.05% Tween‐20 for 1 h at room temperature. The membrane was first probed for 1 h with primary antibodies. After being washed, the blots were then incubated for 45 min with goat anti‐rabbit IgGs or goat anti‐mouse IgGs conjugated with HRP (1:2000). After the membranes were washed, bound conjugates were visualized with an enhanced chemiluminescence (ECL) detection system (PerkinElmer Life Science, Boston, MA, USA), or ABC‐PO kit and HRP‐1000.
Immunoprecipitation (IP). The lysates were immunoprecipitated with monoclonal or polyclonal antibodies bound to protein G‐Sepharose or protein A‐Sepharose at 4°C overnight. The beads were washed four times with 1 mL of washing buffer (50 mM Tris–HCl, pH 7.5, 150 mM NaCl, 1 mM MgCl2, 1% TritonX‐100, 1 mM Na3VO4) and finally resuspended in 20 μL of 4 × SDS sample buffer. The precipitated proteins were separated using sodium dodecyl sulfate–polyacrylamide gel electrophoresis (SDS‐PAGE), and then immunoblotted.
Isolation of the glycolipid‐enriched microdomain (GEM)/raft fraction. The GEM/raft membrane microdomains were prepared using a detergent extraction method essentially as described by Mitsuda et al. ( 11 ) Cells were plated at a density of 5 × 10⁵ per 15‐cm dish and cultured up to 95% confluency (four dishes/each preparation). After being washed three times with ice‐cold PBS, the cells were collected, suspended in 1 mL of TNE/Triton X‐100 buffer (1% Triton X‐100, 25 mM Tris–HCl, pH 7.5, 150 mM NaCl, 1 mM EGTA), then Dounce homogenized 20 times, and mixed with an equal volume of 80% sucrose (w/v). Then, samples were placed at the bottom of Ultra‐Clear Centrifuge Tubes (Beckman Instruments, Fullerton, CA, USA). Two mL of 30% sucrose in TNE buffer without Triton X‐100 was laid on the top of the samples, and 1 mL of 5% (w/v) sucrose in TNE buffer without Triton X‐100 was laid on the top. The samples were centrifuged at 105 000 g in an MLS50 rotor (Beckman Instruments) for 16 h at 4°C. The entire procedure was performed at 4°C. From the top of the gradient, 0.5 mL each of fraction was collected to yield 10 fractions.
Glycolipid extraction and thin layer chromatography (TLC). Glycolipids were isolated from cell lysates or fractions from the sucrose density gradient fractionation as described previously.( 15 ) Thin layer chromatography (TLC) was performed with high performance TLC plates (Merck, Darmastadt, Germany) using a solvent system of chloroform/methanol/0.22% CaCl2 (55:45:10). Bands were visualized with resorcinol.
Thin layer chromatography (TLC)‐immunostaining. Thin layer chromatography (TLC)‐immunostaining was performed as described previously.( 15 ) Briefly, after chromatography of glycolipids, the TLC plate was heat‐blotted onto a polyvinylidene difluoride (PVDF) membrane. After blocking in 2% BSA in PBS, the membrane was incubated with mAb for 1 h, washed, and incubated with biotinylated horse antimouse IgG or IgM at a 1:200 dilution for 45 min. The antibody binding was visualized with an ABC‐PO kit and HRP‐1000.
Liquid chromatography/electrospray ionization (LC/ESI)‐MS and multiple reaction monitoring (MRM) analysis. For analysis of ganglioside molecular species, reverse‐phase LC/electrospray ionization (ESI)‐MS and MRM detection were performed by using a 4000Q TRAP quadrupole‐linear ion trap hybrid MS (Applied Biosystems, Foster City, CA, USA) with an UltiMate 3000 nano/cap/micro LC system (Dionex Corporation, Sunnyvale, CA, USA) as shown previously.( 16 ) MS2 analysis of each ganglioside and MS3 analysis of the individual ceramide ions ([Cer‐H2O+H]+) derived from each ganglioside precursor ion( 17 ) were operated in positive ion mode with scan speed of 1000 amu/s, trap fill time of 20 ms, extraction time of 200 ms, ion spray voltage of 5500 V, declustering potential (DP) of 100 V, and collision induced dissociation (CID) of 40 V.
For the MRM analysis, each ganglioside ion ([M‐H]− or [M‐2H]2−) and sialic acid ion (SA−) were individually used as precursor and product ion pairs in the negative ion mode with scan speed of 1000 amu/s, trap fill time of 20 ms, ion spray voltage of −4500 V, DP of −100 V, and CID of −60 to −95 V.
Statistical analysis. The statistical significance of data was determined using Student’s t‐test.
Results
Increased expression of GM1, GD1b, and GT1b in the GM1/GD1b/GA1 synthase cDNA transfectant cells. The transfectant cells of a GM1/GD1b/GA1 synthase cDNA were established and their expression of gangliosides was examined by flow cytometry. GM1, GD1b, and GT1b were newly expressed in the transfectants M1‐5 and M1‐6 (Fig. 1a). On the other hand, a vector control line and the parent SK‐MEL‐37 (BD) showed higher expression of GM3, GM2, GD2, and GD3. The ganglioside synthetic pathway indicates increased processes of GM1, GD1b, and GT1b synthesis correspondingly with the results of flow cytometry (Fig. 1b).
Figure 1.
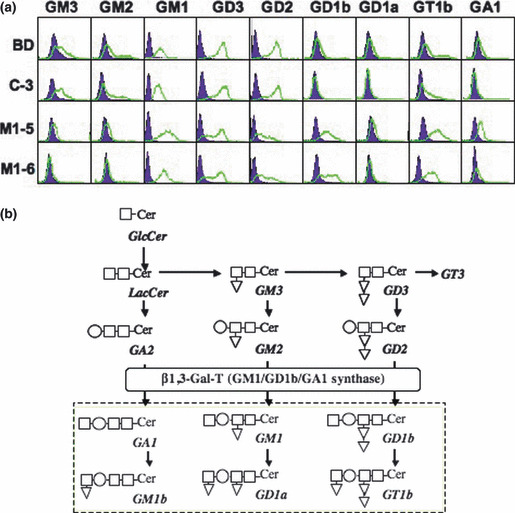
Expression of gangliosides in SK‐MEL‐37 and the transfectant cells. (a) Results of flow cytometry analysis. Gangliosides expression profiles were analyzed by flow cytometry with mAbs and CTx‐B subunit‐biotin conjugate. (b) Ganglioside synthetic pathway is shown. β1,3‐galactosyltransferase (GM1/GD1b/GA1 synthase) catalyzes synthesis of GM1, GD1b, and GA1 from GM2, GD2, and GA2, respectively.
Increased levels of GM1, GD1b, and GT1b in the transfectant cells in TLC and TLC‐immunostaining. As shown in Figure 2(a), ganglioside composition was determined in TLC of extracted gangliosides. In accordance with results of the flow cytometry, M1‐5 and M1‐6 showed more intense bands of GD1b and GT1b than the control and the parent line. In TLC‐immunostaining, M1‐5 and M1‐6 showed stronger bands of GM1, GD1b, and GT1b than the controls (Fig. 2b). In turn, they showed weaker bands of GM3, GM2, GD3, and GD2. These results well corresponded with results of the flow cytometry and TLC, as shown in 1, 2.
Figure 2.
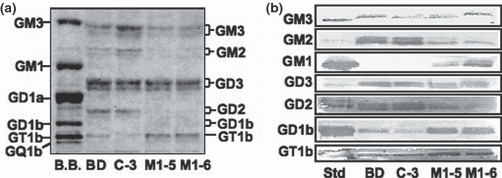
Ganglioside composition as determined by thin layer chromatography (TLC) and TLC‐immunostaining. (a) Gangliosides were examined in TLC using chloroform/methanol: 0.22% CaCl2 (55:45:10). Resorcinol spray was performed for detection of bands. (b) TLC‐immunostaining of gangliosides extracted from four cell lines was performed. After being developed on high performance TLC (HPTLC) aluminium sheets, gangliosides were blotted and then stained with anti‐ganglioside antibodies. Membranes were incubated with first antibodies for 1 h and with second antibodies for 45 min, and then ABC was applied for 30 min at room temperature. Finally, bands were detected with Konica HRP‐1000.
Reduced malignant properties in the transfectant cells. To clarify the effects of over‐expression of GM1/GD1b/GA1 synthase on cancer properties, MTT assay and invasion assay were performed. As shown in Figure 3(a), MTT assay showed that M1‐5 and M1‐6 grew more slowly than the control C3 and the parent cell line. The invasion assay revealed that M1‐5 and M1‐6 had much lower invasion activity than the controls (Fig. 3b). These results indicated that expression of GM1/GD1b/GA1 synthase gene caused reduction of malignant properties in SK‐MEL‐37. To examine changes in tyrosine‐phosphorylation patterns of proteins in the transfectant cells, immunoblotting was performed using cell lysates prepared from M1‐6 and C‐3 treated with FCS after serum starvation for 12 h. As shown in Figure 3(c), two bands at 115–130 kDa and one band at ca 68 kDa were detected with stronger increase in C‐3. Bands at 130 kDa and those at 68 kDa seemed to be p130Cas plus focal adhesion kinase (FAK) and paxillin, respectively from our previous study (7). Since a band at 115 kDa (indicated by x) was suspected to be PYK2, IP/IB analysis was performed as shown in Figure 3(d). Consequently, it was demonstrated that the band contained, at least partly, PYK2.
Figure 3.
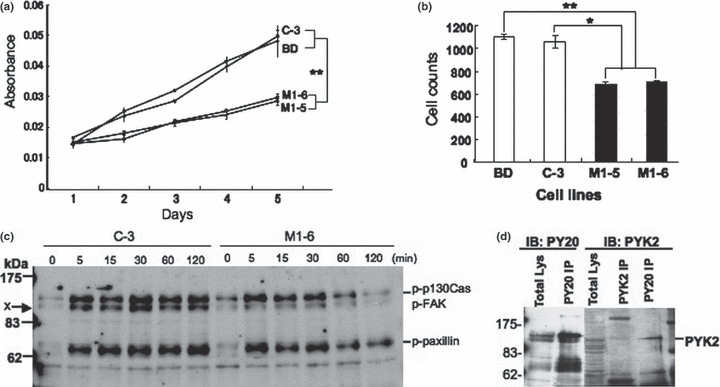
Phenotypic changes in the transfectant cells. (a) 3‐(4,5‐Dimethylthiazol‐2‐yl)‐2,5‐diphenyl tetrazolium bromide (MTT) assay to analyze cell proliferation. Cells (4 × 10³) were seeded in 96‐well plates. On days 1–5 of culture, the MTT assay was performed. Results are presented as absorbance at 590 nm with a reference filter of 620 nm. **P < 0.01. (b) Invasion assay with Boyden chamber. Invasion activity of the transfectants was analyzed by using a Boyden chamber and Matrigel‐coated plates. Numbers of cells on the reverse side of membrane were counted. *P < 0.05, **P < 0.01. (c) Results of immunoblotting with PY20. Time course of the phosphorylation levels in a vector control (C‐3) and a transfectant (M1‐6) were observed. Cells (2 × 10⁵) were treated with FCS after serum starvation for 12 h, and the phosphorylation levels were observed up to 120 min after addition of FCS. Three tyrosine‐phosphorylated bands appeared at approximate molecular masses of 130, 115, and 68 kDa. (d) Immunoblotting for immunoprecipitates with either PY20 or anti‐proline‐rich tyrosine kinase (PYK) together with total lysates using anti‐PYK2 (right). Immunoblotting of immunoprecipitates with PY20 by PY20 was also performed (left).
Intracellular localization of gangliosides in the transfectants and the controls. Cell lysates with Triton X‐100 were fractionated with sucrose density gradient ultracentrifugation, and intracellular localization of individual gangliosides was analyzed by immunoblotting. As shown in Figure 4(a), caveolin‐1 and flotillin‐1 were found in fraction 2–4, GEM/raft fraction, in all cell lines. The majority of GM1 was also detected in GEM/raft fraction in all cell lines. Other gangliosides, that is GM3, GM2, GD2, GD1b, and GT1b, were also detected mainly in fraction 2–4 in both of two cell types. On the other hand, GD3 tended to disperse from GEM/raft to non‐GEM/raft fraction in the transfectant cells (M1‐5, M1‐6), while GD3 in the controls mainly resided in the raft fraction. This finding was clearly shown by measuring the band intensities (Fig. 4b). GD1b and GT1b slightly showed similar tendencies, although not as much as GD3.
Figure 4.
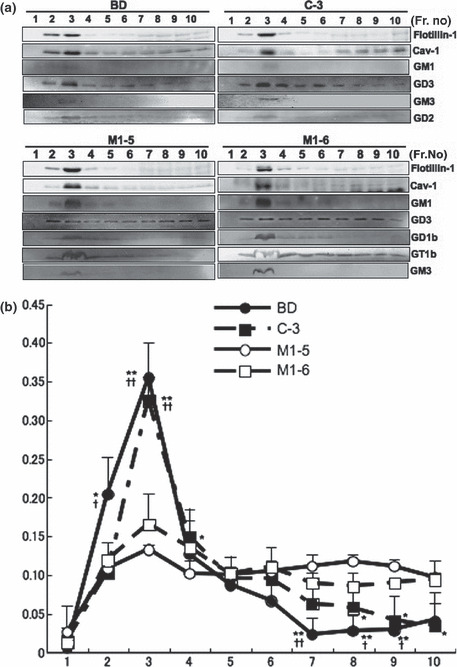
Alteration in the floatation pattern of gangliosides in sucrose density gradient fractionation. (a) Distribution patterns of major gangliosides in SK‐MEL‐37, a vector control, and two transfectant lines were examined. Triton X‐100 extracts were fractionated by sucrose density gradient ultracentrifugation, and fractions were used for immunoblotting. GM1 was detected with biotinated‐CTx‐B subunit. Other gangliosides were detected with individual mAbs. Cav‐1, caveolin‐1. (b) Band intensities of GD3 in (a) were measured by a scanner and plotted on a graph as ratios of individual bands in total band intensities. *P < 0.05 for either BD or C‐3 against M1‐5; **P < 0.01 for either BD or C‐3 against M1‐5; †P < 0.05 for either BD or C‐3 against M1‐6; ††P < 0.01 for either BD or C‐3 against M1‐6.
Multiple reaction monitoring (MRM) analysis of ganglioside species in GEM/raft and non‐GEM/raft fractions. Multiple reaction monitoring (MRM) analysis was performed for gangliosides in GEM/raft fraction (Fr. 2–4) and non‐GEM/raft fraction (Fr. 6–10) of two cell types (Fig. 5). From MRM overlay chromatograms of gangliosides, gangliosides with C24 acyl carbon chains, especially GM3 and GD3, were dominantly found in GEM/raft fraction and non‐GEM/raft fraction. Some of the gangliosides were eluted earlier and considered to be unsaturated types with C24 acyl carbon chains. The ratios of the saturated types to unsaturated types were increased in GEM/raft fraction as compared with non‐GEM/raft fraction in the transfectant cells. In GEM/raft and non‐GEM/raft samples of the controls, similar differences were shown as in the GM1 synthase‐transfectant cells.
Figure 5.
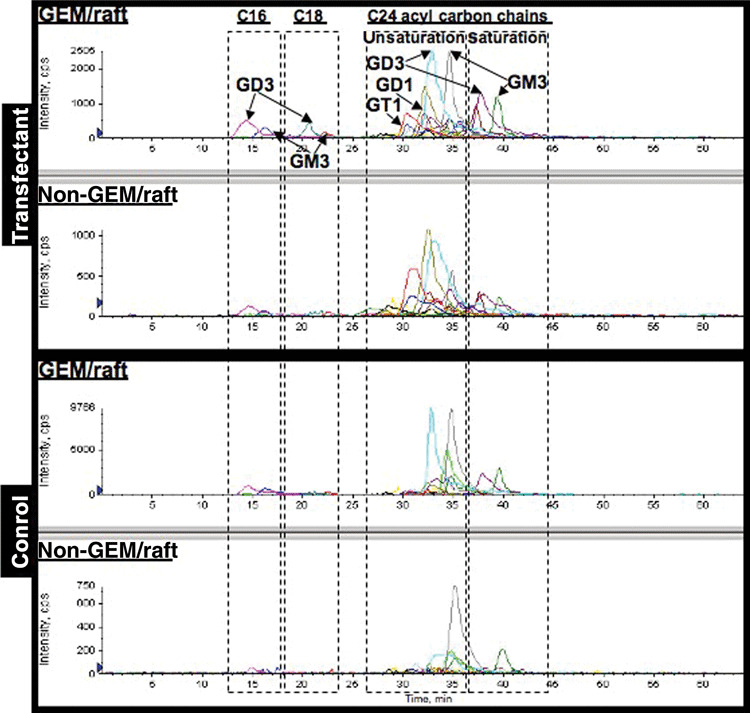
Ganglioside distribution in glycolipid‐enriched microdomain (GEM)/raft and non‐GEM/raft fractions by multiple reaction monitoring (MRM) analysis. Gangliosides were extracted from GEM/raft (2–4) and non‐GEM/raft (6–10) fractions from C‐3 and a transfectant line. Molecular species of gangliosides were analyzed by reverse‐phase LC/ESI‐MS with MRM detection as described in the Materials and Methods and MRM chromatograms of gangliosides were overlaid.
Differences in the ceramide structures of GM3 and GD3 present in GEM/rafts and non‐GEM/rafts. In order to confirm structures of GM3 and GD3 with C24 acyl carbon chains, MS2 analysis of GM3 (m/z 1265, 1263 and 1261) and GD3 (m/z 1556, 1554 and 1552) were performed in positive ion mode and individual ceramide ions ([Cer‐H2O+H]+: m/z 632, 630, and 628) were detected. For further analysis of these ceramide structures, long‐chain base (LCB) related fragments ([LCB‐H2O+H]+) specific to individual sphingosine molecular species were identified by MS3 analysis, and d18:1 sphingenine (m/z 264) or d18:2 sphingadienine (m/z 262) were detected. From these results, it was revealed that GM3 (d18:1‐24:0) and GM3 (d18:1‐24:1) were individually identified from the precursor ions (m/z 1265 and 1263), whereas both GM3 (d18:1‐24:2) and GM3 (d18:2‐24:1) were revealed to coexist in the precursor ions (m/z 1261) (Fig. 6, left). Similarly, GD3 (d18:1‐24:0), GD3 (d18:1‐24:1), and GD3 (d18:1‐24:2/d18:2‐24:1) were identified from the precursor ion (m/z 1556, 1554, and 1552), respectively (Fig. 6, right).
Figure 6.
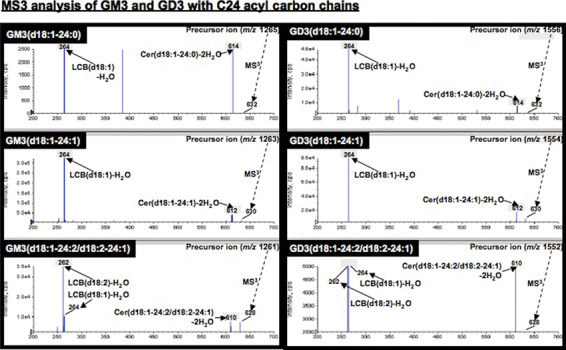
Structural determination of ceramide portions in GM3 and GD3 by MS3 analysis. For identification of GM3 and GD3 molecular species, MS3 analysis of individual ceramide molecular species derived from MS2 analysis of GM3 and GD3 were investigated. Long‐chain base (LCB) was used for the identification of each sphingosine structure.
Altered ratios of ganglioside molecular species in GEM/rafts of the transfectant cells. Individual MRM overlay chromatograms of GM3 and GD3 with C24 acyl carbon chains revealed that these GM3 and GD3 composed of d18:1‐24:0, d18:1‐24:1, and d18:1‐24:2/d18:2‐24:1 types, in particular d18:1‐24:1 types, were most abundantly found in both GEM/rafts and non‐GEM/rafts (Fig. 7). In addition to GM3 and GD3, GM2, GD1, and GT1 (GD1 and GT1 seemed to be GD1b and GT1b based on the biochemical data. But they are written here as GD1 and GT1, since their isoforms were potentially co‐detected by MRM analysis) with similar ceramide compositions were detected in the two cell types (data not shown). Some additional peaks (asterisks in Fig. 7) detected by MRM analysis of GM3 (d18:1‐24:0) and GD3 (d18:1‐24:0 and d18:1‐24:2/d18:2‐24:1) were individually derived from isotope peaks of GM3 (d18:1‐24:1) and GD3 (d18:1‐24:1).
Figure 7.
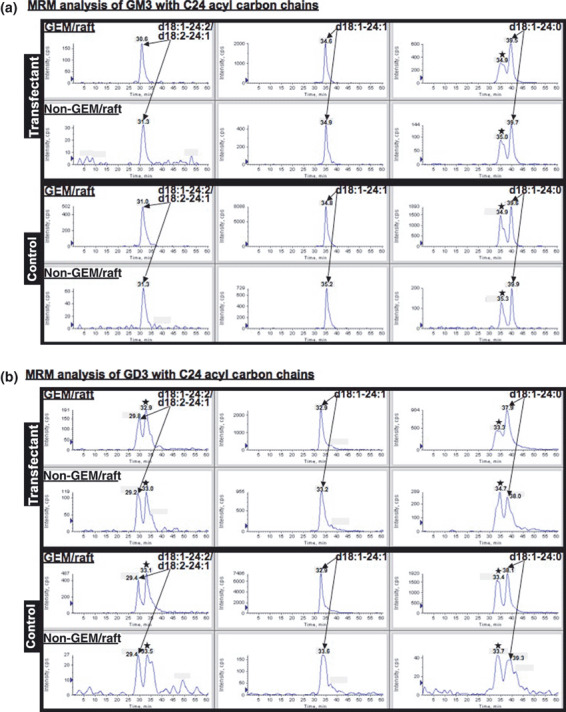
Multiple reaction monitoring (MRM) chromatograms of GM3 (a) and GD3 (b) in the glycolipid‐enriched microdomain (GEM)/raft and non‐GEM/raft fractions. Individual MRM overlay chromatograms of GM3 and GD3 with C24 acyl carbon chains were analyzed and these peak areas were calculated for quantitative determinations. GM3 and GD3 were composed of d18:1‐24:0, d18:1‐24:1, and d18:1‐24:2/d18:2‐24:1 types in both GEM/rafts and non‐GEM/rafts.
The ratios of gangliosides having C24 acyl chains with different structures in GEM/rafts and non‐GEM/rafts are shown in Figure 8. In GEM/rafts of the transfectant and control cells, ratios of the saturated form such as d18:1‐24‐0 were increased and those of highly unsaturated forms such as d18:1‐24:2/d18:2‐24:1 were decreased mainly in GD3, GD1, and GT1. On the other hand, these ratios in GM3 remained unchanged. This indicates that different localization of gangliosides molecular species seems to be correlated to the size of carbohydrate moiety. Furthermore, increased ratios of the saturated form were detected in GEM/rafts of transfectant cells when compared with the controls.
Figure 8.
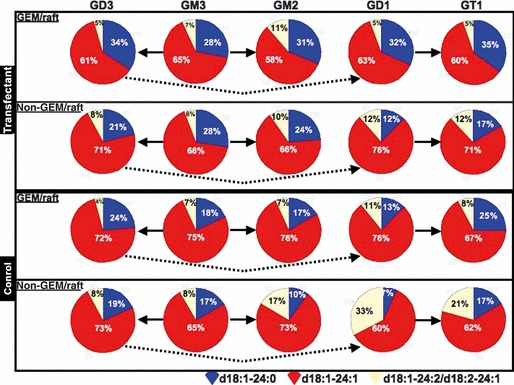
Ratios of ganglioside molecular species in glycolipid‐enriched microdomain (GEM)/raft and non‐GEM/raft fractions of two cell types. Ratios of ganglioside molecular species. Peak areas of individual ganglisoide molecular species with C24 acyl carbon chains were calculated and the ratios of them in each ganglioside class were compared with GEM/raft and non‐GEM/raft fractions of two cell types. GD1 and GT1 actually mean GD1b and GT1b, respectively.
Altered distributions of gangliosides in the transfectant cells. Absolute values of gangliosides with C24 acyl carbon chains were shown as measured by peak areas (Fig. S1). As observed in TLC and immunoblotting of sucrose density fractions, the majority of gangliosides were present in GEM/rafts of the control cells, while those in the transfectant cells, particularly GD3, GD1, and GT1, were found not only in GEM/rafts but also in non‐GEM/raft fractions. This tendency of diffuse localization in the transfectant cells was correlated to the size of carbohydrate moiety.
Discussion
Gangliosides have been studied as tumor markers mainly in the neuroectoderm‐derived cancers.( 18 , 19 ) They are also expressed in T‐cell acute lymphoblastic leukemia cells( 20 , 21 , 22 ) or adult T‐cell leukemia cells.( 23 ) Recent progress in the molecular cloning of glycosyltransferase cDNAs has allowed us to experimentally clarify roles of gangliosides in cellular phenotypes.( 24 ) In particular, GD3 and GD3 synthase have been intensively analyzed in terms of roles in human cancers.( 7 , 14 ) On the other hand, GM1, a representative monosialyl‐ganglioside, has been used as a marker of the membrane microdomains such as GEM/rafts or DIM.( 25 , 26 ) Primitive questions to be answered then were whether gangliosides other than GM1 reside in GEM/rafts, and whether GM1 plays roles more significant than that of a raft marker.
In this study, we used a malignant melanoma line SK‐MEL‐37 (BD), since this line contained relatively complex composition of gangliosides. After transfection of GM1/GD1b/GA1 synthase cDNA, the transfectant cells expressed high levels of GD1b and GT1b, as well as GM1. These features enabled us to examine the distribution of wide variety of gangliosides in the individual cells. In the results of TLC and immunoblotting of fractions from sucrose density gradient fractionation, it was demonstrated that majority of gangliosides except for GD3 are enriched in GEM/raft fractions. Basically, GD3 has been found in GEM/raft fraction.( 8 ) However, it sometimes showed an intriguing distribution pattern. For example, in SK‐MEL‐28 cells transfected with cDNA of caveolin‐1, GD3 was dispersed to non‐GEM/raft fraction.( 8 ) As a possible mechanism, unsaturated fatty acids were dominantly detected in GD3 present in non‐GEM/raft fraction, while saturated forms were concentrated in GEM/raft fraction. In SK‐MEL‐37 cells transfected with GM1/GD1b/GA1 synthase cDNA, similar differences in the fatty acid structures of GD3 and other b‐series gangliosides between GEM/raft and non‐GEM/raft fractions were demonstrated. For detailed analysis of ganglioside distribution including the fatty acid variations, our MRM system was effective in quantitation of these molecular species and applied to the fractions. As shown in Figure 8, ratios of saturated form as d18:1‐24‐0 were high in GEM/rafts of the transfectant cells. In turn, ratios of unsaturated forms such as d18:1‐24:1 and d18:1‐24:2/d18:2‐24:1 in GEM/rafts of the transfectant cells were lower than those of controls. Increase of the saturated forms in GEM/rafts of the transfectant cells might compensate the highly‐polar nature of gangliosides containing larger carbohydrate moiety. In the transfectant cells, gangliosides were also found dispersively not only in GEM/rafts but also in non‐GEM/raft fractions compared with control cells. These changes were mainly detected in GD3 and newly synthesized gangliosides (GD1 and GT1), and might be a cause for the reduced signaling.
How changes in ganglioside expression patterns can induce changes in the lipid structures of particular gangliosides seems one of the most critical issues to be solved. First of all, it may be possible that preferential substrate usage of glycosyltransferases give rise to underexpression of particular gangliosides in Golgi, leading to the changes in the distribution of the enzyme products inside/outside of GEM/rafts. Second, a regulatory factor such as sterol carrier protein‐2 which binds with various lipids and transfers many lipid species including glycolipids( 27 ) might be involved. In this case, activation mechanisms of the sterol carrier protein with particular gangliosides need to be investigated.
In our laboratory, it has been demonstrated that overexpression of GM1 resulted in the suppression of growth signals in Swiss‐3T3 cells( 11 ) and of differentiation signals in PC12 cells.( 28 ) Furthermore, expression of GM1 brought about reduction of cancer metastasis in mouse Lewis lung cancer.( 12 ) All these results clearly demonstrated that GM1 is implicated in the suppression of tumor phenotypes.
In this study, it was demonstrated that transfection of GM1/GD1b/GA1 synthase cDNA resulted in the neo‐expression of GD1b and GT1b as well as GM1. Therefore, it is not clear which ganglioside is most responsible for the phenotypic changes found in the transfectant cells. Reduced levels of GD3 might be also an important factor in the reduced tumor properties. In particular, changes in the distribution pattern of GD3 might be one of the most significant factors affecting tumor phenotypes.
As signaling molecules involved in the enhanced activation of melanoma properties under GD3 expression, p130Cas, paxillin,( 6 ) and focal adhesion kinase (FAK)( 29 ) have been reported by us. Integrins are also critical to efficiently transduce adhesion signals via interaction with extra cellular matrices.( 30 ) In this study, activation levels of PYK2 were markedly different between the transfectant cells and controls (Fig. 3c), suggesting that expression of GM1/GD1b/GA1 synthase inhibits PYK2 activation. Moreover, reduction of the activation levels in PYK2 was marked when compared with those in p130Cas and paxillin.
Consequently, the expression of GM1/GD1b/GA1 synthase caused changes in ganglioside composition, ganglioside distribution, and their chemical natures, particularly in the ceramide portion, resulting in the aberrant functions of GEM/rafts and suppression of pivotal signaling for the basis of tumor phenotypes in melanoma cells. Precise implications of altered PYK2 activity in the malignant properties of melanomas should be investigated, since its roles were reported to be serious in the metastasis of cancers.( 31 ) These results might shed light on the applicative trials for the molecular targeting therapy of malignant melanomas.
Disclosure Statement
The authors have no conflict of interest.
Supporting information
Fig. S1. Absolute values of gangliosides with C24 acyl carbon chains. Absolute values of individual ganglioside classes were calculated by summation of peak areas of individual ganglisoide molecular species with C24 acyl carbon chains in GEM/raft and non‐GEM/raft fractions of two cell types.
Please note: Wiley‐Blackwell are not responsible for the content or functionality of any supporting materials supplied by the authors. Any queries (other than missing material) should be directed to the corresponding author for the article.
Supporting info item
Supporting info item
Acknowledgments
We thank that Dr K.O. Lloyd at Memorial Sloan‐Kettering Cancer Center (New York) and Dr J. Nakano at Tokuyama Hospital for kindly providing melanoma cell lines. We also thank Ms. Y. Nakayasu and T. Mizuno for technical assistance. This study was supported by Grants‐in‐Aid for Scientific Research and for Scientific Research on Priority Areas from the Japanese Ministry of Education, Culture, Sports and Technology (MEXT), and Grants‐in‐Aid from Core Research for Evolutional Science and Technology, JST. This study was partly supported by the COE Project for Private Universities of MEXT of Japan.
References
- 1. Wiegandt H. Gangliosides. In: Wiegandt H, eds. Glycolipids. New York: Elsevier, 1985; 199–260. [Google Scholar]
- 2. Hakomori S, Igarashi Y. Gangliosides and glycosphingolipids as modulators of cell growth, adhesion, and transmembrane signaling. Adv Lipid Res 1993; 25: 147–62. [PubMed] [Google Scholar]
- 3. Furukawa K, Lloyd KO. Gangliosides in melanoma. In: Ferrone S, ed. Human Melanoma: From Basic Research to Clinical Application. Heidelberg: Springer, 1990; 15–30. [Google Scholar]
- 4. Furukawa K, Arita Y, Satomi N, Eisinger M, Lloyd KO. Tumor necrosis factor enhances GD3 ganglioside expression in cultured human melanocytes. Arch Biochem Biophys 1990; 281: 70–5. [DOI] [PubMed] [Google Scholar]
- 5. Houghton AN, Mintzer D, Cordon‐Cardo C et al. Mouse monoclonal IgG3 antibody detecting GD3 ganglioside: a phase I trial in patients with malignant melanoma. Proc Natl Acad Sci USA 1985; 82: 1242–6. [DOI] [PMC free article] [PubMed] [Google Scholar]
- 6. Forero A, Shah J, Carlisle R et al. A phase I study of an anti‐GD3 monoclonal antibody, KW‐2871, in patients with metastatic melanoma. Cancer Biother Radiopharm 2006; 21: 561–8. [DOI] [PubMed] [Google Scholar]
- 7. Hamamura K, Furukawa K, Hayashi T et al. Ganglioside GD3 promotes cell growth and invasion through p130Cas and paxillin in malignant melanoma cells. Proc Natl Acad Sci USA 2005; 102: 11041–6. [DOI] [PMC free article] [PubMed] [Google Scholar]
- 8. Nakashima H, Hamamura K, Houjou T et al. Overexpression of caveolin‐1 in a human melanoma cell line results in dispersion of ganglioside GD3 from lipid rafts and alteration of leading edges, leading to attenuation of malignant properties. Cancer Sci 2007; 98: 512–20. [DOI] [PMC free article] [PubMed] [Google Scholar]
- 9. Simons K, Ikonen E. Functional rafts in cell membranes. Nature 1997; 387: 569–72. [DOI] [PubMed] [Google Scholar]
- 10. Miyazaki H, Furukawa K, Fukumoto S, Okada M, Hasegawa T, Furukawa K. Expression Cloning of Rat cDNA Encoding UDP‐galactose: GD2 b1,3‐galactosyl‐transferase That Determines the Expression of GD1b/GM1/GA1. J Biol Chem 1997; 272: 24794–9. [DOI] [PubMed] [Google Scholar]
- 11. Mitsuda T, Furukawa K, Fukumoto S, Miyazaki H, Urano T, Furukawa K. Overexpression of ganglioside GM1 results in the dispersion of platelet‐derived growth factor receptor from glycolipid‐enriched micro‐domains and in the suppression of cell growth signals. J Biol Chem 2002; 277: 11239–46. [DOI] [PubMed] [Google Scholar]
- 12. Zhang Q, Furukawa K, Chen HH, Sakakibara T, Urano T, Furukawa K. Metastatic potential of mouse Lewis lung cancer cells is regulated via ganglioside GM1 by modulating the matrix metalloprotease‐9 localization in lipid rafts. J Biol Chem 2006; 281: 18145–55. [DOI] [PubMed] [Google Scholar]
- 13. Zhao J, Furukawa K, Fukumoto S et al. Attenuation of interleukin 2 signal in the spleen cells of complex ganglioside‐lacking mice. J Biol Chem 1999; 274: 13744–7. [DOI] [PubMed] [Google Scholar]
- 14. Yoshida S, Fukumoto S, Kawaguchi H, Sato S, Ueda R, Furukawa K. Ganglioside G(D2) in small cell lung cancer cell lines: enhancement of cell proliferation and mediation of apoptosis. Cancer Res 2001; 61: 4244–52. [PubMed] [Google Scholar]
- 15. Furukawa K, Clausen H, Hakomori S et al. Analysis of the specificity of five murine anti‐blood group A monoclonal antibodies, including one that identifies type 3 and type 4 A determinants. Biochemistry 1985; 24: 7820–6. [DOI] [PubMed] [Google Scholar]
- 16. Ikeda K, Shimizu T, Taguchi R. Targeted analysis of ganglioside and sulfatide molecular species by LC/ESI‐MS/MS with theoretically expanded multiple reaction monitoring. J Lipid Res 2008; 49: 2678–89. [DOI] [PubMed] [Google Scholar]
- 17. Byrdwell WC, Perry RH. Liquid chromatography with dual parallel mass spectrometry and 31P nuclear magnetic resonance spectroscopy for analysis of sphingomyelin and dihydrosphingomyelin. II. Bovine milk sphingolipids. J Chromatogr A 2007; 1146: 164–85. [DOI] [PubMed] [Google Scholar]
- 18. Pukel CS, Lloyd KO, Travassos LR, Dippold WG, Oettgen HF, Old LJ. GD3, a prominent ganglioside of human melanoma. Detection and characterisation by mouse monoclonal antibody. J Exp Med 1982; 155: 1133–47. [DOI] [PMC free article] [PubMed] [Google Scholar]
- 19. Saito M, Yu RK, Cheung NK. Ganglioside GD2 specificity of mono‐clonal antibodies to human neuroblastoma cell. Biochem Biophys Res Commun 1985; 127: 1–7. [DOI] [PubMed] [Google Scholar]
- 20. Siddiqui B, Buehler J, DeGregorio MW, Macher BA. Differential expression of ganglioside GD3 by human leukocytes and leukemia cells. Cancer Res 1984; 44: 5262–5. [PubMed] [Google Scholar]
- 21. Merritt WD, Casper JT, Lauer SJ, Reaman GH. Expression of GD3 ganglioside in childhood T‐cell lymphoblastic malignancies. Cancer Res 1987; 47: 1724–30. [PubMed] [Google Scholar]
- 22. Okada M, Itoh Mi M, Haraguchi M et al. b‐series ganglioside deficiency exhibits no definite changes in the neurogenesis and the sensitivity to Fas‐mediated apoptosis, but impairs regeneration of the lesioned hypoglossal nerve. J Biol Chem 2002; 277: 1633–6. [DOI] [PubMed] [Google Scholar]
- 23. Furukawa K, Akagi T, Nagata Y et al. GD2 ganglioside on human T‐lymphotropic virus type I‐infected T cells: possible activation of β‐1,4‐N‐acetylgalactosaminyltransferase gene by p40tax. Proc Natl Acad Sci USA 1993; 90: 1972–6. [DOI] [PMC free article] [PubMed] [Google Scholar]
- 24. Furukawa K, Tsuchida A, Okajima T, Furukawa K. Glycoconjugate glycosyltransferases. Glycoconj J 2009; 26: 987–98. [DOI] [PubMed] [Google Scholar]
- 25. Hullin‐Matsuda F, Kobayashi T. Monitoring the distribution and dynamics of signaling microdomains in living cells with lipid‐specific probes. Cell Mol Life Sci 2007; 64: 2492–504. [DOI] [PMC free article] [PubMed] [Google Scholar]
- 26. Lencer WI, Hirst TR, Holmes RK. Membrane traffic and the cellular uptake of cholera toxin. Biochim Biophys Acta 1999; 1450: 177–90. [DOI] [PubMed] [Google Scholar]
- 27. Schroeder F, Atshaves BP, McIntosh AL et al. Sterol carrier protein‐2: new roles in regulating lipid rafts and signaling. Biochim Biophys Acta 2007; 1771: 700–18. [DOI] [PMC free article] [PubMed] [Google Scholar]
- 28. Nishio M, Fukumoto S, Furukawa K et al. Over‐expressed GM1 suppresses NGF signals by modulating the intra‐cellular localization of NGF receptors and membrane fluidity in PC12 cells. J Biol Chem 2004; 279: 33368–78. [DOI] [PubMed] [Google Scholar]
- 29. Hamamura K, Tsuji M, Ohkawa Y et al. Focal adhesion kinase as well as p130Cas and paxillin is crucially involved in the enhanced malignant properties under expression of ganglioside GD3 in melanoma cells. Biochim Biophys Acta 2008; 1780: 513–19. [DOI] [PubMed] [Google Scholar]
- 30. Ohkawa Y, Miyazaki S, Miyata M, Hamamura K, Furukawa K, Furukawa K. Essential roles of integrin‐mediated signaling for the enhancement of malignant properties of melanomas based on the expression of GD3. Biochem Biophys Res Commun 2008; 373: 14–19. [DOI] [PubMed] [Google Scholar]
- 31. Teti A, Migliaccio S, Baron R. The role of the alphaVbeta3 integrin in the development of osteolytic bone metastases: a pharmacological target for alternative therapy? Calcif Tissue Int 2002; 71: 293–9. [DOI] [PubMed] [Google Scholar]
Associated Data
This section collects any data citations, data availability statements, or supplementary materials included in this article.
Supplementary Materials
Fig. S1. Absolute values of gangliosides with C24 acyl carbon chains. Absolute values of individual ganglioside classes were calculated by summation of peak areas of individual ganglisoide molecular species with C24 acyl carbon chains in GEM/raft and non‐GEM/raft fractions of two cell types.
Please note: Wiley‐Blackwell are not responsible for the content or functionality of any supporting materials supplied by the authors. Any queries (other than missing material) should be directed to the corresponding author for the article.
Supporting info item
Supporting info item


