

Abstract
Lysophosphatidic acid (LPA) may enhance diverse biologic activities in prostate cancer. This study was conducted to analyze expression levels of LPA‐producing enzymes, autotaxin (ATX) and acylglycerol kinase (AGK), in prostate cancer with relevance to clinicopathological parameters. Real‐time RT‐PCR and western blotting were performed for ATX and AGK in non‐neoplastic prostate cells (PrECs and PrSCs) and prostate cancer cell‐lines (DU‐145, PC‐3, LNCaP, and AILNCaP). Immunohistochemical analyses were conducted in tissue specimens of 132 localized prostate cancer patients who underwent radical prostatectomy between 2001 and 2007 (median observation period, 22 months). Both enzymes were negatively expressed in PrECs and PrSCs at mRNA and protein levels. ATX expression was higher than AGK in AILNCaP, DU‐145, and PC‐3 cell‐lines, while AGK was mainly expressed in LNCaP cells. Immunohistochemically, ATX and AGK expressions were negative in non‐neoplastic epithelia, while both were weakly expressed in the majority of high‐grade intra‐epithelial neoplasia (HG‐PIN). In cancer foci, ATX and AGK expressions were strong in 49% and 62%, weak in 40% and 32%, and negative in 11% and 6%, respectively. Expressions of both enzymes were significantly correlated with primary Gleason grade of cancer foci (P < 0.0001) and capsular invasion (P = 0.03 and 0.003 respectively). ATX expression was significantly correlated with probability of prostate specific antigen (PSA)‐failure after surgery (P < 0.0001). In conclusion, LPA‐producing enzymes (ATX and AGK) were frequently expressed in prostate cancer cells and precancerous HG‐PIN. In particular, high expression levels of ATX were associated with both malignant potentials and poor outcomes. (Cancer Sci 2009; 100: 1631–1638)
Lysophosphatidic acid (1‐ or 2‐acyl‐lysophosphatidic acid; LPA) is an extracellular bioactive phospholipid that mediates diverse biological activities including platelet aggregation, smooth muscle contraction, cancer cell proliferation, invasion, angiogenesis, and cytoskeletal reorganization.( 1 , 2 ) This action is mediated by several interactive mechanisms: (a) It activates RhoA and NF‐κβ genes inducing prostate cancer progression.( 3 , 4 ) (b) It enhances SRE activity in promoters of immediate early growth‐related genes.( 5 ) (c) It stimulates secretion of polypeptide growth factors such as EGF (epidermal growth factor) and sensitizes cells to their growth promoting effects.( 6 , 7 ) (d) Finally, LPA suppresses apoptosis of cancer cells by reducing levels of apoptosis‐promoting proteins.( 8 , 9 )
We previously examined LPA activity in various biologic fluids and found a high LPA activity exerted by a specific type of its receptors (Edg‐7/LPA3) in human seminal fluids.( 10 ) Furthermore, addition of 18:1 LPA (oleoyl‐LPA) to prostate epithelial and stromal cells resulted in up‐regulation of a novel extracellular matrix signaling protein CYR‐61, that has a growth stimulating potential.( 11 )
Several routes are proposed for LPA production. It is produced extracellularly by lipoprotein oxidation through the action of secretory phospholipase A2 on microvesicles released from activated cells.( 12 ) In plasma, it is produced by thrombin‐activated platelets through the stimulated release of phospholipase‐A1 and A2( 13 ) and lysophospholipase D (LysoPLD).( 14 , 15 ) LysoPLD is identical to autotaxin (nucleotide pyrophosphatase phosphodiesterase‐2; ATX/NPP2, EC 3.1.1.5), a cell motility‐stimulating factor originally identified in the culture cell supernatant of malignant melanoma cells.( 16 , 17 ) We previously found that human seminal fluids contain a large amount of ATX, which hydrolyses lysophosphatidylcholine to produce LPA.( 18 ) While LPA signaling had been extensively investigated over the past decade, researchers are now beginning to appreciate the properties and biological activities of ATX as the major LPA‐producing phospholipase.( 19 ) ATX is a secreted protein that acts outside the cell to produce LPA. It was recently suggested that ATX activity increases LPA production which is believed to promote prostate cancer development and progression via a pro‐inflammatory milieu.( 20 ) Another potential pathway for LPA synthesis is phosphorylation of monoacylglycerols by a specific lipid kinase, AGK (EC 2.7.1.94).( 1 , 21 ) Regarding LPA metabolism, we carried out biochemical characterization of ejaculate from healthy males and found that PAP, a legend clinical marker for prostate cancer, is responsible for degrading LPA.( 22 )
These findings have prompted us to investigate the expression levels of LPA‐producing enzymes, ATX and AGK, in prostate cancers and their association with different clinical behaviors and outcomes. In this study, expressions of ATX and AGK in prostate cancer cell‐lines were analyzed at both mRNA and protein levels with a special relevance to androgen‐sensitivity. Furthermore, surgical specimens were examined for ATX and AGK protein expressions in cancer foci, HG‐PIN, and non‐neoplastic glands to clarify the relationship of ATX and AGK expressions to clinicopathological features of prostate cancer.
Materials and Methods
Cell lines. Prostate epithelial (PrECs) and stromal (PrSCs) cells were purchased from Bio Whittaker (Walkersville, MD, USA) and maintained in the specific basal media according to the manufacturer's recommendation. Human prostate cancer cell‐lines DU‐145, PC‐3 and LNCaP were purchased from the American Type Culture Collection (Rockville, MD, USA) and were maintained in RPMI‐1640 plus 10% FCS (Life Technologies, NY, USA). Androgen‐insensitive LNCaP subline (AILNCaP) was proliferated in androgen‐depleted medium after emerging from long‐term androgen‐depleted cultures of the androgen‐sensitive LNCaP cells as previously described.( 23 )
Patients and specimens. Whole prostate specimens were obtained from 132 patients with localized prostate cancer (cT1c‐2bN0M0, International Union Against Cancer [UICC] 1997) who underwent radical prostatectomy at Kagawa University Hospital during the period between January 2001 and December 2007 (median observation period, 22 months). The patients’ characteristics are shown in Table 1. None of our patients received preoperative or adjuvant hormonal ablation therapy, chemotherapy, or radiotherapy until PSA‐failure was confirmed. Written informed consent was obtained from all participants. This study complies with the Declaration of Helsinki in 1995 (as revised in Tokyo, 2004) and was approved by the institutional ethical committee.
Table 1.
Patients’ clinicopathological characteristics
| Characteristics | Study cohort (n = 132) |
|---|---|
| Follow‐up (months) | |
| Mean | 26.2 |
| Median | 22 |
| Age (years) | |
| <60 | 10 (7.6%) |
| 60–70 | 53 (40.2%) |
| >70 | 69 (52.2%) |
| Pretreatment PSA (ng/mL) | |
| <4 | 2 (1.5%) |
| 4–10 | 61 (46.2%) |
| 10–20 | 53 (40.2%) |
| >20 | 16 (12.1%) |
| Pathological stage (TNM 1997) | |
| ≤pT2a | 17 (12.8%) |
| pT2b | 59 (44.7%) |
| pT3a | 37 (28.0%) |
| ≥pT3b | 19 (14.5%) |
| Pathological Gleason score | |
| ≤3 + 3 | 13 (9.8%) |
| 3 + 4 | 39 (29.5%) |
| 4 + 3 | 36 (27.3%) |
| ≥4 + 4 | 44 (33.4%) |
| Surgical margin | |
| Negative | 88 (66.7%) |
| Positive | 44 (33.3%) |
PSA, prostate‐specific antigen.
RNA extraction and real‐time RT‐PCR. To elucidate ATX and AGK gene expression profiles in prostate cancer cell‐lines, RNA was isolated using RNAqueous‐Micro RNA Isolation Kit (Ambion, Austin, TX, USA) following the manufacturer's recommendations. RNA samples were treated with DNase using the Invitrogen DNase I (Invitrogen, Carlsbad, CA, USA), and cDNA was synthesized as described elsewhere.( 24 ) AGK forward and reverse primers have been described elsewhere.( 1 ) ATX amplification primers were as follows: forward, GGGTGAAAGCTGGAACA TTCTT; reverse, GAAGGCCTCTCATGATCTGG. Real‐time RT‐PCR was conducted on a LightCycler system (Roche Diagnostics, Indianapolis, IN, USA). Reaction mixture in 20 µL was amplified for 40 cycles using: 95°C for 10 s, 65–67°C for 10 s, and 72°C for 15 s. The housekeeping gene glyceraldehyde‐3‐phosphate dehydrogenase (GAPDH) was determined with a ready‐to‐use LightCycler‐h‐GAPDH housekeeping gene set (Roche Applied Science, Indianapolis, IN, USA) to confirm integrity. Fluorescence data were analyzed with reference to the standard curve in each experiment. A melting curve analysis was always included to certify amplification. Target gene expression was referred to GAPDH mRNA for normalization. All tests were conducted in triplicate to ensure reproducibility. The specificity of desired products in real‐time RT‐PCR was also confirmed by conventional RT‐PCR using the same primer pairs as previously described.( 25 )
Antibodies. Anti‐ATX rat monoclonal antibody (clone 4F1) was established in the laboratory of the Graduate School of Pharmaceutical Sciences, University of Tokyo, as previously described.( 22 ) Anti‐AGK rabbit polyclonal antibody (OB0680) was newly developed at MBL (Nagoya, Japan) from sera of rabbits immunized with a synthetic peptide. The amino acid sequence of that peptide is CDPRKREQMLTSPTQ, corresponding to codon 408 to 422 of the C‐terminal region of AGK. The specificity of OB0680 was confirmed by a blocking experiment in which immunostaining was carried out for representative specimens using either a mixture solution of the synthetic peptide described above and OB0680 or OB0680 alone as the primary antibody. The positive staining in cancer foci reacted with OB0680 alone disappeared when a mixture solution was used as the primary antibody.
H2O2‐streptavidin biotinylated antirat IgG (for ATX) or antirabbit IgG (for AGK) were used as secondary antibodies (Dako, Glostrup, Denmark).
Protein extraction and western blot analyses. At the exponential growing phase, PrECs and PrSCs, as well as DU‐145, PC‐3, and LNCaP cells, were lysed and protein extracts were prepared. Cell proteins were electrophoretically separated and transferred to PVDF membranes (Immobilon; Daiichi Pure Chemicals, Tokyo, Japan). Proteins were analyzed with 1:1000 dilutions of anti‐ATX or anti‐AGK antibodies. Secondary antibodies were then added and horseradish peroxidase (HRP)–conjugated streptavidin (American Pharmacia, Piscataway, NJ, USA) was used in conjunction with an ECL chemiluminescence detection system (Amersham Pharmacia Biotech, Uppsala, Sweden) for assessing protein expression. To control for protein loading, membranes were re‐probed with mouse monoclonal β‐actin antibodies (AC‐15, ab6276‐100; Abcam, Cambridge, MA, USA).
Tissue preparation and immunostaining. Surgical specimens were immediately fixed in 10% buffered neutral formalin and embedded in paraffin. Five microgram–thick sections were prepared from tissue blocks and subjected to hematoxylin–eosin staining. The overall Gleason score and the primary Gleason grade of major cancer foci in each tumor were determined by the institutional pathologist (R.H.). Sections harboring major cancer foci were selected for further ATX and AGK immunostaining using the standard immunoperoxidase immunohistochemistry as previously described.( 26 ) Briefly, after deparaffinization with xylene and rehydration with graded ethanol, antigen retrieval was accomplished using 10‐mM sodium citrate buffer (pH 6) being heated in a microwave at 500 W. Endogenous avidin and biotin were suppressed using an avidin/biotin blocking agent (Nichirei, Tokyo, Japan). Non‐specific protein interactions were blocked by incubation with 1–2% blocking serum (normal rabbit serum in PBS; Vector Laboratories, Burlingame, CA, USA). Sections were incubated overnight at 4°C with 1:40 dilution of anti‐ATX antibody or 1:1000 dilution of anti‐AGK antibody. The bound antibodies were visualized by the streptavidin–biotin method including HRP and diaminobenzidine (DAB) chromogen according to manufacturer's instructions (ABC kit; Vector Laboratories).
Assessment of staining intensity. Prior to this study, immunohistochemistry for ATX and AGK was carried out as a preliminary setting using tissue specimens obtained from 20 randomly selected radical prostatectomy patients. This preliminary immunostaining revealed that both ATX and AGK were negative in non‐neoplastic glands and stroma without exception, whereas HG‐PIN lesions were usually positive for both enzymes although the staining intensity was weak. In contrast, ATX and AGK were strongly positive in cancer foci in several different prostate specimens. As an inter‐experimental validation, one representative specimen was selected from the preliminary study for assessment of ATX and AGK expression as a referring control. These reference specimens consisted of cancer foci with strong protein expression, high‐grade PIN lesions with weak expression, and normal glands with negative staining. Assessment of staining intensity was carried out only when immunostaining of the reference specimens showed comparable results. Based on the above mentioned parameters, we determined the grade of staining intensity in the present study as follows: grade 0 was completely negative (similar to non‐neoplastic glands); grade 1 was weakly positive (similar to the majority of HG‐PIN lesions); and grade 2 was of a staining intensity much stronger than that of HG‐PIN with positive expression.
Statistical analysis. All statistics were performed with the Statistical Package for Social Sciences software, version 16 (SPSS, Chicago, IL, USA). The statistical results are reproducible and differences found are not due to random variation. Clinicopathological parameters were compared by χ2 analysis and Fischer's exact test. Postoperative PSA‐failure‐free survival was determined using the Kaplan–Meier method and the log‐rank test was used to compare the resultant curves. PSA failure was defined as a PSA level at or above 0.2 ng/mL following surgery.( 27 ) For examining the relationship between ATX and AGK expression level and the pathological T‐stage, our patients were classified into two groups: (T2b or less) and (T3a or more) according to the 1997 TNM staging system. For multivariate analyses, the Cox proportional hazards model was used. Statistical significance of differences was set at P < 0.05.
Results
Autotaxin (ATX) and AGK expressions in prostate cancer cells. Expression profiles of LPA‐producing enzymes ATX and AGK were quite different between androgen‐insensitive DU‐145, PC‐3, and AILNCaP (the androgen‐insensitive subline of LNCaP) cells and androgen‐sensitive LNCaP cells at both mRNA and protein levels (Fig. 1). Quantitative assessment of ATX mRNA in prostate cancer cell lines is shown in Figure 1a. ATX mRNA level in DU‐145 was much higher than LNCaP (P = 0.0027) and higher than PC‐3 cells (P = 0.0028), which was comparable to protein expression levels confirmed by western blotting (Fig. 1b). Moreover, the ATX mRNA level in AILNCaP cells was significantly higher than that in parental LNCaP cells (P = 0.0028). On the other hand, the AGK mRNA level (Fig. 1c) in LNCaP cells was significantly higher than that of PC‐3 and DU‐145 (P < 0.0001 and P = 0.0005 respectively), which was comparable in western blot analyses (Fig. 1d). The AGK mRNA level was significantly lower in AILNCaP cells as compared with its parental LNCaP cells (P = 0.0167). On the other hand, protein expression levels of both enzymes in non‐neoplastic cells (PrECs and PrSCs) were very weak or negative.
Figure 1.

Expression profile of lysophosphatidic acid (LPA)‐producing enzymes autotaxin (ATX) and acylglycerol kinase (AGK), both at mRNA (real‐time RT‐PCR relative to GAPDH) and protein (western blot analysis relative to β‐actin) levels in non‐neoplastic prostate cells (PrECs, PrSCs) and prostate cancer cell lines. (a) ATX mRNA level is significantly higher in androgen‐insensitive prostate cancer cell lines (DU‐145, AILNCaP, and PC‐3) than in the androgen‐sensitive LNCaP cells. (b) ATX protein expression is significantly higher in androgen‐insensitive prostate cancer cell lines (DU‐145 and PC‐3) than in the androgen‐sensitive LNCaP cells, while it is very weakly expressed in non‐neoplastic cells (PrECs, PrSCs). (c) AGK mRNA level is significantly higher in the androgen‐sensitive LNCaP cells than in androgen‐insensitive prostate cancer cell lines (DU‐145, AILNCaP, and PC‐3). (d) AGK protein expression is significantly higher in the androgen‐sensitive LNCaP cells than in androgen‐insensitive prostate cancer cell lines (DU‐145 and PC‐3), while it is negative or very weakly expressed in non‐neoplastic cells (PrECs, PrSCs). Error bars represent the SEM for data from four experiments.
Autotaxin (ATX) and AGK protein expressions in prostate cancer tissue specimens. In benign glands and their surrounding stroma, both ATX and AGK were immunohistochemically negative for all specimens examined (2, 3). HG‐PIN lesions were identified adjacent to major cancer foci in 109 (82.5%) out of 132 patients. ATX was weakly positive in 83 (76.1%) cases (Fig. 2b) and AGK was positive in 91 (83.5%) out of the 109 HG‐PIN lesions (Fig. 3b). Consequently, both enzymes were weakly but simultaneously expressed in HG‐PIN lesions obtained from 83 out of 109 patients (Table 2a).
Figure 2.

Immunohistochemical staining of autotaxin (ATX) in prostate cancer specimens with different Gleason grades. (a) Grade 0 expression in non‐neoplastic prostatic tissues. (b) Grade 1 expression in a high‐grade prostate intraepithelial neoplasia (HG‐PIN) lesion. (c) Grade 1 expression in Gleason grade 3 cancer foci similar to the staining intensity of the nearby HG‐PIN lesions (black arrows). (d) Grade 2 expression in a Gleason grade 5 lesion with a characteristic nuclear staining in cancer cells (black arrows). The magnification bar measures 50 µm.
Figure 3.
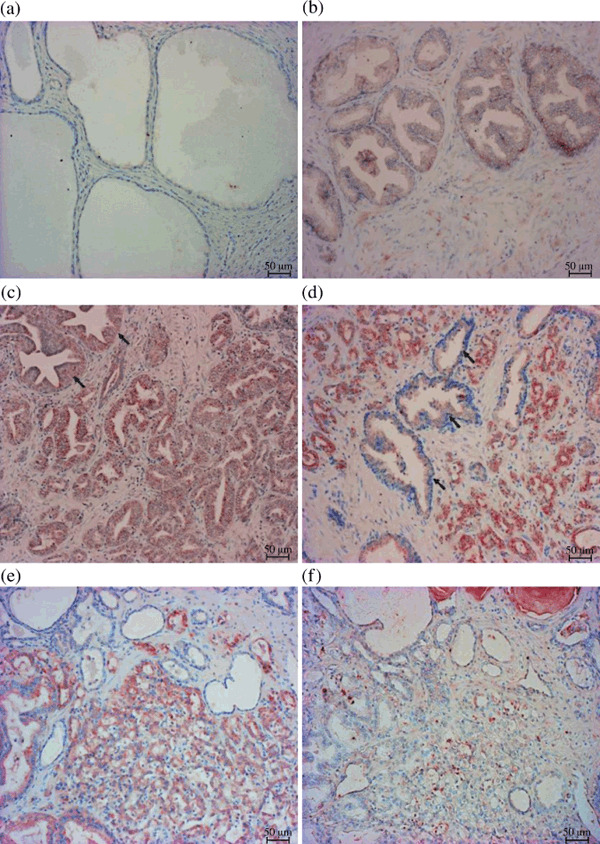
Immunohistochemical staining of acylglycerol kinase (AGK) in prostate cancer specimens with different Gleason grades. (a) Grade 0 expression in non‐neoplastic prostatic tissues. (b) Grade 1 expression in a high‐grade prostate intraepithelial neoplasia (HG‐PIN) lesion. (c) Grade 1 expression in Gleason grade 3 cancer foci (similar staining intensity to HG‐PIN lesions). (d) Grade 2 expression in cancer foci of Gleason grade 4. Notice the characteristic difference in staining intensity between the strongly stained cancer foci and the weakly stained nearby HG‐PIN lesions (black arrows). (e) Another grade 4 cancer foci with grade 2 expression. (f) The strong staining disappeared when the synthetic peptide CDPRKREQMLTSPTQ was mixed with the anti‐AGK antibody OB0680. The magnification bar measures 50 µm.
Table 2a.
A comparison between ATX and AGK expression in HG‐PIN lesions *
| AGK expression (n = 109/132, 82.5%) | ATX expression (n = 109/132; 82.5%) | |
|---|---|---|
| Grade 0 (n = 26; 23.9%) | Grade 1 (n = 83; 76.1%) | |
| Grade 0 (n = 18; 16.5%) | 18 | 0 |
| Grade 1 (n = 91; 83.5%) | 8 | 83 |
Significant correlation P < 0.0001. AGK, acylglycerol kinase; ATX, autotaxin; HG‐PIN, high‐grade prostate intraepithelial neoplasia.
In contrast, major cancer foci in 65 (49%) patients showed strong expression of ATX (a representative picture is shown in Fig. 2d) while those in 53 (40%) patients showed weak expression (Fig. 2c) and the remaining 14 (11%) showed negative expression. Major cancer foci in 82 (62%) patients showed strong expression of AGK (representative pictures are shown in Fig. 3d,e), while those in 42 (32%) patients showed weak expression (Fig. 3c) and the remaining eight (6%) cases showed negative expression. The positive staining in cancer foci was not identified by the addition of the synthetic peptide, CDPRKREQMLTSPTQ, to the anti‐AGK antibody (Fig. 3f), which indicates specific reactivity of the antibody to cancer epithelia. Consequently, major cancer foci obtained from 45 (34%) patients showed strong expression of both ATX and AGK while staining intensities of both enzymes did not coincide in more than half of the subjects (Table 2b).
Table 2b.
A comparison between ATX and AGK expression in cancer foci *
| AGK expression | ATX expression | ||
|---|---|---|---|
| Grade 0 (n = 14) | Grade 1 (n = 53) | Grade 2 (n = 65) | |
| Grade 0 (n = 8) | 3 | 4 | 1 |
| Grade 1 (n = 42) | 5 | 18 | 19 |
| Grade 2 (n = 82) | 6 | 31 | 45 |
Insignificant correlation P = 0.199. AGK, acylglycerol kinase; ATX, autotaxin.
As to the cellular localization of ATX and AGK expressions in cancer foci, both were positive in the cytoplasm. In addition, nuclear staining of ATX was observed in the cancer foci of 40 (30.3%) patients (Fig. 2d). Moreover, ATX nuclear staining was more frequently observed in higher Gleason grades (4 or 5) than in lower (3 or less) grades (P = 0.0002).
Staining intensities and clinicopathological parameters. Table 3 shows the relationship of ATX and AGK expression levels with various clinical and pathological parameters in our prostate cancer patients. Both ATX and AGK expression levels were significantly correlated with primary Gleason grade of major cancer foci that were immunohistochemically analyzed (P < 0.0001) as shown in 2, 3. Moreover, presence of capsular invasion was correlated with strong expression of ATX (P = 0.03) and AGK (P = 0.003). On the contrary, pathologic T‐stage, perineural infiltration, seminal vesicle invasion, and lymphatic or vascular spread were not correlated with ATX or AGK expression levels.
Table 3.
Staining intensity of ATX and AGK in comparison with clinicopathological profiles of prostate cancer patients
| Parameters | ATX expression | P‐values | AGK expression | P‐values | |||||
|---|---|---|---|---|---|---|---|---|---|
| Grade 0 (n = 14) | Grade 1 (n = 53) | Grade 2 (n = 65) | Grade 0 (n = 8) | Grade 1 (n = 42) | Grade 2 (n = 82) | ||||
| Gleason score | ≤3 + 3 | 0 | 10 | 3 | 0.16 | 0 | 7 | 6 | 0.05 |
| 3 + 4 | 4 | 16 | 19 | 4 | 15 | 20 | |||
| 4 + 3 | 4 | 13 | 19 | 2 | 13 | 21 | |||
| ≥4 + 4 | 6 | 14 | 24 | 2 | 7 | 35 | |||
| Primary Gl. grade | ≤Gl. 3 | 11 | 38 | 12 | <0.0001 | 6 | 31 | 24 | <0.0001 |
| ≥Gl. 4 | 3 | 15 | 53 | 2 | 11 | 58 | |||
| Pathologic T‐stage | ≤T2b | 6 | 34 | 36 | 0.32 | 6 | 28 | 42 | 0.15 |
| ≥T3a | 8 | 19 | 29 | 2 | 14 | 40 | |||
| Capsular invasion | Negative | 7 | 39 | 33 | 0.03 | 5 | 34 | 40 | 0.003 |
| Positive | 7 | 14 | 32 | 3 | 8 | 42 | |||
| Perineural invasion | Negative | 4 | 13 | 11 | 0.47 | 2 | 12 | 14 | 0.32 |
| Positive | 10 | 40 | 54 | 6 | 30 | 68 | |||
| SV invasion | Negative | 44 | 49 | 0.27 | 7 | 34 | 65 | 0.85 | |
| Positive | 1 | 9 | 16 | 1 | 8 | 17 | |||
| Lymphatic involvement | Negative | 9 | 30 | 30 | 0.34 | 6 | 22 | 41 | 0.40 |
| Positive | 5 | 23 | 35 | 2 | 20 | 41 | |||
| Vascular involvement | Negative | 11 | 35 | 43 | 0.64 | 7 | 32 | 50 | 0.11 |
| Positive | 3 | 18 | 22 | 1 | 10 | 32 | |||
| Mean PSA (ng/mL) | 12.1 | 15.2 | 11.9 | 0.36 | 11.9 | 14.5 | 13 | 0.41 | |
Note: Significant values are underlined.
AGK, Acylglycerol kinase; ATX, Autotaxin; Gl., Gleason; PSA, prostate‐specific antigen; SV, seminal vesicle.
Prostate‐specific antigen (PSA)‐failure and expression levels of ATX and AGK. Figure 4 shows the relationship between biochemical failure‐free survival and staining intensities of ATX and AGK. Probability of PSA‐progression was significantly correlated with ATX staining intensity (P < 0.0001) but not with AGK staining intensity. A multivariate analysis including ATX and AGK staining intensities, preoperative serum PSA level, Gleason score, pathologic T‐stage, and other clinicopathological parameters demonstrated that ATX staining intensity (P < 0.0001), lymphatic involvement (P = 0.041), and serum PSA levels (P = 0.022) were independent prognostic markers for PSA‐progression (Table 4).
Figure 4.

Prostatespecific antigen (PSA)‐failure‐free survival curves in patients divided into three groups according to the staining intensity of autotaxin (ATX) expression levels (a) or acylglycerol kinase (AGK) expression levels (b). Staining intensity of ATX was significantly correlated with probability of PSA‐failure (P < 0.0001) whereas that of AGK was not significant (P = 0.718). LysoPLD, lysophospholipase D; RRP, Radical Retropublic Prostatectomy.
Table 4.
Multivariate Cox regression analysis of ATX and AGK expression patterns and clinicopathological profiles of prostate cancer in relation to the PSA‐failure‐free survival outcome in our patients
| Parameter | Variable | RR | 95% CI | P‐values |
|---|---|---|---|---|
| ATX expression | Grade 0 vs Grade 1 | 2.679 | 1.216–5.906 | <0.0001 |
| Grade 1 vs Grade 2 | 1.045 | 0.543–2.011 | ||
| Grade 0 & 1 vs Grade 2 | 1.927 | 1.360–2.732 | ||
| AGK expression | Grade 0 vs Grade 1 | 1.470 | 0.601–3.600 | 0.109 |
| Grade 1 vs Grade 2 | 0.578 | 0.319–1.047 | ||
| Grade 0 & 1 vs Grade 2 | 0.764 | 0.549–1.062 | ||
| PSA level | ≤(4) vs (4–10) | 0.483 | 0.103–2.255 | 0.022 |
| (4–10) vs (10–20) | 4.226 | 1.282–13.93 | ||
| (10–20) vs≥(20) | 0.897 | 0.473–1.704 | ||
| Gleason score | ≤(3 + 3) vs (3 + 4) | 1.176 | 0.562–2.458 | 0.299 |
| (3 + 4) vs (4 + 3) | 0.648 | 0.348–1.209 | ||
| (4 + 3) vs≥(4 + 4) | 1.489 | 0.912–2.431 | ||
| pT‐stage | ≤(T2b) vs≥(T3a) | 1.444 | 0.787–2.649 | 0.235 |
| Capsular invasion | Negative vs Positive | 0.676 | 0.369–1.237 | 0.204 |
| Perineural invasion | Negative vs Positive | 0.846 | 0.509–1.405 | 0.518 |
| SV invasion | Negative vs Positive | 1.257 | 0.786–2.011 | 0.339 |
| Lymphatic involvement | Negative vs Positive | 1.574 | 1.018–2.433 | 0.041 |
| Vascular involvement | Negative vs Positive | 0.719 | 0.469–1.103 | 0.130 |
| Surgical margin | Negative vs Positive | 1.331 | 0.949–1.896 | 0.098 |
Note: Significant values are underlined.
AGK, acylglycerol kinase; ATX, autotaxin; CI, confidence interval; PSA, prostate‐specific antigen; pT‐stage, pathologic T‐stage; RR, relative risk; SV, seminal vesicle.
Discussion
Our study is the first to analyze expression levels of LPA‐producing enzymes ATX and AGK in prostate cancer with a special relevance to its clinicopathological profiles in order to clarify the role of LPA in the development and progression of prostate cancer.
Autotaxin (ATX) and AGK were significantly expressed in prostate cancer tissues while the surrounding non‐neoplastic glands were negative in all specimens studied. Weak but apparent expression of LPA‐producing enzymes in HG‐PIN, in contrast to negative expression in normal glands, suggests that LPA‐producing enzymes or LPA itself play a key role in the development of prostate cancer. As to the relationship of both enzymes’ expression to malignant potentials of prostate cancers, the primary Gleason grade of cancer foci and presence of capsular invasion were significantly correlated with expression levels of ATX and AGK. These findings suggest that LPA‐producing enzymes or LPA also play a key role in the progression of prostate cancer. Our recent analyses using laser capture microdissection showed that Edg‐7/LPA3, a LPA‐receptor, was over‐expressed in prostate cancer and its expression level was significantly correlated with the primary Gleason grade of cancer foci examined.( 28 ) Furthermore, the previous study revealed that protein localization of ATX and AGK was restricted to cancer epithelial cells. The aforementioned studies,( 1 , 6 , 9 , 10 , 28 ) together with the present results, suggest that the LPA‐rich microenvironment is advantageous for the malignant progression of prostate cancers.
Autotaxin (ATX) and AGK expression patterns were quite different between prostate cancer cell‐lines as well as tissue specimens. Altered expression profiles were encountered at both mRNA and protein levels in prostate cancer cell‐lines in which ATX was mainly expressed in the androgen‐insensitive DU‐145 and PC‐3 cells, while AGK was more predominant in the androgen‐sensitive LNCaP cells. Moreover, in the androgen‐insensitive subline of LNCaP cells (AILNCaP), AGK expression was low as compared to their androgen‐sensitive counterparts. In contrast to that, ATX mRNA level was higher in AILNCaP than in LNCaP cells. These results are comparable to the immunohistochemical findings in surgical specimens in which staining intensity of ATX did not always coincide with that of AGK. Rather, 37 (28%) tumors with strong AGK staining intensity showed weak or negative staining for ATX, while 20 (15%) tumors with strong ATX staining intensity showed weak or negative staining for AGK. Furthermore, AGK expression was solely limited to the cytoplasm while ATX was significantly expressed in the nuclei of cancer cells as well. This difference was particularly noticed in higher Gleason grade cancer foci with high ATX expression. The difference in subcellular localization between ATX and AGK can be ascribed to the potential nuclear role played by ATX, while AGK is mainly localized in the mitochondria.( 4 , 5 , 29 ) These altered expression patterns can be explained by both enzymes not acting simultaneously in LPA synthesis in which phosphorylation could be the dominant pathway, particularly during early stages of prostate oncogenesis. Previous studies also showed that ablation of endogenous AGK markedly reduced LPA‐dependent EGF activity and cell proliferation.( 1 ) Others have postulated that ATX is inhibited in a negative feedback fashion by LPA which is not the case in AGK.( 30 ) Interestingly, ATX mRNA level in PC3 cells was lower than that in DU‐145 in all experiments done including our previous study,( 28 ) but ATX mRNA could always be identified. It remains to be elucidated whether post‐translational modification plays a role in the protein expression of ATX in PC3 cells.
In the present study, ATX expression was inversely correlated to the probability of PSA‐failure‐free survival, which was particularly interesting because ATX has been reported to be a cell motility–stimulating factor.( 16 ) Our results showed that ATX could be an independent prognostic tissue marker for predicting PSA failure outcome in prostate cancer patients. However, it remains to be elucidated in a prospective fashion whether ATX is a potential marker for prediction of outcome after treatment intervention for localized prostate cancer,( 31 ) as it may provide a promising target in therapies of prostate cancer.( 17 )
In conclusion, although concentration of LPA in prostate cancer foci was not directly evaluated, LPA‐producing enzymes (ATX and AGK) were frequently expressed in cancer cells and precancerous HG‐PIN. In particular, high expression levels of ATX were correlated with both malignant potentials and poor outcomes. These results strongly suggest that an ATX–(or AGK–)LPA axis plays a pivotal role in both the development and progression of prostate cancer.
Disclosure
No potential conflict of interest could be perceived as prejudicing the impartiality of research.
Abbreviations
| AGK | Acylglycerol kinase |
| ATX | Autotaxin |
| HG‐PIN | High‐grade prostate intraepithelial neoplasia |
| LPA | Lysophosphatidic acid |
| NF‐κB | Nuclear factor–kappa β gene |
| PAP | Prostatic acid phosphatase |
| PSA | Prostate‐specific antigen. |
| RhoA | Ras homolog A gene |
| SRE | Serum response element |
Acknowledgments
This work was supported in part by a Grant‐in‐Aid for Scientific Research from the Ministry of Education, Science, Culture and Sports, Japan (no. 18390483). We would like to thank Mrs Zhang Xia for her technical assistance in the research work of our study. We also thank Drs Takahiro Inoue and Osamu Ogawa (Department of Urology, Kyoto University, Graduate School of Medicine) for kindly providing us with AILNCaP cells.
References
- 1. Bektas M, Payne S, Liu H, Goparaju S, Milstien S, Spiegel S. A novel acylglycerol kinase that produces lysophosphatidic acid modulates cross talk with EGFR in prostate cancer cells. J Cell Biol 2005; 169: 801–11. [DOI] [PMC free article] [PubMed] [Google Scholar]
- 2. Yamada T, Yano S, Ogino H et al . Lysophosphatidic acid stimulates the proliferation and motility of malignant pleural mesothelioma cells through lysophosphatidic acid receptors, LPA1 and LPA2 . Cancer Sci 2008; 99: 1603–10. [DOI] [PMC free article] [PubMed] [Google Scholar]
- 3. Imamura F, Mukai M, Ayaki M, Akedo H. 3Y‐27632, an Inhibitor of Rho‐associated Protein Kinase, Suppresses Tumor Cell Invasion via Regulation of Focal Adhesion and Focal Adhesion Kinase. Jpn J Cancer Res 2000; 91: 811–6. [DOI] [PMC free article] [PubMed] [Google Scholar]
- 4. Meyer zu Heringdorf D, Jacobs KH. Lysophospholipid receptors: signaling, pharmacology and regulation by lysophospholipid metabolism. Biochim Biophys Acta 2007; 1768: 923–40. [DOI] [PubMed] [Google Scholar]
- 5. Karin M, Cao Y, Greten FR, Li ZW. NF‐kappa B in cancer: From innocent bystander to major culprit. Nat Rev Cancer 2002; 2: 301–10. [DOI] [PubMed] [Google Scholar]
- 6. Prenzel N, Zwick E, Daub H et al . EGF receptor transactivation by G‐protein‐coupled receptors requires metalloproteinase cleavage of pro HB‐EGF. Nature 1999; 402: 884–8. [DOI] [PubMed] [Google Scholar]
- 7. Daaka Y. Mitogenic action of LPA in prostate. Biochim Biophys Acta 2002; 1582: 265–9. [DOI] [PubMed] [Google Scholar]
- 8. Goetzl EJ, Kong Y, Mei B. Lysophosphatidic acid and sphingosine 1‐phosphate protection of T cells from apoptosis in association with suppression of Bax. J Immunol 1999; 162: 2049–56. [PubMed] [Google Scholar]
- 9. Prestwich GD, Gajewiak J, Zhang H, Xu X, Yang G, Serban M. Phosphatase‐resistant analogues of lysophosphatidic acid: Agonists promote healing, antagonists and autotaxin inhibitors treat cancer. Biochim Biophys Acta 2008; 1781: 588–94. [DOI] [PMC free article] [PubMed] [Google Scholar]
- 10. Hama K, Bandoh K, Kakehi Y, Aokia J, Araia H. Lysophosphatidic acid (LPA) receptors are activated differentially by biological fluids: possible role of LPA‐binding proteins in activation of LPA receptors. FEBS Lett 2002; 523: 187–92. [DOI] [PubMed] [Google Scholar]
- 11. Sakamoto S, Yokoyama M, Zhang X et al . Increased expression of CYR61, an extracellular matrix signaling protein, in human benign prostatic hyperplasia and its regulation by lysophosphatidic acid. Endocrinology 2004; 145: 2929–40. [DOI] [PMC free article] [PubMed] [Google Scholar]
- 12. Siess W, Zangl KJ, Essler M et al . Lysophosphatidic acid mediates the rapid activation of platelets and endothelial cells by mildly oxidized low density lipoprotein and accumulates in human atherosclerotic lesions. Proc Natl Acad Sci USA 1999; 96: 6931–6. [DOI] [PMC free article] [PubMed] [Google Scholar]
- 13. Sano T, Baker D, Virag T et al . Multiple mechanisms linked to platelet activation result in Lysophosphatidic acid and sphingosine 1–phosphate generation in blood. J Biol Chem 2002; 277: 21197–206. [DOI] [PubMed] [Google Scholar]
- 14. Budnik LT, Mukhopadhyay AK. Lysophosphatidic acid and its role in reproduction: Minireview. Biol Reprod 2002; 66: 859–65. [DOI] [PubMed] [Google Scholar]
- 15. Tokumura A, Majima E, Kariya Y et al . Identification of human plasma lysophospholipase D, a lysophosphatidic acid‐producing enzyme, as autotaxin, a multifunctional phosphodiesterase. J Biol Chem 2002; 277: 39436–42. [DOI] [PubMed] [Google Scholar]
- 16. Kishi Y, Okudaira S, Tanaka M et al . Autotaxin is over expressed in glioblastoma multiforme and contributes to cell motility of glioblastoma by converting lysophosphatidylcholine to lysophosphatidic acid. J Biol Chem 2006; 281: 17492–500. [DOI] [PubMed] [Google Scholar]
- 17. Gendaszewska‐Darmach E. Lysophosphatidic acids, cyclic phosphatidic acids and autotaxin as promising targets in therapies of cancer and other diseases. Acta Biochim Pol 2008; 55: 227–40. [PubMed] [Google Scholar]
- 18. Umezu‐Goto M, Kishi Y, Taira A et al . Autotaxin has lysophospholipase D activity leading to tumor cell growth and motility by lysophosphatidic acid production. J Cell Biol 2002; 158: 227–33. [DOI] [PMC free article] [PubMed] [Google Scholar]
- 19. Van Meeteren LA, Moolenaar WH. Regulation and biological activities of the autotaxin‐LPA axis. Prog Lipid Res 2007; 46: 145–60. [DOI] [PubMed] [Google Scholar]
- 20. Kulkarni P, Getzenberg RH. High‐fat diet, obesity and prostate disease: the ATX‐LPA axis? Nat Clin Pract Urol 2009; 6: 128–31. [DOI] [PubMed] [Google Scholar]
- 21. Spiegel S, Milstien S. Critical role of acylglycerol kinase in epidermal growth factor‐induced mitogenesis of prostate cancer cells. Biochem Soc Trans 2005; 33: 1362–5. [DOI] [PubMed] [Google Scholar]
- 22. Tanaka M, Kishi Y, Takanezawa Y, Kakehi Y, Aoki J, Arai H. Prostatic acid phosphatase degrades lysophosphatidic acid in seminal plasma. FEBS Lett 2004; 571: 197–204. [DOI] [PubMed] [Google Scholar]
- 23. Inoue T, Yoshida T, Shimizu Y et al . Requirement of androgen‐dependent activation of protein kinase Czeta for androgen‐dependent cell proliferation in LNCaP Cells and its roles in transition to androgen‐independent cells. Mol Endocrinol 2006; 12: 3053–69. [DOI] [PubMed] [Google Scholar]
- 24. Takagi H, Shibutani M, Kato N et al . Microdissected region‐specific gene expression analysis with methacarn‐fixed, paraffin‐embedded tissues by real‐time RT‐PCR. J Histochem Cytochem 2004; 52: 903–13. [DOI] [PubMed] [Google Scholar]
- 25. Wu X, Kakehi Y, Zeng Y, Taoka R, Tsunemori H, Inui M. Uroplakin II as a promising marker for molecular diagnosis of nodal metastases from bladder cancer: comparison with cytokeratin 20. J Urol 2005; 174: 2138–42. [DOI] [PubMed] [Google Scholar]
- 26. Tickoo SK, Alden D, Olgac S et al . Immunohistochemical expression of hypoxia inducible factor‐1α and its downstream molecules in sarcomatoid renal cell carcinoma. J Urol 2007; 177: 1258–63. [DOI] [PubMed] [Google Scholar]
- 27. Clarke NW. What does failure after surgery or radiation mean? Eur Urol Suppl 2008; 7: 410–5. [Google Scholar]
- 28. Zeng Y, Kakehi Y, Nouh MA, Tsunemori H, Sugimoto M, Wu XX. Gene expression profiles of lysophosphatidic acid‐related molecules in the prostate: Relevance to prostate cancer and benign hyperplasia. Prostate 2009; 69: 283–92. [DOI] [PubMed] [Google Scholar]
- 29. Seifert A, Klonisch T, Wulfaenger J et al . The cellular localization of autotaxin impacts on its biological functions in human thyroid carcinoma cells. Oncol Rep 2008; 19: 1485–91. [PubMed] [Google Scholar]
- 30. Van Meeteren LA, Ruurs P, Christodoulou E et al . Inhibition of autotaxin by lysophosphatidic acid and sphingosine 1‐phosphate. J Biol Chem 2005; 280: 21155–61. [DOI] [PubMed] [Google Scholar]
- 31. Nakamura K, Takeuchi T, Ohkawa R et al . Serum lysophospholipase D/autotaxin may be a new nutritional assessment marker: study on prostate cancer patients. Ann Clin Biochem 2007; 44: 549–56. [DOI] [PubMed] [Google Scholar]