

Abstract
MDM2 is a direct negative regulator of p53. The p53‐independent mdm2‐P1 and p53‐dependent mdm2‐P2 promoters have been recently shown to harbor Sp1 binding sites. Mithramycin, an inhibitor of Sp1 DNA binding, has been used clinically to treat hypercalcemia and some types of neoplastic disorders. In this study, we investigated the mechanisms behind the anticancer effect of mithramycin. In gynecologic cancer cells expressing wild‐type p53, mithramycin stabilized p53 and increased the expression of the p53 downstream target genes PUMA and p21, arrested the cell cycle, and induced apoptosis. This activation of the p53 signaling pathway was a specific effect of MTH at concentrations <50 nm. Mithramycin temporally decreased transcription of both the mdm2‐P1 and ‐P2 promoters. This was followed by a subsequent increase of mdm2‐P2 promoter activity by activated p53. Up‐regulated MDM2 was in its active form, and consequently attenuated p53 activity. Although mithramycin activated p53 and suppressed the growth of human gynecologic cancer cell xenografts in mice, this was accompanied with a secondary up‐regulation of MDM2. Combined treatment with mithramycin and nutlin‐3, a drug that inhibits MDM2–p53 interaction, overcame a secondary up‐regulation of MDM2 and synergistically inhibited cancer cell growth by inducing apoptosis through activation of the p53 signaling pathway. These observations provide a better understanding of the mechanisms of mithramycin activity, and suggest a potential role for combining mithramycin and nutlin‐3 as a chemotherapeutic treatment for gynecologic cancers. (Cancer Sci 2010; 101: 1387–1395)
The oncoprotein MDM2 is the primary negative regulator of the transcription factor p53 in proliferating cells.( 1 , 2 ) MDM2 regulates p53 function through multiple mechanisms, including concealing its activation domain from the transcriptional machinery and targeting it for ubiquitination, nuclear export, and proteosomal degradation.( 3 , 4 ) In humans, a subset of tumors over‐expresses MDM2 mRNA and protein; this over‐expression is associated with accelerated cancer progression and chemoresistance.( 5 ) Over‐expression of MDM2 accelerates p53 degradation and attenuates its tumor‐suppressive function. Transcription of mdm2 mRNA encoding the full‐length p53‐binding form of MDM2 (p90) occurs from two promoters, P1 and P2. The mdm2‐P1 promoter is regulated by Akt kinase signaling,( 6 ) and also possesses one or more putative Sp1 binding sites.( 7 ) The presence of Sp1, p53, and Ets/Ap‐1 binding sites in the mdm2‐P2 promoter implies that it is regulated in both p53‐dependent and ‐independent manners.( 8 , 9 , 10 ) Moreover, recent studies have identified several proteins that interact with MDM2 and participate in p53‐independent MDM2 functions.( 11 ) Evidence suggests that the regulation of MDM2 expression and activity plays a major role in the proliferation and survival of cancer cells.
A subset of endometrial and ovarian cancers is estrogen‐related. Estrogen‐related endometrial cancers which develop in pre‐ and post‐menopausal women have an endometrioid histology and low cellular grade, and are frequently preceded by endometrial hyperplasia. These endometrial cancers express the estrogen receptor (ER), in particular ERα.( 12 , 13 ) Additionally, estrogen is also considered a key factor in the development of ovarian cancer. The ovarian surface epithelium, from which more than 90% of epithelial ovarian cancers are derived, undergoes robust proliferation in response to estrogen stimulation.( 14 ) The presence of estrogen receptors is also strongly related to the over‐expression of MDM2.( 15 , 16 ) Transfection of a gene encoding ER in cells lacking ER induces the over‐expression of MDM2.( 8 ) The mdm2 gene is also regulated by the Ras‐driven Raf/MEK/MAPK/ER pathway in a p53‐independent manner.( 9 ) Ras is constitutively activated by mutation in about 20% of endometrial cancers and 10–20% of ovarian cancers.( 17 , 18 , 19 )
We have previously shown that the MEK inhibitor U0126 and the anti‐estrogen ICI 182,720 cooperatively reduce the MDM2 level. This results in enhanced p53 and p21 levels, suppressing cell growth of the gynecologic tumors. Moreover, down‐regulation of the MDM2 level by treatment with siRNA also inhibits cancer cell growth through up‐regulation of p53 and p21.( 20 ) These results suggest that MDM2 represents a new molecular target for therapy in estrogen‐related cancers, such as endometrial or ovarian cancers.
Mithramycin (MTH) is an aureolic acid type polyketide produced by the soil bacterium Streptomyces argillaceus.( 21 ) MTH binds to GC‐rich sequences in chromatin and preferentially blocks the binding of transcription factors such as Sp1 to GC‐rich sequences in gene promoters inhibiting their transcription.( 22 ) Consequently, MTH has the potential to inhibit the expression of many genes involved in cancer pathogenesis. MTH has been used clinically for many years to treat testicular carcinoma as well as hypercalcemia in patients with metastatic bone lesions and Paget’s disease.( 23 , 24 , 25 ) However, its current clinical use is limited by its severe side effects that include gastrointestinal, hepatic, kidney, and bone marrow toxicity. Nevertheless, MTH continues to be investigated as a therapeutic agent in cancer and other disorders, one goal of which is to minimize toxicity through use of low‐dose MTH.( 26 ) The present study has examined the properties of low‐dose MTH in endometrial and ovarian cancers, the pathogenesis of which involves the Ras/ER/MDM2 pathway.
Materials and Methods
Chemicals.
For the in vitro experiments, mithramycin (MP Biomedicals, Solon, OH, USA) and nutlin‐3 (Cayman Chemical, Ann Arbor, MI, USA) were dissolved in DMSO at concentrations of 10 μm and 10 mm, respectively. For the in vivo experiments, mithramycin was dissolved in DMSO at a concentration of 10 mg/mL and further diluted in PBS prior to being injected intraperitoneally into mice.
Protein extraction from normal human endometrial glandular cells and normal ovarian surface epithelium.
Endometrial tissues were obtained from hysterectomy specimens removed for the treatment of uterine myomas. Ovarian surface epitheliums were obtained from cystectomy specimens removed for the treatment of ovarian dermoid cysts. This study was approved by the ethical committee of Kyushu University and pre‐operative informed consent was obtained from each patient. Normal endometrial glandular cells were prepared as described previously.( 20 ) The procedure for protein extraction from cultured cells is described below. Ovarian surface epithelia were homogenized using the BioMasher extraction device (Nippi Research Institute of Biomatrix, Tokyo, Japan). The homogenized samples were lysed and the protein extracted using CellLytic MT Mammalian Tissue Lysis/Extraction Reagent (Sigma, St. Louis, MO, USA) according to the manufacturer’s instructions.
Cell culture.
Endometrial cancer cell lines and normal endometrial glandular cells were maintained in Dulbecco’s modified Eagle’s medium (DMEM) supplemented with 10% fetal bovine serum (FBS). The ovarian cancer cell lines were maintained in RPMI medium supplemented with 10% FBS.
Protein extraction and western blotting.
Subconfluent cells were lysed with ice‐cold lysis buffer (20 mm Tris‐HCl [pH 8.0], 1% Triton X‐100, 10% glycerol, 137 mm NaCl, 1.5 m MgCl2, 1 mm EGTA, 50 mm NaF, 1 mm Na3VO4, 1 mm PMSF, 1 μg/mL leupeptin, 10 μg/mL aprotinin). Protein concentrations were determined using the Coomassie Protein Assay (Pierce, Rockford, IL, USA). For western blotting, equal amounts of cell lysates were separated on 10–15% SDS‐polyacrylamide gels and transferred onto polyvinylidene difluoride membranes. The membranes were blocked in TBS (10 mm Tris‐HCl [pH 7.4], 150 mm NaCl, and 0.05% Tween 20) containing 5% nonfat dry milk, and washed in TBS‐Tween. The blots were then incubated with diluted primary antibodies. Primary antibodies, including p53 monoclonal antibody (Ab‐6), PUMA polyclonal antibody (Ab‐1), p21 monoclonal antibody (Ab‐1), MDM2 monoclonal antibody (Ab‐4), and MDM2 (pSer166) polyclonal antibody were obtained from Calbiochem (San Diego, CA, USA). The GAPDH polyclonal antibody (FL‐335) was obtained from Santa Cruz Biotechnology (Santa Cruz, CA, USA). The MDMX/MDM4 polyclonal antibody (BL1258) was purchased from Bethyl Laboratories (Montgomery, TX, USA). After incubation with each primary antibody, blots were incubated with horseradish peroxidase‐linked, antimouse, or antirabbit antibodies and analyzed with the ECL Plus system (Amersham Biosciences, Little Chalfont, Bucks, UK). Protein expression was then quantitated using ImageJ software.
Cell growth assay.
Cells were plated in 24‐well plates at a density of 2 × 10⁴ cells per well and incubated with medium supplemented with 10% FBS for 24 h. After each experimental procedure, viable cells were counted. The medium containing DMSO, or mithramycin and/or nutlin‐3 was replaced every other day.
Luciferase assay.
The luciferase reporter plasmid containing a p53 response element and a second plasmid containing three Sp1 binding sequences were purchased from Clontech (Carlsbad, CA, USA) and Panomics (Redwood City, CA, USA) respectively. Transient transfection of 1 μg of the reporter plasmid was performed using Lipofectamine (Invitrogen, Carlsbad, CA, USA) according to the manufacturer’s instructions. The cells were incubated with DMEM containing 10% FBS for 24 h after transfection. Subsequently, each experimental procedure was performed. Luciferase assays were performed using a luciferase assay system (Promega, Madison, WI, USA) according to the manufacturer’s instructions. Transfection efficiency was normalized with a β‐galactosidase assay using the Luminescent β‐galactosidase Detection Kit II (Clontech).
Analysis of cell cycle, caspase activity, and apoptosis.
After each experimental procedure, the cells were mildly exfoliated with 0.02% EDTA and scraped off of the culture plates. Cell cycle was analyzed by propidium iodide (PI) staining. Stained nuclear fractions were prepared by lysis on ice for 10 min in NP‐40 lysis buffer (3.4 mm sodium citrate, 10 mm NaCl, 0.1% NP‐40) containing 0.5% PI. FLICA (fluorochrome inhibitor of caspases) Apoptosis Detection Kits (Immunochemistry Technologies, Bloomington, MN, USA) were used to measure caspase activity. After being harvested from the culture plates, the cells were labeled with FLICA according to the manufacturer’s instructions. For the detection of apoptotic cells, the harvested cells were incubated with Annexin V‐Fluorescein and PI for 10 min at room temperature. Flow cytometric analysis was then performed with a BD FACSCalibur flow cytometer (BD Biosciences, Palo Alto, CA, USA). Each cell fraction was analyzed with BD CellQuest Pro.
siRNA transfection.
The p53‐siRNA duplex mixture specific to p53 (B‐Bridge siTrio) and negative control siRNA were purchased from Hokkaido System Science (Hokkaido, Japan). The sequences of the sense strands were as follows: 5′‐GGAAACAUUUUCAGACCUATT‐3′, 5′‐GCAUCUUAUCCGAGU‐GGAATT‐3′, and 5′‐GAGUGCAUUGUGAGGGUUATT‐3′. siRNA incorporation was carried out with LipoTrust EXOligo (Hokkaido System Science) according to the manufacturer’s protocol. The cells were incubated with DMEM containing 10% FBS for 24 h after transfection, after which experimental procedures were performed.
RNA isolation and quantitative real‐time RT‐PCR.
Total cellular RNA was isolated using Isogen (Nippon Gene, Tokyo, Japan) according to the manufacturer’s instructions. Five hundred ng of total RNA was reverse transcribed using an Oligo (dT) primer. Real‐time PCR was performed on 25 μL of a reaction mixture consisting of 12.5 μL of 2 × Brilliant II Fast SYBR Green QPCR master mix (Stratagene, La Jolla, CA, USA). The real‐time PCR primers for mdm2‐P1, mdm2‐P2, c‐myc, c‐src, h‐tert, bcl‐xl, vegf, and gapdh, and reaction conditions were as previously described.( 26 , 27 ) The relative mRNA expression value of each gene to gapdh in each sample were calculated and compared.
Immunofluorescent staining.
Cells cultured on chamber slides were fixed in 4% paraformaldehyde for 10 min and permeabilized in PBS/0.1% Triton X‐100 for 5 min. After the cells were incubated with mouse monoclonal MDM2 antibody (Ab‐4) overnight at 4°C, the bound MDM2 antibodies were visualized by green fluorescence from secondary antibody staining with antimouse IgG conjugated to Alexa 488 (Molecular Probes, Eugene, OR, USA) The cells were counter stained with 4′,6‐diamino‐2‐phenylindole (DAPI) to visualize the nuclei (Vectashield; Vector Laboratories, Burlingame, CA, USA).
Tumor formation in nude mice.
The human ovarian cancer cell line OVAS21 was grown to subconfluency and harvested. Cells were resuspended in serum‐free RPMI mixed with an equal amount of Matrigel (BD Biosciences), and injected (5 × 10⁵ per injection) subcutaneously into the hindquarters of female athymic nu/nu mice. When the tumors exceeded 5 mm in diameter (7 days after inoculation), mice were randomized into either the control (PBS i.p. group) or the treatment arms (MTH 600 μg/kg/day i.p. groups). During the 4‐week treatment period, mice were treated three times a week and the tumor volumes were measured twice a week. The mice were sacrificed and the tumors were harvested on Day 28.
TUNEL assay.
A TUNEL assay was performed on 5‐μm paraffin sections. Tissue was deparaffinized, fixed with 4% paraformaldehyde for 15 min at room temperature, and permeabilized with 20 μg/mL Proteinase K solution (100 mm Tris‐HCl [pH 8.0], 50 mm EDTA) for 10 min at room temperature. After refixation with 4% paraformaldehyde for 5 min at room temperature, TUNEL labeling was performed with the DeadEnd Colorimetric TUNEL System (Promega) following the manufacturer’s protocol.
Immunohistochemistry.
Immunohistochemistry was performed on 5‐μm paraffin sections. After deparaffinization, endogenous peroxidase was quenched by incubation with 0.3% hydrogen peroxide in methanol for 30 min. To enhance antigen detection, slides in 10 mm citrate buffer [pH 6.0], were microwaved for 15 min in a 400‐watt microwave oven. They were then reacted with primary antibody (1:50 dilution) in PBS containing 1% bovine serum albumin for 60 min at room temperature. The primary antibody, MDM2 monoclonal antibody (SMP14), was obtained from Santa Cruz Biotechnology. After washing with PBS, the slides were incubated with antimouse IgG conjugated to peroxidase‐labeled dextran polymer (Envision+; Dako, Tokyo, Japan) for 30 min, and color developed with 3,3′‐diaminobenzamine tetrahydrochloride in PBS containing 0.02% hydrogen peroxidase. The sections were counterstained with hematoxylin.
Statistical analysis.
The statistical significance was assessed using the Mann–Whitney U‐test and a P‐value <0.05 was considered statistically significant.
Results
MTH induces apoptosis and cell cycle arrest in cells expressing wt p53.
We used three endometrial and three ovarian cancer cell lines in this study. Among these six cell lines, four (Hec6, HHUA, KF, and OVAS21) expressed wild‐type (wt) p53, Hec1 expressed mutant‐type (mt) p53 and SKOV3 had p53 deleted. In all of these endometrial and ovarian cancer cell lines, the levels of MDM2 expression were enhanced compared with those in normal human endometrial glandular cells (EMG) and normal ovarian surface epithelium (OSE), respectively (Fig. S1).
We investigated the effect of MTH on cell growth of endometrial and ovarian cancer cell lines. Treatment with MTH (20, 40, 60 nm) suppressed cell growth in all six gynecologic cancer cell lines in a dose‐dependent manner (Fig. S2). The inhibitory effect of MTH on cell growth was more pronounced in cell lines expressing wt p53 than in the cell lines expressing mt p53 (Fig. 1a), implying that the growth‐inhibitory effect of MTH was dependent on p53 status.
Figure 1.
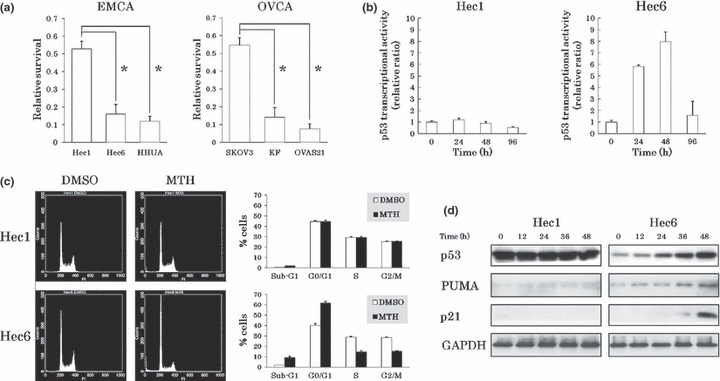
Growth inhibitory effects of mithramycin (MTH) on gynecologic cancer cell lines. (a) Inhibitory effects of MTH on cell growth. After treatment with DMSO (control) or 20 nm MTH for 6 days, viable cells were counted and normalized against the control. Experiments were performed in triplicate. Vertical bars indicate SDs. *P < 0.01. The inhibitory effect of MTH on cell growth was more pronounced in the cell lines expressing wild‐type (wt) p53 than in the cell lines expressing mutant‐type (mt) p53. (b) Alteration in p53 transcriptional activities by MTH. After transfection of the vectors into each endometrial cancer cell line, the cells were treated with DMSO or 20 nm MTH. Luciferase activities of DMSO‐treated and MTH‐treated cells were analyzed every 12 h. Treated cells were normalized to the control value at the same time point. Experiments were performed in triplicate. p53 transcriptional activity was enhanced and maintained at a high level for 48 h in Hec6 cells. (c) Alteration in cell cycle phases by MTH. After treatment with DMSO or 20 nm MTH for 96 h, the cells were analyzed by flow cytometry. In response to MTH treatment, Hec6 cells accumulated in the sub‐G1 and G0/G1 phases. Data represent the average and SDs of three independent experiments. (d) The changes in expression levels of p53 target genes following treatment with MTH. The cells were treated with 20 nm MTH and analyzed for p53, PUMA, and p21 expression levels every 12 h by western blotting. GAPDH protein levels were included as internal controls. The expression levels of p53, PUMA, and p21 were enhanced in Hec6 cells in response to MTH.
To further evaluate the effect of p53 on cell growth inhibition by MTH, we performed a reporter assay using a luciferase plasmid vector containing a p53‐responsive element in its promoter. After transfection of the vectors into Hec1 cells expressing mt p53 and Hec6 cells expressing wt p53, we compared luciferase activity in the presence or absence of 20 nm MTH. Transcriptional activity by p53 was enhanced in response to MTH and high levels of activity were maintained for 48 h in Hec6 cells. In contrast, no alterations in luciferase activity were shown in Hec1 cells (Fig. 1b).
To clarify the mechanisms of cell growth suppression by MTH, we examined alterations in cell cycle progression by flow cytometry. In response to 20 nm MTH for 96 h, Hec6 cells accumulated in the sub‐G1 and G0/G1 phases, but Hec1 cells showed no significant responses (Fig. 1c). A similar accumulation of cells in the sub‐G1 and G0/G1 phases was observed in HHUA, KF, and OVAS21 cells expressing wt p53; however, significant alterations were undetectable in SKOV3 cells in which p53 was deleted (data not shown). The results suggest that the induction of apoptosis and cell cycle arrest by MTH is dependent on p53 status.
Next, we analyzed the expression levels of p53 and its target genes by western blotting. The expression levels of p53, PUMA (a mediator of apoptosis), and p21 (cyclin‐dependent kinase inhibitor of the Cip/Kip family) were enhanced in Hec6 cells but not in Hec1 cells in response to 20 nm MTH (Fig. 1d). Similar results were observed repeatedly in HHUA and KF cells expressing wt p53, and in SKOV3 cells with deleted p53 (Fig. S3). OVAS21 cells expressed a high level of PUMA in the absence of MTH despite having normal p53 levels, and showed no significant change in PUMA expression in response to MTH. To address the signals involved in MTH‐induced apoptosis, we examined the activity of caspases 8, 9, and 3/7 by flow cytometry using FLICA. Caspases 8, 9, and 3/7 were activated in Hec6 cells but not in Hec1 cells in response to 48‐h treatment with 20 nm MTH (Fig. S4). Collectively, these results suggest that MTH stabilizes p53 and induces p53‐dependent apoptosis and G0/G1 cell cycle arrest.
The inhibitory effect of MTH on cell growth is partially p53 dependent.
Next, we confirmed the relevance of p53 status to the inhibitory effects of MTH on cell growth. We used small‐interfering RNA (p53‐siRNA) to knock‐down p53 in Hec6 cells expressing wt p53 and compared the effects of MTH to cells transfected with control‐siRNA. p53‐siRNA had a knock‐down efficiency of about 90% and the increases in PUMA and p21 expression levels after 48‐h treatment with 20 nm MTH were almost abolished (Fig. 2a). Moreover, p53‐siRNA partially reversed the growth inhibition of Hec6 cells mediated by 20 nm MTH compared to control‐siRNA (60%vs 20%) (Fig. 2b). These results demonstrated that the growth inhibitory effect of MTH was partially dependent on the p53 activity.
Figure 2.
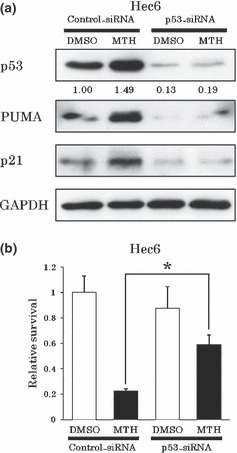
Growth inhibitory effects of mithramycin (MTH) are partially p53‐dependent. (a) p53‐dependent PUMA and p21 up‐regulation by MTH. siRNA‐transfected Hec6 cells were treated with DMSO or 20 nm MTH for 48 h and protein levels were analyzed. In the cells transfected with p53‐siRNA, we did not observe up‐regulation of either PUMA or p21 expression levels by MTH. (b) p53‐dependent inhibitory effect of MTH on Hec6 cell growth. After siRNA transfection, Hec6 cells were treated with DMSO (control) or 20 nm MTH for 96 h. Viable cells were counted and normalized against its control. Experiments were performed in triplicate. Vertical bars indicate SDs. *P < 0.01. When p53 was knocked‐down by p53‐siRNA in Hec6 cells, the growth suppression by 20 nm MTH treatment for 96 h was partially reversed.
MTH increases p53‐dependent mdm2‐P2 promoter activity.
MTH induced apoptosis and cell cycle arrest in cancer cells in a p53‐dependent manner. To clarify whether p53 activation by MTH is followed by MDM2 up‐regulation by its feedback machinery, we investigated the change in MDM2 expression levels in response to MTH by western blotting. In Hec6 cells expressing wt p53, treatment with 20 nm MTH for 12 h initially significantly decreased MDM2 expression levels. This was followed by a subsequent increase in MDM2 expression (Fig. 3a). Although the MDM2 expression level recovered to basal values after 24 h MTH treatment, p53 stabilization had already occurred by this time point and it continued progressively through later samples. In other words, p53 stabilization preceded MDM2 up‐regulation, and the predominance of p53 activity over MDM2 continued as MDM2 expression level recovered to basal levels after 24‐h MTH treatment, resulting in high p53 transcriptional activation (Fig. 1b). MDM2 expression levels in Hec1 cells with similar treatment decreased transiently, but a subsequent increase was not observed. Previously, we showed that the down‐regulation of MDM2 expression levels by siRNA transfection stabilizes p53 and increases p21 expression levels in Hec6 and HHUA cells.( 20 ) Collectively, the down‐regulation of MDM2 expression levels by MTH contributes to the activation of p53.
Figure 3.
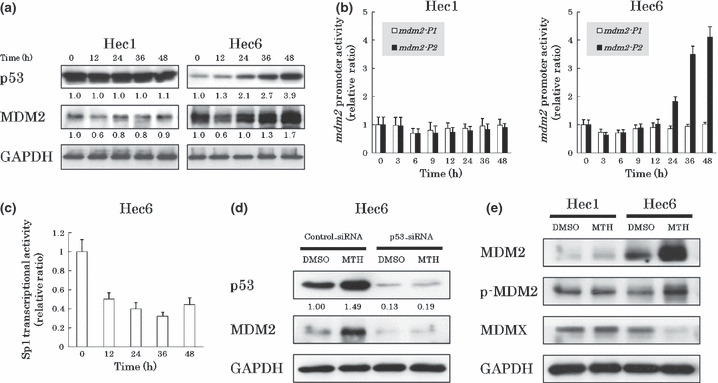
Mdm2‐P2 promoter activity is secondarily enhanced after treatment with mithramycin (MTH). (a) The change in MDM2 expression levels by MTH. The cells were treated with 20 nm MTH and analyzed for MDM2 expression levels every 12 h by western blotting. Expression levels of GAPDH were included as internal controls. Treatment with MTH for 12 h transiently and significantly decreased the MDM2 expression levels in both Hec1 and Hec6 cells. This was followed by a significant increase in MDM2 expression levels only in Hec6 cells. (b) MTH alters mdm2‐P1 and ‐P2 promoter activities. Hec1 and Hec6 cells were treated with 20 nm MTH and the promoter activities were analyzed after 0, 3, 6, 9, 12, 24, 36, 48 h by quantitative real‐time RT‐PCR. Experiments were performed in triplicate. Both mdm2‐P1 and ‐P2 promoter activities decreased in two cell lines after treatment with MTH for 3–6 h. The mdm2‐P2 activity markedly increased following treatment with MTH for 24–48 h only in Hec6 cells. (c) MTH alters Sp1 transcriptional activities. After transfection of the vectors into Hec6 cells, the cells were treated with DMSO or 20 nm MTH. Luciferase activities of DMSO‐treated and MTH‐treated cells were analyzed every 12 h. Data were normalized to controls at each time point. Experiments were performed in triplicate. Transcriptional activity of Sp1 was reduced in response to MTH and low levels of activity were maintained for 48 h in Hec6 cells. (d) p53‐dependent secondary MDM2 up‐regulation by MTH. siRNA transfected Hec6 cells were treated with DMSO or 20 nm MTH for 48 h and protein levels were analyzed. In the cells transfected with p53‐siRNA, the up‐regulation of MDM2 expression levels by MTH was not observed. (e) Induction of the active form of MDM2 by MTH. After treatment with 20 nm MTH for 48 h, the expression levels of MDM2, p‐MDM2, and MDMX in Hec1 and Hec6 cells were analyzed by western blotting. Expression levels of GAPDH were included as internal controls. p‐MDM2 expression levels were enhanced in parallel with total MDM2 expression levels, but MDMX expression levels were reduced in Hec6 cells.
To investigate the alteration in mdm2 promoter activity in response to MTH, we analyzed mdm2‐P1 and ‐P2 promoter activities by quantitative real‐time RT‐PCR. Both mdm2‐P1 and ‐P2 promoter activities decreased in both Hec1 and Hec6 cells after treatment with 20 nm MTH for 3–6 h (Fig. 3b). Consistent with the changes in MDM2 protein expression, the mdm2‐P2 promoter activities markedly increased after treatment with 20 nm MTH for 24–48 h in Hec6 cells but not in Hec1 cells. Similar enhancements of mdm2‐P2 promoter activities were observed in the cell lines expressing wt p53 (HHUA, KF, OVAS21) but not in SKOV3 with deleted p53 (Fig. S5).
To directly confirm Sp1 inhibition by MTH, we performed a reporter assay using a luciferase plasmid vector containing three Sp1 binding sequences (5′‐GGGGCGGGGC‐3′) in its promoter. After transfection of the vectors into Hec6 cells, we compared luciferase activities in the presence or absence of 20 nm MTH. Transcriptional activity of Sp1 was reduced in response to MTH and low levels of activity were maintained for 48 h in Hec6 cells (Fig. 3c). Moreover, we analyzed the promoter activities of other Sp1 target genes by quantitative real‐time RT‐PCR. Two cell lines, Hec1 expressing mt p53 and SKOV3 with deleted p53, were used to eliminate the influence of p53 function by MTH. Treatment of Hec1 and SKOV3 cells with 20 nm MTH for 24 h decreased the promoter activities of all the Sp1 target genes we profiled (c‐myc, c‐src, h‐tert, bcl‐xl, vegf) (Fig. S6). This implies that MTH functions as a general Sp1 inhibitor.
Next, to confirm that the secondary up‐regulation of MDM2 expression levels was p53‐dependent, we knocked‐down p53 in Hec6 cells with p53‐siRNA and compared the effects of MTH to cells transfected with control‐siRNA. When p53 was knocked‐down, we did not observe an increase of MDM2 expression level in response to 20 nm MTH for 48 h (Fig. 3d).
To verify that the up‐regulation of MDM2 in response to MTH contributed to p53 inactivation, we first measured the expression level of the active form of MDM2. The active form of MDM2 is phosphorylated at serine 166 (p‐MDM2), and translocates from the cytoplasm to the nucleus.( 28 ) We quantified the level of MDMX, an MDM2‐related protein ubiquitinated by MDM2 and degraded in a proteasome‐dependent manner.( 29 ) Phospho‐MDM2 expression levels were enhanced in parallel with total MDM2 expression levels and MDMX protein levels were reduced in Hec6 cells treated with 20 nm MTH for 48 h (Fig. 3e). In Hec1 control cells, the expression levels of p‐MDM2 and MDMX were unchanged. Next, we examined the subcellular localization of MDM2 by immunofluorescent staining. An increase in nuclear MDM2 expression was observed in MTH‐treated Hec6 cells (Fig. S7). The nuclear localization of MDM2 suggests binding to nuclear p53 and suppression of its activity resulting in attenuation of the anticancer effects of MTH.
Activation of the p53 signaling pathway is a specific function of MTH at low doses.
High‐dose MTH (200 ng/mL or 184 nm) inhibits the activities of PUMA and p21 because both promoters also possess Sp1 binding sites.( 22 ) However, low‐dose MTH (20 nm) enhanced their expression levels in a p53‐dependent manner in our study. To examine the dose‐specific function of MTH, we treated Hec1 cells (expressing mt p53) and Hec6 cells (expressing wt p53) with DMSO or 25–400 nm MTH for 48 h. In Hec6 cells, expression levels of p53, MDM2, PUMA, and p21 were markedly enhanced at 25–50 nm and reduced in a dose‐dependent manner at progressively higher doses of MTH (Fig. 4a). Reportedly, 200 ng/mL MTH (184 nm) induces the phosphorylation of p53 at serine 15 in human hepatoma HepG2 cells.( 22 ) Such an effect was not observed in our cells (data not shown). A DNA damage response (γH2AX expression) was detected at MTH concentrations higher than 100 nm (data not shown). In Hec6 cells, transcriptional activity by p53 was also maximally enhanced at 25–50 nm and reduced in a dose‐dependent manner at progressively higher doses of MTH (Fig. 4b). The changes of p53 transcriptional activities correlated with MDM2 expression levels. These results suggest that the secondary up‐regulation of MDM2 by MTH reflects the degree of p53 activity, and that the activation of the p53 signaling pathway by MTH specifically occurs at relatively low doses (<50 nm) of MTH.
Figure 4.
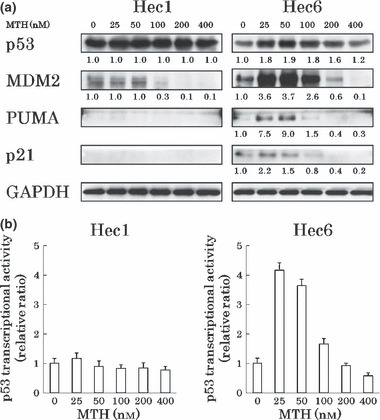
Specific p53 activation by low‐dose mithramycin (MTH). (a) Expression levels of p53 and its target genes at different doses of MTH. Hec1 and Hec6 cells were treated with DMSO or 25–400 nm MTH for 48 h and the protein levels were analyzed by western blotting. Protein levels of p53 and its downstream target genes were increased most prominently around 50 nm and were reduced in a dose‐dependent manner at progressively higher doses in Hec6 cells. (b) Alteration in p53 transcriptional activities at different doses in Hec6 cell of MTH. The experimental conditions were the same as above. p53 transcriptional activities correlated with the expression levels of p53 target genes.
MTH suppresses gynecologic cancer growth in vivo.
To assess the effects of MTH on tumor growth in vivo, we established tumor xenografts of the ovarian cancer cell line OVAS21 that expresses wt p53 in female athymic nu/nu mice. When PBS or MTH (600 μg/kg/day) was injected intraperitoneally three times a week for 4 weeks, significant growth suppressing effects were observed in mice treated with MTH compared to control mice (Fig. 5a). Tumorigenicity was not suppressed by MTH at doses <300 μg/kg/day (data not shown).
Figure 5.
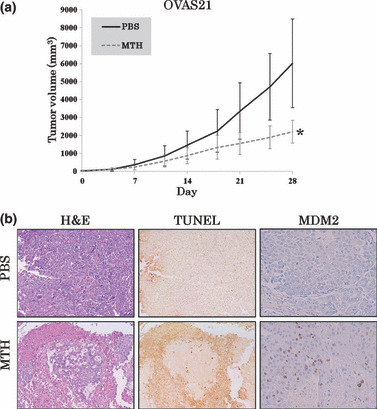
The effects of mithramycin (MTH) on human cancer xenografts in nude mice. (a) OVAS21 cells (5 × 10⁵) were inoculated subcutaneously into the hindquarters of mice. Once the tumors exceeded 5 mm in diameter (7 days after inoculation), PBS or MTH dissolved in PBS was injected intraperitoneally three times a week for 4 weeks. Data represent the average of eight mice per group; vertical bars indicate SDs. Growth suppressive effects were observed in mice following treatment with 600 μg/kg/day MTH compared with the control mice treated with PBS. *P < 0.005. (b) H&E staining (magnification: ×40), TUNEL assay (magnification: ×40), and MDM2 immunohistochemistry (magnification: ×100) on paraffin sections of the xenografts. In mice treated with 600 μg/kg/day of MTH, viable cancer cells were only present in small nests surrounded by necrosis. The TUNEL‐positive areas coincided with the necrotic areas in H&E staining; however, there were numerous isolated TUNEL‐positive cells located within the viable regions. MDM2‐positive cells were present near the necrotic areas.
We performed hematoxylin–eosin (H&E) staining, a TUNEL assay, and immunohistochemistry using MDM2 monoclonal antibody on paraffin sections of the tumor xenografts. In the control mice, H&E staining demonstrated predominantly viable tissues and TUNEL‐positive areas were restricted to the edges of the tissue sections (Fig. 5b). MDM2‐positive cells, which reflected p53 activation by MTH treatment, were not detectable with immunohistochemistry. In mice treated with MTH, viable cancer cells were only present in small nests surrounded by necrosis. The TUNEL‐positive areas corresponded to the necrotic areas in the H&E stained slides, but many isolated TUNEL‐positive cells in non‐necrotic areas were also observed. MDM2‐positive cells were observed near the necrotic area.
None of the mice developed significant weight loss, bone marrow suppression, electrolyte abnormalities, or liver and renal dysfunction in response to MTH (data not shown). These results demonstrate that MTH activates the p53 signaling pathway that results in the induction of cancer cell apoptosis and suppresses gynecologic tumor growth in mice without severe side effects, although this is accompanied with the simultaneous attenuation of p53 activity by secondary MDM2 up‐regulation.
Combination of MTH and nutlin‐3 effectively induces apoptosis of cancer cells through p53 activation.
MTH activates the p53 signaling pathway through the down‐regulation of MDM2. But this is followed by secondary up‐regulation of MDM2, being responsible for attenuation of the MTH inhibitory effect (Fig. 6a). Nutlin‐3 (NT3) is a drug that disrupts the MDM2–p53 interaction and activates the p53 pathway.( 30 ) In order to strengthen the effects of MTH, we examined the inhibitory effect of combined treatment of MTH and NT3. When HHUA cells expressing wt p53 were treated with either 10 nm MTH or 5 μm NT3, or both, cell growth was suppressed more effectively with the combination than with either drug individually (data not shown).
Figure 6.
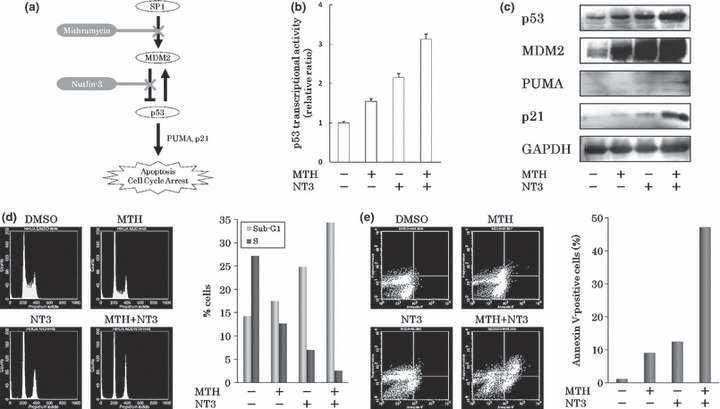
The effects of mithramycin (MTH) combined with nutlin‐3 (NT3). (a) Schema of MTH inhibitory effects on cancer cell growth. (b) The alteration in p53 transcriptional activities in response to MTH and/or NT3 by reporter assay. p53 transcriptional activity was most effectively enhanced when HHUA cells were treated with both 10 nm MTH and 5 μm NT3 for 48 h. Experiments were performed in triplicate. (c) Changes in p53 target gene expression levels following treatment with MTH and/or NT3 determined by western blotting. GAPDH protein levels were included as internal controls. The greatest increases in the levels of MDM2, PUMA, and p21 in HHUA cells were seen with combined treatment: 10 nm MTH and 5 μm NT3 for 48 h. (d). Alteration in cell cycle following treatment with MTH and/or NT3. Combined treatment with 10 nm MTH and 5 μm NT3 for 48 h resulted in the accumulation of cells in the sub‐G1 phase and a remarkable decrease in the percentage of cells in the S phase compared with the DMSO‐treated control. These results were reproduced three times. (e) Induction of apoptosis by MTH and/or NT3 treatment. Abscissas: Annexin V, Ordinates: PI. Combined treatment with 10 nm MTH and 5 μm NT3 for 48 h resulted in nearly 50% of cells becoming annexin V‐positive.
To examine the activation of p53 signaling pathway by the two drugs, the p53 transcriptional activity was measured by the reporter assay mentioned above. p53 transcriptional activity was most effectively enhanced when HHUA cells were treated with both drugs for 48 h (Fig. 6b). Additionally, after treatment with both drugs for 48 h, the protein levels of p53 and its target genes (MDM2, PUMA, and p21) were enhanced and correlated with p53 transcriptional activation (Fig. 6c).
Combined treatment with both drugs for 48 h resulted in the accumulation of cells in the sub‐G1 phase and a remarkable decrease in the percentage of cells in the S phase compared with control DMSO‐treated cells (Fig. 6d). In an apoptosis assay using annexin V‐PI staining and flow cytometry, combined treatment with both drugs for 48 h resulted in nearly 50% of the HHUA cells undergoing apoptosis (Fig. 6e). In contrast, treatment with either drug individually resulted in only 10% of cells undergoing apoptosis. This indicated that combined treatment with both drugs synergistically induced apoptosis. These results demonstrate that the combined treatment of MTH and NT3 strengthens the MTH effect on cancer cells by overcoming secondary MDM2 up‐regulation.
Discussion
As a competitive Sp1 inhibitor, MTH down‐regulates many genes containing GC‐rich sequences in their promoters.( 22 ) Elucidating the pharmacological mechanisms of MTH is complicated given the number of genes that are regulated by it. In this study, we were able to demonstrate the pharmacological mechanism of the anticancer effect of low‐dose MTH.
Sp1 binding sites are present in the mdm2‐P1 and ‐P2 promoters.( 7 , 10 ) Through the initial suppression of mdm2 promoter activity, MTH increased the p53 activity and the expression levels of p53 downstream target genes PUMA and p21, and induced G0/G1 arrest and apoptosis in the gynecologic cancer cell lines expressing wt p53. Although both PUMA and p21 promoters also possess Sp1 binding sites,( 22 ) low‐dose MTH (20 nm) enhanced their expression levels in a p53‐dependent manner, suggesting that the promoter activities of these genes are predominantly regulated by p53.
MTH reduced both mdm2‐P1 and ‐P2 promoter activities through Sp1 inhibition in gynecologic cancer cell lines; however, this effect was followed by an increase in mdm2‐P2 promoter activities due to p53 stabilization in the cell lines expressing wt p53. The induced MDM2 was in its active form, localized in the nucleus and presumably bound to p53. Over‐expression of MDM2 results in accelerated cancer progression and poor responsiveness to therapy,( 5 ) making it necessary to overcome the negative feedback response of MDM2 to MTH.
A single nucleotide polymorphism (SNP309G) in the mdm2‐P2 promoter increases the affinity of Sp1 to its binding site and up‐regulates mdm2‐P2 transcription.( 10 ) This implies that Sp1 inhibition by MTH in the mdm2‐P2 promoter may be attenuated by SNP309G. In this study, Hec1, HHUA, and OVAS21 are heterozygous for SNP309 (T/G). The remaining cell lines (Hec6, SKOV3, and KF) are homozygous for SNP309 (T/T) (data not shown). The cell growth inhibition (Figs 1a,S2) and up‐regulation of p53 target genes (Figs 1d,S3) by MTH showed no significant differences. Meanwhile, the secondary up‐regulation of mdm2‐P2 promoter activities by MTH increased markedly (Figs 3b,S5), and the enhancement of p53 transcriptional activity by MTH was comparatively modest (1, 6) in the cell lines heterozygous for SNP309 (T/G) compared to the others. The influence of SNP309G on the effect of MTH is not clear in this study and further analyses are required.
MTH activated the p53 signaling pathway and suppressed gynecologic cancer cell growth in vivo. In this study, the anticancer effects on human ovarian cancer xenografts in mice were observed when MTH was administered intraperitoneally at a dose of over 600 μg/kg/day, three times a week. No toxicity was evident at 4 weeks of treatment. MTH exhibits toxicity in mice; however, its effects are variable. In an in vivo study using a transgenic mouse model of Huntington’s disease (R6/2), daily treatment with MTH intraperitoneally at a dose of 300 and 600 μg/kg/day was associated with increased morbidity and mortality.( 31 ) The serum concentration of a single 2.5 mg/kg dose of MTH when administered intraperitoneally to C3H mice drops to 29% of the peak concentration 24 h following administration and further declines to 11% at 48 h.( 32 ) The single dose of MTH used in this study was high; however, the relatively long interval between injections possibly reduced the toxic effects. The optimal dose of MTH for humans is 25–30 μg/kg/day, administered for a maximum of 10 consecutive days. Though clinical trials will have to be conducted in human subjects to determine optimal doses and treatment intervals, low‐dose MTH is absolutely required to avoid its toxic effects.
Therefore, we evaluated the anticancer effect of combined treatment with MTH and NT3 to lessen the toxicity and increase the efficacy of MTH. MTH more effectively activated p53 and suppressed cancer cell growth when combined with NT3, since the MDM2–p53 interaction was blocked. Combined treatment of MTH and NT3 clearly showed a synergistic apoptotic response (Fig. 6e) but only additive effects in p53 transcriptional activity (Fig. 6b) in HHUA cells. In this study, we focused on the inhibition of mdm2 promoter activities by MTH, but MTH could inhibit many other Sp1 target genes (Fig. S6).( 26 ) Furthermore, NT3 also has p53‐independent functions including induction of apoptosis.( 33 , 34 , 35 ) These p53‐independent functions of MTH and NT3 may contribute to the synergistic increase in the apoptotic response in cancer cells. Based on the results of the present study, we propose that MTH should be considered as a chemotherapeutic agent in combination with NT3 for human cancers. Toxicity currently limits the widespread clinical use of MTH. The availability of new analogs with improved pharmacological and toxicological properties along with an improved understanding of their effects on gene expression may create new therapeutics using this class of compounds.( 26 ) In this study, we clarified the anticancer mechanism of low‐dose MTH. Because of its theoretically wide spectrum of effects, MTH may be effective in treating a variety of human malignancies.
Supporting information
Fig. S1. Expression levels of MDM2 in gynecologic cancer cell lines by western blotting. GAPDH protein levels were included as internal controls. The expression levels of MDM2 in all endometrial and ovarian cancer cell lines were enhanced compared with those in endometrial glandular cells (EMG) and ovarian surface epithelium (OSE), respectively. Treatment with mithramycin (MTH) (600 nM) for 24 h reduced expression levels of MDM2 in all cancer cell lines tested.
Fig. S2. Growth curves of gynecologic cancer cell lines treated with DMSO or mithramycin (MTH). After plating and cultivation, the cells were treated with DMSO (control) or MTH (20, 40, 60 nM). Viable cells were counted every other day. Experiments were performed in triplicate. Vertical bars indicate SDs.
Fig. S3. The change in p53 target gene expression levels following treatment with mithramycin (MTH). Cells were treated with 20 nM MTH and the expression levels of p53 target genes were analyzed every 12 h by western blotting. GAPDH protein levels were included as internal controls. The expression levels of p53, PUMA, and p21 were enhanced in HHUA and KF cells expressing wild‐type (wt) p53 but not in p53‐null SKOV3 cells. OVAS21 cells expressing wt p53, which expressed high levels of PUMA in the absence of MTH, showed no significant change in PUMA expression in response to MTH.
Fig. S4. Caspases 8, 9, 3/7 were activated by mithramycin (MTH). After treatment with DMSO or 20 nM MTH for 48 h, the cells were analyzed by flow cytometry using FLICA (fluorochrome inhibitor of caspases). Data represent the average and SDs of three independent experiments. Caspases 8, 9, and 3/7 were activated in Hec6 cells.
Fig. S5. The alterations in mdm2‐P1 and ‐P2 promoter activities following mithramycin (MTH) treatment. HHUA, SKOV3, KFm and OVAS21 cells were treated with 20 nM MTH for 48 h and the mdm2‐P1 and ‐P2 promoter activities were analyzed by quantitative real‐time RT‐PCR. Experiments were performed in triplicate. The mdm2‐P2 activities markedly increased in HHUA, KF, and OVAS21 cells expressing wild‐type (wt) p53 but not in SKOV3 cells deleted of p53.
Fig. S6. Inhibition of the transcription of Sp1 target genes by mithramycin (MTH). Hec1 and SKOV3 cells were treated with 20 nM MTH for 24 h. Transcript levels were determined by quantitative real‐time RT‐PCR. After treatment with MTH, the promoter activities of all Sp1 target genes were consistently decreased in the two cell lines.
Fig. S7. Subcellular localization of MDM2 in response to mithramycin (MTH). After treatment with DMSO or 20 nM MTH for 48 h, immunofluorescence staining was performed. An increase in the MDM2 expression level was observed in the nuclei of Hec6 cells (magnification: ×200).
Please note: Wiley‐Blackwell are not responsible for the content or functionality of any supporting materials supplied by the authors. Any queries (other than missing material) should be directed to the corresponding author for the article.
Supporting info item
Supporting info item
Supporting info item
Supporting info item
Supporting info item
Supporting info item
Supporting info item
Acknowledgment
This work was partly supported by grants from the Ministry of Education, Culture, Sports, Science and Technology of Japan (nos. 18659488, 20659259, and 21791562).
References
- 1. Momand J, Wu HH, Dasgupta G. MDM2 – master regulator of the p53 tumor suppressor protein. Gene 2000; 242: 15–29. [DOI] [PubMed] [Google Scholar]
- 2. Vogelstein B, Lane D, Levine AJ. Surfing the p53 network. Nature 2000; 408: 307–10. [DOI] [PubMed] [Google Scholar]
- 3. Oliner JD, Pietenpol JA, Thiagalingam S, Gyuris J, Kinzler KW, Vogelstein B. Oncoprotein MDM2 conceals the activation domain of tumor suppressor p53. Nature 1993; 362: 857–60. [DOI] [PubMed] [Google Scholar]
- 4. Michael D, Oren M. The p53‐Mdm2 module and the ubiquitin system. Semin Cancer Biol 2003; 13: 49–58. [DOI] [PubMed] [Google Scholar]
- 5. Freedman DA, Levine AJ. Regulation of the p53 protein by the MDM2 oncoprotein – thirty‐eighth G.H.A. Clowes Memorial Award Lecture. Cancer Res 1999; 59: 1–7. [PubMed] [Google Scholar]
- 6. Chang CJ, Freeman DJ, Wu H. PTEN regulates Mdm2 expression through the P1 promoter. J Biol Chem 2004; 279: 29841–8. [DOI] [PubMed] [Google Scholar]
- 7. Phillips A, Darley M, Blaydes JP. GC‐selective DNA‐binding antibiotic, mithramycin A, reveals multiple points of control in the regulation of Hdm2 protein synthesis. Oncogene 2006; 25: 4183–93. [DOI] [PubMed] [Google Scholar]
- 8. Deb SP. Cell cycle regulatory functions of the human oncoprotein MDM2. Mol Cancer Res 2003; 1: 1009–16. [PubMed] [Google Scholar]
- 9. Ries S, Biederer C, Woods D et al. Opposing effects of Ras on p53: transcriptional activation of mdm2 and induction of p19ARF. Cell 2000; 103: 321–30. [DOI] [PubMed] [Google Scholar]
- 10. Bond GL, Hu W, Bond EE et al. A single nucleotide polymorphism in the MDM2 promoter attenuates the p53 tumor suppressor pathway and accelerates tumor formation in humans. Cell 2004; 119: 591–602. [DOI] [PubMed] [Google Scholar]
- 11. Levav‐Cohen Y, Haupt S, Haupt Y. Mdm2 in growth signaling and cancer. Growth Factors 2005; 23: 183–92. [DOI] [PubMed] [Google Scholar]
- 12. Oehler MK, Brand A, Wain GV. Molecular genetics and endometrial cancer. J Br Menopause Soc 2003; 9: 27–31. [DOI] [PubMed] [Google Scholar]
- 13. Sherman ME, Bur ME, Kurman RJ. p53 in endometrial cancer and its putative precursors: evidence for diverse pathway of tumorigenesis. Hum Pathol 1995; 26: 1268–74. [DOI] [PubMed] [Google Scholar]
- 14. Ho SM. Estrogen, progesterone and epithelial ovarian cancer. Reprod Biol Endocrinol 2003; 1: 73–80. [DOI] [PMC free article] [PubMed] [Google Scholar]
- 15. Gudas JM, Nguyen H, Klein RC, Katayose D, Seth P, Cowan KH. Differential expression of multiple MDM2 messenger RNAs and proteins in normal and tumorigenic breast epithelial cells. Clin Cancer Res 1995; 1: 71–80. [PubMed] [Google Scholar]
- 16. Sheikh MS, Shao ZM, Hussain A, Fontana JA. The p53‐binding protein MDM2 gene is differentially expressed in human breast carcinoma. Cancer Res 1993; 53: 3226–8. [PubMed] [Google Scholar]
- 17. Imamura T, Arima T, Kato H, Miyamoto S, Sasazuki T, Wake N. Chromosomal deletions and K‐ras gene mutations in human endometrial carcinomas. Int J Cancer 1992; 51: 47–52. [DOI] [PubMed] [Google Scholar]
- 18. Enomoto T, Weghorst CM, Inoue M, Tanizawa O, Rice JM. K‐ras activation occurs frequently in mucinous adenocarcinomas and rarely in other common epithelial tumors of the human ovary. Am J Pathol 1991; 139: 777–85. [PMC free article] [PubMed] [Google Scholar]
- 19. Høgdall EV, Høgdall CK, Blaakaer J et al. K‐ras alterations in Danish ovarian tumour patients. From the Danish “Malova” Ovarian Cancer study. Gynecol Oncol 2003; 89: 31–6. [DOI] [PubMed] [Google Scholar]
- 20. Suga S, Kato K, Ohgami T et al. An inhibitory effect on cell proliferation by blockage of the MAPK/estrogen receptor/MDM2 signal pathway in gynecologic cancer. Gynecol Oncol 2007; 105: 341–50. [DOI] [PubMed] [Google Scholar]
- 21. Jayasuriya H, Lingham RB, Graham P et al. Durhamycin A, a potent inhibitor of HIV Tat transactivation. J Nat Prod 2002; 65: 1091–5. [DOI] [PubMed] [Google Scholar]
- 22. Koutsodontis G, Kardassis D. Inhibition of p53‐mediated transcriptional responses by mithramycin A. Oncogene 2004; 23: 9190–200. [DOI] [PubMed] [Google Scholar]
- 23. Gause GF. Olivomycin, mithramycin, chromomycin: three related cancerostatic antibiotics. Adv Chemother 1965; 2: 179–95. [DOI] [PubMed] [Google Scholar]
- 24. Brown JH, Kennedy BJ. Mihramycin in the treatment of disseminated testicular neoplasms. N Engl J Med 1965; 272: 111–8. [DOI] [PubMed] [Google Scholar]
- 25. Koller CA, Miller DM. Preliminary observations on the therapy of the myeloid blast phase of chronic granulocytic leukemia with plicamycin and hydroxyurea. N Engl J Med 1986; 315: 1433–8. [DOI] [PubMed] [Google Scholar]
- 26. Albertini V, Jain A, Vignati S et al. Novel GC‐rich DNA‐binding compound produced by a genetically engineered mutant of the mithramycin producer Streptomyces argillaceus exhibits improved transcriptional repressor activity: implications for cancer therapy. Nucleic Acids Res 2006; 34: 1721–34. [DOI] [PMC free article] [PubMed] [Google Scholar]
- 27. Phelps M, Phillips A, Darley M, Blaydes JP. MEK‐ERK signaling controls Hdm2 oncoprotein expression by regulating hdm2 mRNA export to the cytoplasm. J Biol Chem 2005; 280: 16651–8. [DOI] [PubMed] [Google Scholar]
- 28. Iwakuma T, Lozano G. MDM2, an introduction. Mol Cancer Res 2003; 1: 993–1000. [PubMed] [Google Scholar]
- 29. Marine JC, Dyer MA, Jochemsen AG. MDMX: from bench to bedside. J Cell Sci 2007; 120: 371–8. [DOI] [PubMed] [Google Scholar]
- 30. Vassilev LT, Vu BT, Graves B et al. In vivo activation of the p53 pathway by small‐molecule antagonists of MDM2. Science 2004; 303: 844–8. [DOI] [PubMed] [Google Scholar]
- 31. Ferrante RJ, Ryu H, Kubilus JK et al. Chemotherapy for the brain: the antitumor antibiotic mithramycin prolongs survival in a mouse model of Huntington’s disease. J Neurosci 2004; 24: 10335–42. [DOI] [PMC free article] [PubMed] [Google Scholar]
- 32. Kennedy BJ, Sandberg‐Wollheim M, Loken M, Yarbro JW. Studies with tritiated mithramycin in C3H mice. Cancer Res 1967; 27: 1534–8. [PubMed] [Google Scholar]
- 33. Lau LM, Nugent JK, Zhao X, Irwin MS. HDM2 antagonist Nutlin‐3 disrupts p73‐HDM2 binding and enhances p73 function. Oncogene 2008; 27: 997–1003. [DOI] [PubMed] [Google Scholar]
- 34. VanderBorght A, Valckx A, Van Dun J et al. Effect of an hdm‐2 antagonist peptide inhibitor on cell cycle progression in p53‐deficient H1299 human lung carcinoma cells. Oncogene 2006; 25: 6672–7. [DOI] [PubMed] [Google Scholar]
- 35. Paris R, Henry RE, Stephens SJ, McBryde M, Espinosa JM. Multiple p53‐independent gene silencing mechanisms define the cellular response to p53 activation. Cell Cycle 2008; 7: 2427–33. [DOI] [PMC free article] [PubMed] [Google Scholar]
Associated Data
This section collects any data citations, data availability statements, or supplementary materials included in this article.
Supplementary Materials
Fig. S1. Expression levels of MDM2 in gynecologic cancer cell lines by western blotting. GAPDH protein levels were included as internal controls. The expression levels of MDM2 in all endometrial and ovarian cancer cell lines were enhanced compared with those in endometrial glandular cells (EMG) and ovarian surface epithelium (OSE), respectively. Treatment with mithramycin (MTH) (600 nM) for 24 h reduced expression levels of MDM2 in all cancer cell lines tested.
Fig. S2. Growth curves of gynecologic cancer cell lines treated with DMSO or mithramycin (MTH). After plating and cultivation, the cells were treated with DMSO (control) or MTH (20, 40, 60 nM). Viable cells were counted every other day. Experiments were performed in triplicate. Vertical bars indicate SDs.
Fig. S3. The change in p53 target gene expression levels following treatment with mithramycin (MTH). Cells were treated with 20 nM MTH and the expression levels of p53 target genes were analyzed every 12 h by western blotting. GAPDH protein levels were included as internal controls. The expression levels of p53, PUMA, and p21 were enhanced in HHUA and KF cells expressing wild‐type (wt) p53 but not in p53‐null SKOV3 cells. OVAS21 cells expressing wt p53, which expressed high levels of PUMA in the absence of MTH, showed no significant change in PUMA expression in response to MTH.
Fig. S4. Caspases 8, 9, 3/7 were activated by mithramycin (MTH). After treatment with DMSO or 20 nM MTH for 48 h, the cells were analyzed by flow cytometry using FLICA (fluorochrome inhibitor of caspases). Data represent the average and SDs of three independent experiments. Caspases 8, 9, and 3/7 were activated in Hec6 cells.
Fig. S5. The alterations in mdm2‐P1 and ‐P2 promoter activities following mithramycin (MTH) treatment. HHUA, SKOV3, KFm and OVAS21 cells were treated with 20 nM MTH for 48 h and the mdm2‐P1 and ‐P2 promoter activities were analyzed by quantitative real‐time RT‐PCR. Experiments were performed in triplicate. The mdm2‐P2 activities markedly increased in HHUA, KF, and OVAS21 cells expressing wild‐type (wt) p53 but not in SKOV3 cells deleted of p53.
Fig. S6. Inhibition of the transcription of Sp1 target genes by mithramycin (MTH). Hec1 and SKOV3 cells were treated with 20 nM MTH for 24 h. Transcript levels were determined by quantitative real‐time RT‐PCR. After treatment with MTH, the promoter activities of all Sp1 target genes were consistently decreased in the two cell lines.
Fig. S7. Subcellular localization of MDM2 in response to mithramycin (MTH). After treatment with DMSO or 20 nM MTH for 48 h, immunofluorescence staining was performed. An increase in the MDM2 expression level was observed in the nuclei of Hec6 cells (magnification: ×200).
Please note: Wiley‐Blackwell are not responsible for the content or functionality of any supporting materials supplied by the authors. Any queries (other than missing material) should be directed to the corresponding author for the article.
Supporting info item
Supporting info item
Supporting info item
Supporting info item
Supporting info item
Supporting info item
Supporting info item