

Abstract
Previous gene expression profiles revealed the T‐lymphocyte maturation‐associated protein (MAL) gene as being frequently downregulated in head and neck cancer. To define the relationship between the MAL gene and the metastatic process, we evaluated the expression status of the gene in matched primary and metastatic tumors of head and neck cancer by semiquantitative reverse transcription–polymerase chain reaction. Furthermore, we aimed to identify potential genetic and epigenetic mechanisms associated with downregulation of MAL, including loss of heterozygosity (LOH), mutation, and hypermethylation. Thirty‐five cell lines of University of Turko squamous cell carcinoma (UT‐SCC) series derived from head and neck cancer, including nine pairs from matched primary and metastatic tumors, and 30 pairs of matched primary and metastatic tumor samples were analyzed. Twenty out of 35 (57%) cell lines showed downregulation of MAL expression, whereas no expression was found in 10 cell lines (29%). Considering matched primary and metastatic tumor‐derived cell‐line pairs, four pairs showed decreased expression only in metastasis‐derived cells compared with their primary counterparts. Expression analysis of 21 tissue samples demonstrated decreased or no expression of MAL mRNA in 43% of metastatic tumors compared with matched primary tumors. Relating to mechanisms of downregulation, LOH was observed in 30% of primary tumors and 38% of their metastatic counterparts by a MAL‐specific microsatellite marker. Furthermore, we found restoration of MAL mRNA after treatment with demethylating agent (5‐aza‐2′‐deoxycytidine) in 9 (45%) out of 20 cell lines. No mutation was found in UT‐SCC cell lines. In conclusion, our findings indicate selective downregulation of MAL expression in metastatic cells, suggesting the MAL gene as a new metastasis‐suppressor candidate for head and neck cancer. LOH and hypermethylation appeared to be important mechanisms for inactivation of MAL function. (Cancer Sci 2009; 100: 873–880)
The general prognosis of patients with head and neck squamous cell carcinoma (HNSCC) has not improved significantly, despite major advances having been obtained in terms of early detection, surgical resection, and chemoradiation protocols.( 1 ) The poor outcome has mainly been attributed to local and distant lymph node metastasis as well as recurrence. The presence of cervical lymph node metastases is a common and adverse event in HNSCC and decreases the survival of patients by approximately 50%.( 2 )
The ability to assess or predict the presence of metastasis has significant prognostic relevance and treatment implications in the management of HNSCC. In order to decrease morbidity and mortality from HNSCC, it is necessary to gain a greater understanding of metastasis and define the molecular factors that contribute to this process. Recently, a set of molecules has been discovered called metastasis suppressors, and loss of their expression could enable cancer cells to acquire metastatic competency.( 3 ) This loss of gene expression may be due to loss of heterozygosity (LOH), somatic mutation, or epigenetic mechanisms such as promoter hypermethylation. It is hypothesized that metastasis‐suppressor proteins function through restoring normal homeostatic signaling mechanisms, which inhibit the acquisition of several novel phenotypes by tumor cells that are necessary for metastasis.
Discovery of HNSCC‐related metastasis‐suppressor genes and their mechanisms of action are important for the development of novel strategies in the prevention and treatment of metastatic tumors. To identify the potential suppressors of tumor metastasis in HNSCC, we first reviewed previous studies on gene expression profiles of HNSCC patients using cDNA microarrays.( 4 , 5 , 6 , 7 ) We defined the T‐lymphocyte maturation‐associated protein (MAL) gene as one of the most frequently downregulated genes in HNSCC.
The MAL gene encodes a membrane proteolipid with several hydrophobic domains. It was initially identified as a component of the protein machinery for apical transport in epithelial polarized cells.( 8 , 9 ) Furthermore, recent reports have suggested additional functions for MAL–glycosphingolipid complexes in signaling, cell differentiation, and membrane trafficking processes in epithelial cells;( 10 , 11 ) however, there was no previous information of a relationship between MAL and metastasis.
In the present study, to define the role of the MAL gene in the metastatic process of HNSCC, we assessed the expression status of the gene both in metastatic tumors and cell lines derived from metastatic tumor tissues of HNSCC compared to their primary tumor counterparts. Furthermore, we also evaluated potential genetic and epigenetic mechanisms, including LOH, mutation, and hypermethylation related to the downregulation of MAL expression.
Materials and Methods
Cell lines. In total, 35 cell lines derived from human HNSCC with different sites of origin were used in this study. Almost all cell lines belonged to the University of Turko squamous cell carcinoma (UT‐SCC) series established at the University of Turku, Finland, whereas only OKK‐TK was developed at Wakayama Medical University. The cell lines were cultured in RPMI‐1640 supplemented with 10% fetal bovine serum in a 5% CO2 incubator at 37°C. The clinicopathological details of the cell lines are shown in Table 1.
Table 1.
Clinicopathological characteristics of tumor cell lines derived from head and neck squamous cell carcinoma
| Cell line | Age (years) | Sex | Primary site | TNM † | Specimen site | Grade |
|---|---|---|---|---|---|---|
| UT‐SCC‐7 ‡ | 67 | Male | Temporal region skin | T1N0M0 | Neck metastasis | moderate |
| UT‐SCC‐9 | 81 | Male | Larynx‐glottic | T2N1M0 | Neck metastasis | low |
| UT‐SCC‐17 ‡ | 65 | Male | Larynx‐supraglottic | T2N0M0 | Sternum metastasis | high |
| UT‐SCC‐26A | 60 | Male | Hypopharynx | T1N2M0 | Neck metastasis | moderate |
| UT‐SCC‐42B | 43 | Male | Larynx‐supraglottic | T4N3M0 | Neck metastasis | high |
| UT‐SCC‐58 | 63 | Male | Larynx‐transglottic | T4N1M0 | Neck metastasis | low |
| UT‐SCC‐59A ‡ | 81 | Male | Temporal region skin | T1N3M0 | Neck metastasis | high |
| UT‐SCC‐61 ‡ | 90 | Female | Lower lip | T1N0M0 | Neck metastasis | low |
| UT‐SCC‐62 ‡ | 56 | Male | Hypopharynx | T4N0M0 | Neck metastasis | moderate |
| UT‐SCC‐64 | 66 | Male | Unknown | TxN3M0 | Neck metastasis | high |
| UT‐SCC‐71 ‡ | 79 | Female | Gingivae | T2N0M0 | Neck metastasis | low |
| UT‐SCC‐77 ‡ | 50 | Male | Tongue | T1N0M0 | Neck metastasis | moderate |
| UT‐SCC‐79A ‡ | 80 | Female | Facial skin | T2N0M0 | Parotis metastasis | moderate |
| UT‐SCC‐84 ‡ | 89 | Female | Tongue | T1N0M0 | Neck metastasis | moderate |
| UT‐SCC‐90 § | 35 | Male | Tongue | T1N0M0 | Local recurrence | moderate |
| UT‐SCC‐104 | 80 | Male | Larynx‐ventricle | T1N2AM0 | Neck metastasis | moderate |
| UT‐SCC‐115 ‡ | 92 | Female | Auricula skin | T2N2AM0 | Neck metastasis | moderate |
| Cell line pairs derived from matched primary and metastatic tumors | |||||||||
|---|---|---|---|---|---|---|---|---|---|
| P ¶ | M †† | Age (years) | Sex | Primary site | TNM | Metastatic site | P ¶ | M †† | |
| UT‐SCC‐6 | A § | B | 51 | Female | Supraglottic larynx | T2N1M0 | Neck metastasis | low | low |
| UT‐SCC‐12 | A | B ‡ | 81 | Female | Nasal skin | T2N0M0 | Neck metastasis | low | moderate |
| UT‐SCC‐16 | A | B ‡ | 77 | Female | Tongue | T3N0M0 | Neck metastasis | high | high |
| UT‐SCC‐24 | A | B ‡ | 41 | Male | Tongue | T2N0M0 | Neck metastasis | moderate | moderate |
| UT‐SCC‐54 | A | C ‡ | 58 | Female | Buccal mucosa | T2N0M0 | Neck metastasis | low | NA |
| UT‐SCC‐60 | A | B | 59 | Male | Tonsil | T4N1M0 | Neck metastasis | low | low |
| UT‐SCC‐74 | A | B | 31 | Male | Tongue | T3N1M0 | Neck metastasis | low | moderate |
| UT‐SCC‐110 | A § | B ‡ | 37 | Male | Maxillary sinus | T4N0M0 | Neck metastasis | NA | NA |
| OKK‐TK | P | M | Male | Maxillary sinus | Neck metastasis | NA | NA | ||
† According to the International Union Against Cancer 1997 TNM classification system; ‡ cell lines derived from neck recurrence; §cell lines derived from local recurrence; ¶cell lines derived from primary tumor; ††cell lines derived from metastatic tumor; NA: nor available.
Patients and tissue samples. Primary tumor and metastatic tumor samples together with their matched normal counterparts were obtained from 30 patients with HNSCC between 1994 and 2000 at the Department of Otolaryngology Okayama University Hospital (Okayama, Japan) with acquisition of written informed consent from each patient. All tissue samples were frozen in liquid nitrogen immediately after surgery and stored at –80°C until DNA extraction. Patients included 26 men and four women with a mean age of 66.1 years (range, 47–81 years). The clinicopathological details of the patients are shown in Table 2. All of the tumor and normal tissues of each pair were examined by hematoxylin–eosin staining, which revealed that all tumor samples were squamous cell carcinoma, and normal tissues were confirmed for their normal histology. The bioethics committee of the institution approved the study.
Table 2.
mRNA expression and loss of heterozygosity (LOH) analysis of T‐lymphocyte maturation‐associated protein (MAL) and clinical characteristics of patients
| Case | MAL exp † | MAL‐MS1 | Age (years) | Sex | Localization | TNM ‡ | ||
|---|---|---|---|---|---|---|---|---|
| Primary | Metastasis | |||||||
| 1 | 0.02 | L | ND | ND | 65 | M | Oral cavity | T3N2M0 |
| 2 | ND | NI | NI | 70 | F | Oral cavity | T1N1M0 | |
| 3 | 6.73 | H | Ret | Ret | 70 | M | Oropharynx | T3N1M0 |
| 4 | 4.42 | H | NI | NI | 55 | M | Hypopharynx | T1N2M0 |
| 5 | 1.58 | H | Ret | Ret | 53 | F | Oral cavity | T4N1M0 |
| 6 | ND | LOH | LOH | 81 | M | Larynx | T3N2M0 | |
| 7 | 1.37 | N | Ret | ND | 73 | M | Larynx | T4N2M0 |
| 8 | ND | LOH | LOH | 75 | F | Maxilla | T4N2M0 | |
| 9 | ND | LOH | LOH | 47 | M | Oral cavity | T2N3M0 | |
| 10 | 0.69 | N | Ret | Ret | 65 | M | Oropharynx | T1N2M0 |
| 11 | ND | Ret | Ret | 69 | M | Larynx | T3N2 cM0 | |
| 12 | 6.71 | H | Ret | Ret | 58 | M | Hypopharynx | T3N1M0 |
| 13 | 0.01 | L | Ret | Ret | 79 | M | Larynx | T4N2 cM0 |
| 14 | 4.21 | H | NI | NI | 53 | M | Hypopharynx | T3N1M0 |
| 15 | 0.01 | L | Ret | Ret | 68 | M | Hypopharynx | T4N3M0 |
| 16 | 3.92 | H | LOH | LOH | 57 | M | Hypopharynx | T4N2M0 |
| 17 | 0.19 | L | Ret | LOH | 69 | M | Hypopharynx | T3N2M0 |
| 18 | ND | Ret | Ret | 68 | F | Oral cavity | T4N2M0 | |
| 19 | 0.35 | L | NI | NI | 59 | M | Larynx | T3N2aM0 |
| 20 | 1.73 | H | Ret | Ret | 57 | M | Oropharynx | T4N1M0 |
| 21 | 2.26 | H | Ret | Ret | 72 | M | Oral cavity | T3N1M0 |
| 22 | ND | Ret | LOH | 67 | M | Oral cavity | T3T2 bM0 | |
| 23 | ND | NI | NI | 71 | M | Oropharynx | T3N1M0 | |
| 24 | 0.90 | N | LOH | ND | 66 | M | Hypopharynx | T4N2M0 |
| 25 | ND | ND | Ret | 76 | M | Oropharynx | T2N2M0 | |
| 26 | 0.54 | L | LOH | LOH | 68 | M | Oropharynx | T2N3M0 |
| 27 | 0.04 | L | Ret | Ret | 73 | M | Oral cavity | T4N2 bM0 |
| 28 | 0.26 | L | Ret | Ret | 66 | M | Larynx | T2N2 bM0 |
| 29 | 0.17 | L | Ret | ND | 63 | M | Hypopharynx | T3N2 cM0 |
| 30 | 1.56 | H | LOH | LOH | 71 | M | Hypopharynx | T2N2 bM0 |
Ratio of expression levels was described in Materials and Methods.
According to the International Union Against Cancer 1997 TNM classification system.
F, female; H, high mrna expression; L, low mrna expression; M, male; N, normal mrna expression; ND, not done; NI, not informative; Ret, retention of allele.
RNA isolation, cDNA preparation, and reverse transcription–polymerase chain reaction analysis. Total RNA was prepared by using a modified acid guanidinium phenol–chloroform method (Isogen; Nippon Gene Co., Tokyo, Japan). Total RNA was reverse‐transcribed with the SuperScript First‐Strand Synthesis system (Invitrogen, Tokyo, Japan) starting with 5 µg total RNA from each sample, according to the procedures provided by the supplier. Expression of MAL mRNA in paired primary and metastatic tumor tissues was examined by semiquantitative reverse transcription (RT)–polymerase chain reaction (PCR) using glyceraldehyde 3‐phosphate dehydrogenase (GAPDH) mRNA as a control. One µL of each RT reaction was amplified in 50 µL mixture containing 5 µL 10× PCR buffer, 4 µM dNTP mixture containing 2.5 mM of each deoxynucleotide triphosphate, 10 pmol of each primer, and 1.25 U rTaq DNA polymerase (Takara Bio, Shiga, Japan). Thirty‐five PCR cycles for the MAL primers RT‐S and RT‐AS, and 25 cycles for the GAPDH primers S1 and AS1 (Table 3) were used for amplification (primers designed using Genetyx‐Win 5.0.0; Software Development Co., Tokyo, Japan). An initial denaturation step at 94°C for 3 min was followed by 35 cycles of a denaturation step at 94°C for 30 s, an annealing step at 60°C for 1 min, and an extension step at 72°C for 1 min. A final extension step at 72°C for 7 min was added. Reproducibility was confirmed by processing all samples twice.
Table 3.
Primers used for expression and mutation analysis
| Gene | Exon | Site | Sequence (5′–3′) |
|---|---|---|---|
| MAL | 1 | F | GAGCCAGCGAGAGGTCTG |
| R | TTCCCCTCATTCTGTTGGTC | ||
| 2 | F | ATGCCTGCCCTGTTCTCTTTG | |
| R | CTCACCTGGCACTGGAAAAGC | ||
| 3 | F | CCCCACAGCAGTGAAGTGAGA | |
| R | CTAGGCAGCCTCCACACACAC | ||
| 4 | F | GATGCAGTGCAGACGCTGTG | |
| R | TCCACCATCAAGGGCATTTCT | ||
| MAL | RT‐S | CAGTGGCTTCTCGGTCTTCAC | |
| RT‐AS | GTAAACACAGCACCCACGAGC | ||
| Glyceraldehyde‐3‐ phosphate dehydrogenase | S1 | AGACCACAGTCCATGCCA TCAC | |
| AS1 | GGTCCACCACCCTGTTGCTGT | ||
| MAL‐MS1 | F | CCCAGCACGTAACTCCTCTT | |
| R | CACTGTGGGTGAAGCTGATG | ||
| MAL‐MS2 | F | TACCCAGCACAGAAACTCTC | |
| R | CGTGAGCTTTCCTCTGACTC |
MAL, T‐lymphocyte maturation‐associated protein; F, forward primer; R, reverse primer; RT‐S, sense primer for complementary DAN; RT‐AS, anti‐sense primer for complementary DNA; S1, sense1; AS1, anti‐sense primer.
Quantification of the RT‐PCR products. PCR products were separated through a 2% agarose gel and stained with ethidium bromide. The intensity of ethidium bromide staining of each band was measured by a CCD image sensor (Gel Print 2000/VGA; Toyobo, Osaka, Japan) and analyzed by a computer program for band quantification (Quantity One; Toyobo). The value of metastasis‐specific MAL expression was determined by calculating the ratio of the expression levels in the tumor and in the matched primary tumor sample, each of which was normalized for the corresponding GAPDH expression level (M, MAL/GAPDH expression ratio in metastatic tumor samples; T, MAL/GAPDH expression ratio in matched primary tumor samples; M/T ratio, relative MAL expression in metastatic tumor samples compared with their matched primary tumors after normalization). Decreased and increased expression levels were determined as classes L and H when this ratio was less than 0.6 and greater than 1.4, respectively, as reported previously.( 12 ) Class N (normal expression) was a ratio value between 0.6 and 1.4.
Quantitative real‐time RT‐PCR. To confirm the validity of the semiquantitative RT‐PCR expression data, the MAL mRNA levels in HNSCC cell lines were assessed by quantitative real‐time RT‐PCR carried out on an ABI Prism 7500 Sequence Detection System (Applied Biosystems, Foster City, CA, USA). The real‐time PCR was carried out in a final volume of 20 µL for each microtube containing 1 µL cDNA sample, 10 µL of 2× TaqMan Universal Master Mix with AmpErase uracil‐N‐glycosylase, and 600 nM primers and MAL probe. For primers and GAPDH probe (endogenous control gene), 1 µL of 20× TaqMan Gene Expression Assay (Applied Biosystems) was used. The thermocycle program was set at 50°C for an initial hold for 2 min and 95°C for 10 min, followed by 40 cycles of denaturation at 95°C for 15 s, annealing at 60°C, and extension at 60°C for 1 min. All samples were run in triplicate. RQ Study Software (Applied Biosystems, Foster City, CA, USA) analyzed the amplification results by a comparative method (ΔΔCt) to define the relative quantification of MAL as a fold change. The primer and probe sets used for MAL amplification were as follows: forward primer, 5′‐CCT GCC CAG TGG CTT CTC; reverse primer, 5′‐GGA GGA GGC CAC CAG GAT; and TaqMan probe (VIC) 5′‐CCC GAC TTG CTC TTC ATC TTT GAG TTT AT‐(TAMRA) as reported by Tracey et al.( 13 ) For GAPDH (endogenous control), the primer and probe set of the TaqMan Gene Expression Assay (Hs99999905_m1; Applied Biosystems) was used.
Immunofluorescence analysis. Cells were seeded at 5 × 10⁴ per well in eight‐well chambered coverslips and cultured overnight. Sections were fixed in acetone for 10 min at 4°C. After blocking in 1% bovine serum albumin, the cells were incubated with primary antibody (MAL [H‐70], 1:70; Santa Cruz Biotechnology, Santa Cruz, CA, USA) for 1 h at room temperature. The secondary antibody was Texas Red‐conjugated goat‐anti rabbit IgG (1:100; Santa Cruz Biotechnology). Sections were mounted with Ultracruz Mounting Medium with 4′,6‐diamidino‐2‐phenylindole (Santa Cruz Biotechnology) to stain cell nuclei. All experiments were carried out in the absence of primary, secondary, or both antibodies as negative controls. Immunofluorescence images were captured using an Eclipse E800 microscope (Nikon, Tokyo, Japan). Identical acquisition methods were used for all samples to allow direct comparison of the resulting images. Quantification of immunofluorescence signal was conducted using Image‐Pro plus 4.0 software (Media Cybernetics, Silver Springs, MD, USA). Measurements were made for the total intensity of immunofluorescent staining using 10 images of areas within each slide and separate measurements were made for each cell to achieve the average intensity per 100 cells.
5‐Aza‐2′‐deoxycytidine treatment. To examine MAL expression in response to treatment with 5‐aza‐2′‐deoxycytidine (5‐aza‐CdR) (Sigma, St Louis, MO, USA), cell lines were incubated for 72 h with 4 µM 5‐aza‐CdR, and then harvested for RNA extraction and RT‐PCR.
DNA isolation. Genomic DNA was isolated from frozen tissue samples and cell line cultures by sodium dodecylsulfate–proteinase K treatment, phenol–chloroform extraction, and ethanol precipitation. Although tissue samples were not microdissected, hematoxylin–eosin staining during initial diagnosis revealed that normal tissue from each pair did not contain tumor cells, and that the tumor cell ratio in each tumor tissue sample was over 70%.
Microsatellite analysis. LOH analysis was carried out with the MAL‐specific microsatellite marker MAL‐MS (Table 3). The mapping information and sequences were obtained from recent genomic information at http://www.ncbi.nlm.nih.gov/genome/guide/human. The heterozygosity and repeat numbers of the tandem nucleotide repeats for the design of microsatellite markers were acquired from the information site http://www.gramene.org/db/searches/ssrtool. The primers were designed based on the contiguous genomic sequence (NT_026970) using Genetyx‐Win 5.0.0. The procedure for analysis has been described previously.( 14 ) Briefly, after sense primers were labeled with 5‐iodoacatamidefluorescein, PCR was carried out in 20 µL reaction mixture containing 10 pmol of each primer, 100 ng genomic DNA, 1× PCR buffer, 200 µM of each deoxynucleoside triphosphate, and 0.5 U Taq DNA polymerase (Takara, Kyoto, Japan). The PCR products were applied to an ABI Prism 3100 DNA sequencer (Applied Biosystems) and analyzed using Genescan analysis software version 3.7 (Applied Biosystems).
Mutation analysis of MAL. Four coding exons of the MAL gene were amplified with intron‐spanning primers designed using Genetyx‐Win 5.0.0 software. The primers are listed in Table 3. PCR was carried out as described above. PCR products were purified using ExoSAP‐IT (USB, Cleveland, OH, USA) prior to sequence‐specific PCR. Purified PCR products were reamplified with a BigDye terminator sequencing kit (v1.1 cycle sequencing kit; Applied Biosystems), ethanol precipitated, and direct sequenced on an automated capillary sequencer using the primers above (ABI Prism 310). Any detected nucleotide change was confirmed by independent PCR amplification and sequencing.
Results
Expression analysis of MAL mRNA in HNSCC cell lines. We evaluated the expression level of MAL mRNA in 35 HNSCC cell lines, including 26 nodal metastasis‐derived cell lines. Furthermore, nine cell line pairs established from matched primary and metastatic tumors of the same patients were also included. Semiquantitative RT‐PCR was carried out using primers designed to encompass the exon–intron junctions on the cDNA in order to eliminate the potential contamination of genomic DNA. Out of 26 metastatic cell lines, 17 (65%) showed downregulation of MAL expression, whereas only four out of nine primary tumor‐derived cell lines displayed downregulation. Moreover, no expression was found in 10 cell lines (29%), including eight metastasis‐derived cell lines. Considering primary and metastatic tumor‐derived cell line pairs, four cell line pairs showed decreased or no expression in both, whereas four cell line pairs showed decreased expression only in the metastatic cell lines compared with their primary counterparts (Fig. 1a).
Figure 1.
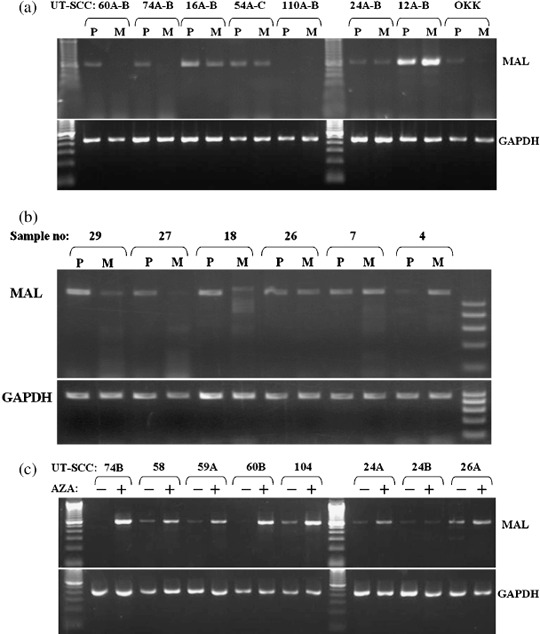
Expression analysis of T‐lymphocyte maturation‐associated protein (MAL) mRNA in head and neck squamous cell carcinoma (HNSCC) cell lines and tumor tissues by reverse transcription–polymerase chain reaction (RT‐PCR). (a) Expression of the MAL gene in eight representative HNSCC cell line pairs derived from matched primary (P) and metastatic (M) tumors. The UT‐SCC‐60, 74, 16, and OKK‐TK metastasis‐derived cell lines had no or substantially reduced expression compared to their primary tumor‐derived cell line counterparts. Only the UT‐SCC‐12 cell line pair displayed strong bands in both cell lines, whereas the other cell line pairs showed absent or significantly reduced bands in both cell lines. (b) Expression of the MAL gene in matched primary tumor (P) and metastatic tumor (M) of the lymph node: samples 29, 27, 18, and 26 showed decreased expression of MAL in metastatic tissues compared with primary tumors. Upper numbers show sample numbers. Lower panels represent expression of the housekeeping gene glyceraldehyde‐3‐phosphate dehydrogenase (GAPDH). (c) Restoration of MAL expression by demethylation. UT‐SCC cells were left untreated (–) or treated (+) with 4 µM 5‐aza‐2′‐deoxycytidine (AZA) for 72 h and were analyzed by RT‐PCR: UT‐SCC‐74B, 58, 59A, 60B, 104, and 24A showed restoration of MAL expression.
Expression analysis of MAL mRNA in primary and metastatic tumor tissues. We analyzed the expression level of MAL mRNA in 21 metastatic tumor samples, comparing them with their paired primary tumor tissues by semiquantitative RT‐PCR (Fig. 1b; Table 2). Expression analysis demonstrated decreased expression of MAL mRNA in 9 out of 21 metastatic tumors (43%), including two samples with no detectable expression compared with those of matched primary tumor samples. Three of the samples (14%) showed a similar level of expression in primary and metastatic tumors, whereas nine of the samples (43%) appeared to have increased expression of MAL in metastatic tumor tissues.
Real‐time RT‐PCR also confirmed the results of semiquantitative RT‐PCR in the pairs of primary and metastatic tumor‐derived cell lines. Out of eight cell line pairs, four displayed remarkable decreases of MAL expression in the metastasis‐derived cell lines compared with their primary counterparts (Fig. 2a).
Figure 2.
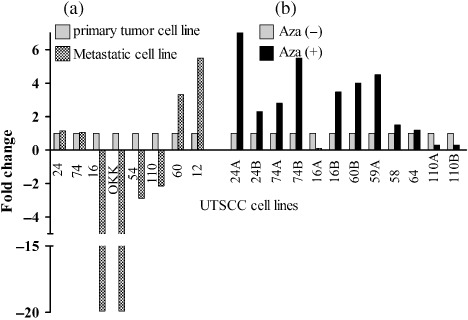
Confirmation of the expression levels of T‐lymphocyte maturation‐associated protein (MAL) mRNA by real‐time polymerase chain reaction. (a) Comparison of MAL expression levels between primary tumor‐originated and metastasis‐originated UT‐SCC cell lines. (b) Comparison of MAL expression levels before (Aza–) and after demethylating agent treatment (Aza+) of UT‐SCC cell lines.
Restoration of MAL mRNA expression after 5‐aza‐CdR treatment. Potential CpG islands in the MAL promoter were detected according to the CpGplot algorithm (http://www.ebi.ac.uk/emboss/cpgplot/). To determine whether methylation of MAL is associated with transcriptional silencing, we examined and compared the expression of MAL mRNA before and after treatment with 5‐aza‐CdR, a demethylating agent, by RT‐PCR in 20 cell lines (Fig. 1c). We found restoration of MAL mRNA after 5‐aza‐CdR treatment in 9 (UT‐SCC‐24A, 26A, 58, 59A, 60B, 64, 74A‐B, and 104) of 20 (45%) demethylated cell lines. An increase in MAL mRNA expression was not detected in 11 cell lines (UT‐SCC‐6A, 9, 12A, 24B, 54C, 61, 62, 71, 77, 90, and 110A), including five cell lines with no MAL expression.
Real‐time RT‐PCR validated the results of semiquantitative RT‐PCR concerning restoration of MAL mRNA after demethylation. We analyzed the expression status of MAL in 12 cell lines before and after treatment with 5‐aza‐CdR and 58% (7/12) showed more than two‐fold upregulation of expression related with demethylation (Fig. 2b).
Immunofluorescence analysis of MAL protein. To validate the expression of MAL protein, we carried out immunofluorescence analysis in two cell line pairs: UT‐SCC‐16A with UT‐SCC‐16B, and OKKP with OKKM. The metastasis‐originated cell lines UT‐SCC‐16B and OKKM demonstrated 55 and 40% decreases of the immunofluorescence signal, respectively, compared to their primary counterparts (Fig. 3).
Figure 3.
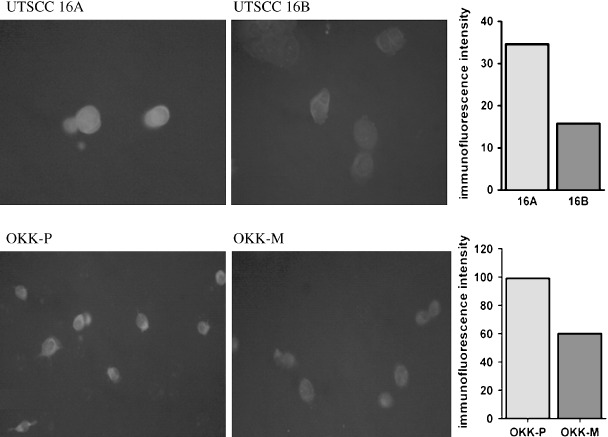
Representative images of T‐lymphocyte maturation‐associated protein (MAL) expression as determined by immunofluorescence microscopy (Texas Red). Comparative values of immunofluorescence intensity averages for primary tumor‐originated cell lines (16A and OKK‐P) and their metastasis‐originated counterparts (16B and OKK‐M) are given on the right.
Mutation analysis of MAL. We also examined the mutation status of exons 1–4 of MAL in our 24 head and neck cancer cell lines. Exon–intron boundaries were established from the National Center for Biotechnology Information sequence database. PCR amplicons were designed to span all four coding exons of MAL by Genetyx software. All coding exons and exon–intron junctions of MAL were screened for mutation by PCR amplification and subsequent direct sequencing. Sequence analysis of each cell line demonstrated no nucleotide substitution in exons 1–4 of MAL.
Loss of heterozygosity status of the MAL locus. We examined the LOH status of the MAL locus using the highly polymorphic microsatellite marker MAL‐MS in 29 matched normal and HNSCC tissues. The MAL‐MS marker is located approximately 165 kb centromeric to the MAL gene (contiguous sequence NT_026970 and Human Genome Resources; http://www.ncbi.nlm.nih.gov/genome/guide/human). LOH status was analyzed in primary tumors and their metastatic counterparts separately. Microsatellite analysis showed 30% of LOH frequency in primary tumors and 38% in metastatic counterparts. Considering the close localization of the microsatellite with MAL and the high LOH percentage of each marker, these results suggest that LOH is an important genetic mechanism in loss of function for MAL in metastatic tumors. Representative samples of informative cases and those with LOH are shown in Figure 4.
Figure 4.
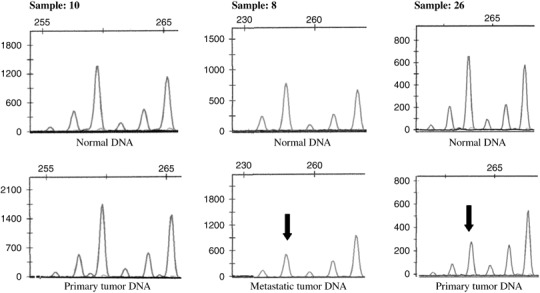
Representative electropherograms of loss of heterozygosity (LOH) analysis on the T‐lymphocyte maturation‐associated protein gene locus by microcapillary electrophoresis and data analysis. LOH was scored by comparing the peak heights of tumors and matched normal gene alleles. The arrows mark the lost allele of samples 8 and 26 in primary tumor and metastasis, respectively, whereas sample 10 represents retention.
Discussion
Tumor masses consist of heterogenic subpopulations of cancer cells. According to cancer stem cell theory, only a specific subpopulation of these cells has the ability to sustain cancer growth and metastatic activity, whereas all of the other cancer cells have only a limited growth potential or no growth potential at all. Based on this concept, to define the aggressiveness of a tumor, it is mandatory to analyze the molecular characteristics of metastatic cell populations as an appropriate representative of cancer stem cells.
In the present study, we found downregulation of MAL gene expression both in cell lines derived from lymph node metastasis (65%) and metastatic tumor tissues (43%) in lymph nodes compared with their primary tumor counterparts of HNSCC. Interestingly, in four cell line pairs out of nine (44%), metastatic tumor‐derived cell lines showed decreased or no expression of MAL compared to matched cell lines derived from primary tumors, whereas four cell line pairs displayed decreased or no expression both in primary and metastatic‐derived cell lines. Previous gene expression profiles revealed that the MAL gene is frequently downregulated in primary tumors of HNSCC.( 5 , 6 , 7 ) Moreover, one study on gene expression profiles of oral cavity oropharyngeal carcinomas showed decreased expression of MAL in primary tumors with metastasis.( 4 ) Interestingly, it was found in a recent study that ectopic expression of MAL in esophageal carcinoma cells leads to inhibition of cell motility.( 15 ) These observations together with our present data suggest that a decrease of MAL expression may be an important biomarker to define cancer cell subpopulations with metastatic ability, and the MAL gene may function as a metastasis suppressor in HNSCC, although further functional studies are needed to clarify the role of MAL in the metastatic process of HNSCC.
The MAL gene encodes a membrane proteolipid that is emphasized as a central component of the integral protein machinery for apical transport.( 16 ) The hydrophobicity profile of MAL was found to show remarkable homology to different proteolipids involved in gap junction formation.( 8 ) Puertollano et al. proposed that MAL is responsible for the formation and trafficking of apical transport vesicles in polarized epithelial cells.( 17 ) Transportation of newly synthesized proteins designed for the apical or basolateral subdomains is fundamental for the establishment and maintenance of polarity in epithelial cells. Defects in cell polarity are closely related with cancer transformation and metastasis progression linked with loss of E‐cadherin expression contrary to polarized epithelial cells with limited ability to move because of cell–cell adhesion.( 18 ) It will be crucial in further studies to clarify the role of the MAL protein in the establishment of cell polarity.
Inactivation of metastasis‐suppressor genes may occur via genetic and epigenetic alterations, including LOH, deletion, mutation, and hypermethylation of gene promoters. We found remarkable LOH frequency (30%) in primary tumor samples showing lymph node metastasis. Furthermore, LOH was also confirmed in metastatic tumor samples in lymph nodes. The MAL gene is located on chromosome 2 at the q11 locus. Previously, LOH on chromosome 2q has been shown to be correlated with poor prognosis in early stage HNSCC and tumor‐node‐metastasis (TNM) stage in oral squamous cell carcinoma.( 19 , 20 ) In lung carcinoma, frequency of LOH on 2q has been found to be significantly higher in brain metastasis than in primary tumors.( 21 ) Interestingly, another study on oral carcinomas displayed an increased LOH frequency in metastatic tumors compared with primary tumors in the 2q12 region (D2S436), which is in close association with the MAL locus.( 22 ) All of these studies are in accordance with our findings and support the role of LOH in the 2q11‐12 locus relating to development of metastasis.
Loss of heterozygosity in only one allele is usually not enough for biallelic inactivation of the gene except homozygous deletion. As a second silencing event, we analyzed the mutation status; however, no nucleotide change was found in any of the exons of MAL in the UT‐SCC cell line series. Similarly, no somatic mutation of MAL has been found in cervical cancer;( 23 ) implying that it is an unlikely mechanism in downregulation of MAL expression.
The promoter region of MAL includes CpG islands and we demonstrated that methylation of MAL was associated with gene silencing in nine HNSCC cell lines by restoration of MAL expression after treatment with a demethylating agent. These results are consistent with earlier reports. Mimori et al. observed re‐expression of the MAL gene in only 3 out of 13 esophageal carcinoma cell lines, whereas simultaneous inhibition of deacetylation and methylation induced MAL expression in 12 out 13 cell lines.( 15 ) Similarly, Lind et al. reported hypermethylation in cancer cell lines from various tissues, including breast, kidney, pancreas, uterus, and colon with frequencies of 50–95%, and colon cancer displayed the highest frequency among them.( 24 ) These findings indicate that methylation of the MAL promoter is an important and significant inactivation mechanism not only for HNSCC but also for various types of other cancers.
The nature of the relationship between primary and metastatic tumor cells in the formation of metastases is not clearly known. Therefore, different models have been hypothesized to explain the metastatic ability of a primary tumor. It is still a matter of debate whether metastasis depends on only a highly capable minor cell population within the tumor, or whether whole cells of primary tumors have a predisposition for metastasis especially in patients with poor prognosis. The recent study of Kang et al. on the genetic properties of breast cancer for bone metastasis revealed that both models may exist together.( 25 ) In that study, microarray analysis defined genetic predisposition in primary tumors for metastatic ability; however, metastatic tumor cells themselves also had different genetic characteristics than their own primary origins. In our study, we showed that metastasis‐originated cell lines have different genetic and epigenetic features compared with their primary counterparts on the basis of MAL expression. Perhaps these types of genetic and epigenetic alterations will define the final steps for the formation of metastasis in a predisposed primary tumor background.
In conclusion, our results show that expression of the MAL gene was decreased or lost selectively in metastatic tumor cells compared with their primary tumor counterparts in HNSCC, suggesting that the MAL gene may be a new candidate metastasis‐suppressor gene for HNSCC. LOH and hypermethylation of the promoter region appear to be important mechanisms for inactivation of MAL function. Further investigation including in vitro and in vivo experiments needs to be conducted to identify the functional role of the MAL gene in the metastatic process.
Acknowledgments
This work was partially supported by Grants‐in‐Aid for scientific research from the Japan Society for the Promotion of Science (P08469 to L.B.). We appreciate Ms Yuki Tatsumi for assistance in the laboratory.
References
- 1. Tannapfel A, Weber A. Tumor markers in squamous cell carcinoma of the head and neck: clinical effectiveness and prognostic value. Eur Arch Otorhinolaryngol 2001; 258: 83–8. [DOI] [PubMed] [Google Scholar]
- 2. Mamelle G, Pampurik J, Luboinski B, Lancar R, Lusinchi A, Bosq J. Lymph node prognostic factors in head and neck squamous cell carcinomas. Am J Surg 1994; 168: 494–8. [DOI] [PubMed] [Google Scholar]
- 3. Rinker‐Schaeffer CW, O’Keefe JP, Welch DR, Theodorescu D. Metastasis suppressor proteins: discovery, molecular mechanisms, and clinical application. Clin Cancer Res 2006; 12: 3882–9. [DOI] [PMC free article] [PubMed] [Google Scholar]
- 4. Schmalbach CE, Chepeha DB, Giordano TJ et al . Molecular profiling and the identification of genes associated with metastatic oral cavity/pharynx squamous cell carcinoma. Arch Otolaryngol Head Neck Surg 2004; 130: 295–302. [DOI] [PubMed] [Google Scholar]
- 5. Belbin TJ, Singh B, Smith RV et al . Molecular profiling of tumor progression in head and neck cancer. Arch Otolaryngol Head Neck Surg 2005; 131: 10–18. [DOI] [PubMed] [Google Scholar]
- 6. Sok JC, Kuriakose MA, Mahajan VB, Pearlman AN, DeLacure MD, Chen FA. Tissue‐specific gene expression of head and neck squamous cell carcinoma in vivo by complementary DNA microarray analysis. Arch Otolaryngol Head Neck Surg 2003; 129: 760–70. [DOI] [PubMed] [Google Scholar]
- 7. Kornberg LJ, Villaret D, Popp M et al . Gene expression profiling in squamous cell carcinoma of the oral cavity shows abnormalities in several signaling pathways. Laryngoscope 2005; 115: 690–8. [DOI] [PubMed] [Google Scholar]
- 8. Rancano C, Rubio T, Correas I, Alonso MA. Genomic structure and subcellular localization of MAL, a human T‐cell‐specific proteolipid protein. J Biol Chem 1994; 269: 8159–64. [PubMed] [Google Scholar]
- 9. Alonso MA, Millan J. The role of lipid rafts in signalling and membrane trafficking in T lymphocytes. J Cell Sci 2001; 114: 3957–65. [DOI] [PubMed] [Google Scholar]
- 10. Liebert M, Hubbel A, Chung M et al . Expression of mal is associated with urothelial differentiation in vitro: identification by differential display reverse‐transcriptase polymerase chain reaction. Differentiation 1997; 61: 177–85. [DOI] [PubMed] [Google Scholar]
- 11. Cheong KH, Zacchetti D, Schneeberger EE, Simons K. VIP17/MAL, a lipid raft‐associated protein, is involved in apical transport in MDCK cells. Proc Natl Acad Sci USA 1999; 96: 6241–8. [DOI] [PMC free article] [PubMed] [Google Scholar]
- 12. Gunduz M, Beder LB, Gunduz E et al . Downregulation of ING3 mRNA expression predicts poor prognosis in head and neck cancer. Cancer Sci 2008; 99: 531–8. [DOI] [PMC free article] [PubMed] [Google Scholar]
- 13. Tracey L, Villuendas R, Ortiz P et al . Identification of genes involved in resistance to interferon‐α in cutaneous T‐cell lymphoma. Am J Pathol 2002; 161: 1825–37. [DOI] [PMC free article] [PubMed] [Google Scholar]
- 14. Beder LB, Gunduz M, Ouchida M et al . Identification of a candidate tumor suppressor gene RHOBTB1 located at a novel allelic loss region 10q21 in head and neck cancer. J Cancer Res Clin Oncol 2006; 132: 19–27. [DOI] [PubMed] [Google Scholar]
- 15. Mimori K, Shiraishi T, Mashino K et al . MAL gene expression in esophageal cancer suppresses motility, invasion and tumorigenicity and enhances apoptosis through the Fas pathway. Oncogene 2003; 22: 3463–71. [DOI] [PubMed] [Google Scholar]
- 16. Marazuela M, Acevedo A, Adrados M, Garcia‐Lopez MA, Alonso MA. Expression of MAL, an integral protein component of the machinery for raft‐mediated pical transport, in human epithelia. J Histochem Cytochem 2003; 51: 665–74. [DOI] [PubMed] [Google Scholar]
- 17. Puertollano R, Alonso MA. Targeting of MAL, a putative element of the apical sorting machinery, to glycolipid‐enriched membranes requires a pre‐golgi sorting event. Biochem Biophys Res Commun 1999; 254: 689–92. [DOI] [PubMed] [Google Scholar]
- 18. Fish EM, Molitoris BA. Alterations in epithelial polarity and the pathogenesis of disease states. N Engl J Med 1994; 330: 1580–8. [DOI] [PubMed] [Google Scholar]
- 19. Ransom DT, Barnett TC, Bot J et al . Loss of heterozygosity on chromosome 2q: possibly a poor prognostic factor in head and neck cancer. Head Neck 1998; 20: 404–10. [DOI] [PubMed] [Google Scholar]
- 20. Yamamoto N, Mizoe J, Numasawa H, Tsujii H, Shibahara T, Noma H. Allelic loss on chromosomes 2q, 3p and 21q: possibly a poor prognostic factor in oral squamous cell carcinoma. Oral Oncol 2003; 39: 796–805. [DOI] [PubMed] [Google Scholar]
- 21. Otsuka T, Kohno T, Mori M, Noguchi M, Hirohashi S, Yokota J. Deletion mapping of chromosome 2 in human lung carcinoma. Genes Chromosomes Cancer 1996; 16: 113–19. [DOI] [PubMed] [Google Scholar]
- 22. Yamamoto N, Mizoe JE, Numasawa H et al . Allelic loss of chromosome 2 in human oral squamous cell carcinoma: correlation with lymph node metastasis. Oral Oncol 2003; 39: 64–8. [DOI] [PubMed] [Google Scholar]
- 23. Hatta M, Nagai H, Okino K et al . Down‐regulation of members of glycolipid‐enriched membrane raft gene family, MAL and BENE, in cervical squamous cell cancers. J Obstet Gynaecol Res 2004; 30: 53–8. [DOI] [PubMed] [Google Scholar]
- 24. Lind GE, Ahlquist T, Kolberg M et al . Hypermethylated MAL gene – a silent marker of early colon tumorigenesis. J Transl Med 2008; 6: 13. [DOI] [PMC free article] [PubMed] [Google Scholar]
- 25. Kang Y, Siegel PM, Shu W et al . A multigenic program mediating breast cancer metastasis to bone. Cancer Cell 2003; 3: 537–49. [DOI] [PubMed] [Google Scholar]