

Abstract
CD133‐positive cells have been reported to possess a cancer‐initiating‐cell phenotype and the property of resistance to chemoradiation therapy in colorectal cancer. The aim of the present study was to evaluate quantitative and locational changes in CD133‐positive cells in rectal cancer patients who received preoperative chemoradiation therapy. The prognostic significance of CD133 expression in patients with preoperative chemoradiation therapy was also analyzed. Immunohistochemical staining for CD133 and cancer‐initiating‐cell marker CD44 were performed in 92 surgically resected rectal cancers. Of the 92 cases, 43 patients received preoperative chemoradiation therapy and 49 patients underwent surgery alone. Forty pretherapic biopsy specimens from 43 patients in preoperative chemoradiation therapy group were also analyzed. CD133‐positive cases were more common in the preoperative chemoradiation therapy group than in the surgery‐alone group (P = 0.03). Further, CD133‐positive cases were more common in the preoperative chemoradiation therapy group than in pretherapic biopsy specimens (P = 0.02). In the preoperative chemoradiation therapy group, the CD133‐positive cases showed poorer prognosis than the CD133‐negative cases. On the other hand, the frequency of CD44‐positive case within cancer tissue was similar between the preoperative chemoradiation therapy group and the surgery‐alone group. CD44 expression in the preoperative chemoradiation therapy group was not associated with prognosis. CD44‐ and CD133‐positive cells were distributed evenly within the tumor both in the preoperative chemoradiation therapy group and surgery‐alone group, and locational alteration was not observed. The therapy‐resistant ability of CD133‐positive cells can be associated with poor outcome in the patients with preoperative chemoradiation therapy.
(Cancer Sci 2010; 101: 906–912)
The biological heterogeneity of human solid tumors has been explained by the cancer stem‐cell theory, according to which a small fraction of cancer‐initiating cells (C‐ICs) is exclusively responsible for the growth and maintenance of entire heterogeneous tumors.( 1 ) C‐ICs exhibit characteristics similar to those of normal adult stem cells, including the property of self‐renewal or multipotency to differentiate into distinct cell types and they have high tumor initiating potential when inoculated into immunodeficient mice.( 2 , 3 ) In addition, C‐ICs possess the property of resistance to chemoradiation therapy (CRT).( 4 ) Even a small fraction of therapy‐resistant C‐ICs may lie latent in a specific anatomic location, called niche, then proliferate again and cause a relapse after CRT.( 5 , 6 ) Since the discovery of CD34 as a C‐IC marker in acute leukemia, many C‐IC markers have also been reported in solid tumors.( 7 ) CD133 and CD44 have been identified as novel C‐IC markers, including in brain, breast, liver, prostate, and colorectal cancer.( 8 , 9 , 10 , 11 , 12 , 13 ) CD133 is a transmembrane pentspan protein that is expressed in a variety of cells in embryos.( 14 , 15 , 16 ) Although its physiological role is not fully known, CD133 contributes to the formation of plasma membrane outgrowth. CD44 is a transmembrane glycoprotein that is involved in cell growth, survival, differentiation, and mortality.( 17 ) C‐IC‐marker‐positive cells may also possess the property of CRT resistance. In fact, C‐IC‐marker‐positive cells have been reported to be enriched after therapy targeting the bulk of the tumor in vitro and in a murine model.( 18 , 19 ) As a result, C‐IC markers have also been reported to be targets for therapy designed to eradicate heterogeneous solid tumors.( 20 , 21 )
Based on evidence of improved local control and survival, preoperative CRT is now considered one of standard therapies for rectal cancer.( 22 , 23 , 24 , 25 ) Immunohistochemical comparison of C‐IC marker expression according to whether patients have received preoperative CRT will provide an important clue to the quantitative and spatial change in C‐ICs that occurs during CRT and which will lead to the assessment of the therapy resistance and niche‐forming properties of C‐ICs.
The aim of this study was (1) to compare expression of C‐IC markers in the tumors of rectal cancer patients according to whether they received CRT and to estimate the quantitative and locational change in C‐IC that occurs during CRT; (2) to analyze the associations between expression of the C‐IC markers and clinicopathological characteristics, including recurrence, in a group that received preoperative CRT, in order to know their clinical implications.
Materials and Methods
Patient characteristics.
The 102 rectal cancer patients received sphincter saving resection (SSR) at National Cancer Center Hospital East between 2001 and 2005. Of these, 92 patients with preoperative or pre‐CRT clinical stage II and III disease according to the International Union Against Cancer (UICC) TNM classification and who were estimated to have undergone curative surgery were enrolled in this study.( 26 ) Written informed consent to tumor tissue collection and its use for pathological and immunohistochemical study according to the protocol approved by the local ethical committee was obtained. Clinical staging was based on the colonoscopy, chest X‐ray, blood test, tumor marker, abdomen‐pelvis computed tomography, and magnetic resonance imaging findings. All tumors were located in the lower third of the rectum. Of 92 patients, 43 received preoperative CRT, which consisted of preoperative radiotherapy (45 Gy in 5 weeks, 25 fractions) and concomitant chemotherapy of 5‐fluorouracil (145 mg/mm2 per day, five times for 5 weeks). Of the 43 patients in the preoperative CRT group, 40 patients had histological confirmation of adenocarcinoma in pretherapic biopsy specimens. SSR was performed 4–6 weeks after the completion of CRT. All patients with pathological stage III disease received postoperative 5‐fluorouracil‐based chemotherapy. Recurrence was diagnosed on the basis of clinical examinations and imaging studies. Time to death, final follow‐up examination, and diagnosis of recurrence was measured from the date of surgery.
Histological examination.
All resected specimens were opened anteriorly, pinned on a corkboard, and fixed in 10% formalin. The entire macroscopic tumor or fibrotic area was serially sliced at 5‐mm intervals, and the most representative slices were identified and embedded in paraffin for histological evaluation. Standard hematoxylin–eosin (H&E) sections were examined independently by two pathologists (M.K. and A.O.) who were unaware of the clinical findings. Discrepancies between their findings were resolved by discussion. The pathologic stage of the tumor and of the residual tumor was determined according to the UICC TNM classification.( 26 ) The sections were also examined for lymphovascular invasion and perineural invasion.
Microscopic features associated with preoperative CRT.
The 43 cases in the preoperative CRT group were evaluated for tumor down staging and histological regression. Reduction of pathological T stage from clinical evaluation was defined as tumor down stage in this study. Post‐CRT histological tumor regression was graded according to Dwork et al. ( 27 ) Next, we evaluated previously reported microscopic parameters associated with preoperative CRT. Cases exhibiting cytoplasmic eosinophilic change with nuclear atypia, including nuclear pleomorphism, and/or prominent nucleoli, and/or bizarre nucleus over 50% of tumor area were recorded. Cases with mucous lake more than 10% area of the tumor, distinct calcification, and foreign body giant cells were recorded.( 28 , 29 , 30 , 31 ) Associations between the microscopic features and clincopathological features were evaluated in the preoperative CRT group.
Immunohistochemical study.
Immunohistochemical staining for CD133 and CD44 was performed on 5‐μm paraffin sections from the most representative area of the resected specimens. Five‐μm paraffin sections from 40 pretherapic biopsy specimens from the 43 preoperative CRT group were also immunostained for CD133 and CD44. CD133 staining was performed using mouse anti‐CD133 antibody (AC133; Miltenyi Biotec, Auburn, CA, USA), and CD44 staining was performed using mouse anti‐CD44 antibody (DF1485; Novocastra Laboratories, Newcastle, UK) as described previously.( 32 , 33 ) Immunohistochemical CD133 expression in more than 10% of tumor cells and CD44 expression in more than 50% of tumor cells were assigned as positive.( 32 , 33 ) To speculate the quantitative alteration during CRT, the frequency of CD44‐positive cases and CD133‐positive cases in the preoperative CRT group, surgery‐alone group, and pretherapic biopsy specimens were compared. Associations between CD133 expression and CD44 expression were evaluated in the preoperative CRT group and surgery‐alone group. Associations between the immunohistochemical findings and clinicopathological features were assessed in the 43 preoperative CRT group. To elucidate the characteristics of CD133‐positive cells, and the difference in CD133‐positive cells between the preoperative CRT and surgery‐alone groups, Ki‐67 (1:100, MIB‐1; Dakocytomation, Glostrup, Denmark) and p53 (1:1000, polyclonal antibody; Nichirei, Tokyo, Japan) immunostaining were performed in CD133‐positive cases. The average of the Ki‐67‐ and p53‐positive ratio was determined using three photographs from CD133‐positive and ‐negative areas with high‐power magnification, as reported previously.( 32 )
Statistical analysis.
Differences in clinicopathological and immunohistochemical features between the preoperative CRT and surgery‐alone groups were tested by the χ2‐test and t‐test. Associations between clinicopathological features and immunohistochemically detected CD133 and CD44 expressions were tested by the χ2‐test. Kaplan–Meier analysis was used to estimate overall survival (OS) and disease‐free survival (DFS), and differences were analyzed by the log‐rank test. The Cox proportional hazard model was used in the multivariate analysis. P‐values <0.05 were considered statistically significant. Stadt Flex version 5 for Windows software (Artec, Osaka, Japan) was used to perform the statistical analysis.
Results
Clinicopathological and histological characteristics in the preoperative CRT and surgery‐alone groups.
The clinicopathological differences between the preoperative CRT and surgery‐alone groups are listed in Table 1. Mean age and the gender ratio in the two groups were similar. cT, cN, and pN stage were also similar in the two groups. On the other hand, pT stage in the preoperative CRT group was significantly lower than in the surgery‐alone group (P < 0.01). The microscopic parameters of lymphovascular invasion, perineural invasion, eosinophilia with nuclear atypia, calcification, and foreign body giant cells were significantly more common in the preoperative CRT group than in the surgery‐alone group (P < 0.01). Mucous lakes were more common in the preoperative CRT group than in the surgery‐alone group, but the difference was not statistically significant.
Table 1.
Clinicopathological and histological characteristics in the preoperative CRT and surgery‐alone groups
| Characteristics | Preoperative CRT group | Surgery‐alone group | P‐values |
|---|---|---|---|
| n | 43 | 49 | |
| Age (mean ± SD) | 55.9 ± 11.4 | 57.8 ± 9.7 | 0.38 |
| Gender (male:female) | 30:13 | 36:13 | 0.69 |
| cT (0:1:2:3:4) | 0:0:10:31:2 | 0:0:6:38:5 | 0.62 |
| cN (0:1,2) | 26:17 | 22:29 | 0.09 |
| pT (0:1:2:3:4) | 7:5:9:22:0 | 0:1:12:31:5 | 0.01>* |
| pN (0:1,2) | 30:13 | 26:23 | 0.10 |
| Lymphovascular invasion | 41.9% (18/43) | 71.4% (35/49) | 0.01>* |
| Perineural invasion | 18.6% (8/43) | 44.9% (22/49) | 0.01>* |
| Eosinophilia with nuclear atypia | 51.2% (22/43) | 8.2% (4/49) | 0.01>* |
| Mucous lake | 32.6% (14/43) | 16.3% (8/49) | 0.07 |
| Calcification | 27.9% (12/43) | 6.1% (3/49) | 0.01>* |
| Foreign body giant cells | 18.6% (8/43) | 2.0% (1/49) | 0.01>* |
*P < 0.05. cN, clinical N stage; CRT, chemoradiation therapy; cT, clinical T stage; pN, pathological N stage; pT, pathological T stage.
Immunohistochemically detected CD133 and CD44 expression in the preoperative CRT and surgery‐alone groups.
There were no differences in the distribution of CD133‐ and CD44‐ expressing cells between the invasive area and surface area in either the CRT group or the surgery‐alone group (Fig. 1). Prevailing localizations of CD133‐ or CD44‐positive cells in the invasive front or perivascular area were not found. Immunohistochemical expression of CD133 and CD44 was compared among the preoperative CRT group, surgery‐alone group, and pretherapic biopsy specimen (Fig. 2). The frequency of CD133‐positive case was significantly higher in the preoperative CRT group than in the surgery‐alone group and pretherapic biopsy specimen (P = 0.03 and 0.02, respectively). On the other hand, the frequencies of CD44‐positive cases in these groups were similar. The evaluations of the associations between CD133 and CD44 expression showed no associations between them in either group (Table 2).
Figure 1.
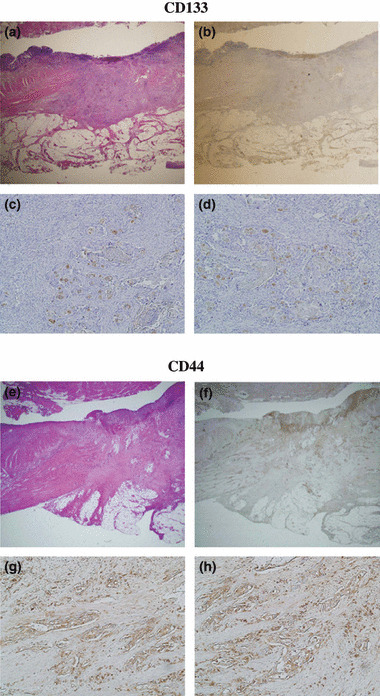
Histological and immunohistochemical CD133 expression in the preoperative chemoradiotherapy case. (a) Low power view of H&E section; (b) low power view of immunohistochemical CD133 staining. CD133 expression in the upper circle is shown in (c), and CD133 expression in the lower circle is shown in (d) in high power magnification. The expressions of CD133 were not different between the tumor surface and invasive area. Histological and immunohistochemical CD44 expression in the preoperative chemoradiotherapy case. (e) Low power view of H&E section; (f) low power view of immunohistochemical CD44 staining. CD44 expression in the upper circle is shown in (g), and CD44 expression in the lower circle is shown in (h) in high power magnification. The expressions of CD44 were not different between the tumor surface and invasive area.
Figure 2.
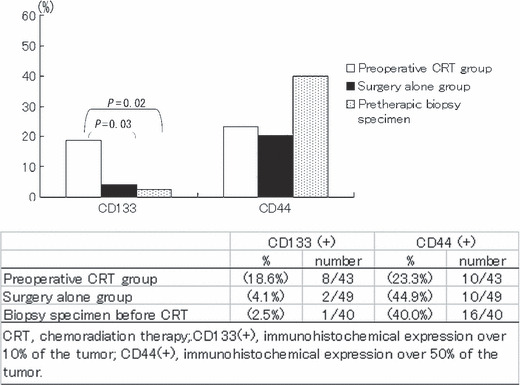
Frequency of CD133‐ and CD44‐positive cases in rectal cancer cases in the preoperative chemoradiation therapy (CRT) group, surgery‐alone group, and biopsy specimen before CRT. The frequency of CD133‐positive cases was significantly higher in the preoperative CRT group than in the surgery‐alone group and preoperative biopsy specimen (P = 0.03 and 0.02, respectively). On the other hand, the frequency of CD44‐positive cases in these groups were similar.
Table 2.
Relationships between immunohistochemical CD133 and CD44 expression in the preoperative CRT and surgery‐alone groups
| Preoperative CRT group | P‐values | Surgery‐alone group | P‐values | |||
|---|---|---|---|---|---|---|
| CD133(+) | CD133(−) | CD133(+) | CD133(−) | |||
| CD44(+) | 2 | 8 | 0.90 | 0 | 10 | 0.46 |
| CD44(−) | 6 | 27 | 2 | 37 | ||
CD133(−), immunohistochemical CD133 expression within 10% of the tumor; CD133(+), immunohistochemical CD133 expression over 10% of the tumor; CD44(−), immunohistochemical CD44 expression within 50% of the tumor; CD44(+), immunohistochemical CD44 expression over 50% of the tumor; CRT, chemoradiation therapy.
Ki‐67 and p53 expression in CD133‐positive and negative areas.
Ten CD133 positive cases were immunostained for anti‐Ki‐67 and anti‐p53 antibody. The Ki‐67 and p53 positive ratios were not different between the CD133‐positive and ‐negative areas both in the preoperative CRT group and surgery‐alone group. Further, the Ki‐67 and p53 positive ratios in CD133 positive area were not different between the preoperative CRT group and surgery‐alone group (Table 3).
Table 3.
Ki‐67 and p53 expression in CD133‐positive and ‐negative areas in the preoperative CRT and surgery‐alone groups
| Preoperative CRT group | P‐values | Surgery‐alone group | P‐values | |||
|---|---|---|---|---|---|---|
| CD133‐positive area | CD133‐negative area | CD133‐positive area | CD133‐negative area | |||
| Ki‐67 expression (%) | 1.45 ± 2.52 | 2.27 ± 4.06 | 0.63 | 2.33 ± 0.82 | 2.26 ± 2.10 | 0.97 |
| p53 expression (%) | 18.8 ± 35.4 | 22.7 ± 40.8 | 0.93 | 5.25 ± 7.42 | 5.99 ± 7.94 | 0.84 |
CRT, chemoradiation therapy.
Association between CD133 expression and CD44 expression and the clinicopathological features in the preoperative CRT group.
Associations between CD133 expression, CD44 expression, and clinicopathological features were evaluated in the preoperative CRT group (Table 4). CD133 expression was not associated with any of the clinicopathological features. Significantly more CD44‐positive cases were found among the cases that were positive for lymphovascular invasion (P = 0.02), but CD44 expression was not associated with any other clinicopathological features.
Table 4.
Clinicopathological characteristics and CD133 and CD44 expression in the preoperative CRT group
| Total n | CD133 positive | P‐values | CD44 positive | P‐values | |
|---|---|---|---|---|---|
| n (%) | n (%) | ||||
| cT | |||||
| cT1,2 | 10 | 2 (20.0) | 0.89 | 3 (30.0) | 0.56 |
| cT3,4 | 33 | 6 (18.2) | 7 (21.2) | ||
| cN | |||||
| cN1,2 | 17 | 3 (17.7) | 0.90 | 4 (23.5) | 0.97 |
| cN0 | 26 | 5 (19.2) | 6 (23.1) | ||
| ypT | |||||
| pT0‐2 | 21 | 3 (14.3) | 0.48 | 6 (28.6) | 0.42 |
| pT3 | 22 | 5 (22.7) | 4 (18.2) | ||
| ypN | |||||
| ypN1,2 | 13 | 4 (30.8) | 0.18 | 4 (30.8) | 0.44 |
| ypN0 | 30 | 4 (13.3) | 6 (20.0) | ||
| Lymphovascular invasion | |||||
| Present | 17 | 4 (23.5) | 0.50 | 7 (41.2) | 0.02* |
| Absent | 26 | 4 (15.4) | 3 (11.5) | ||
| Perineural invasion | |||||
| Present | 8 | 3 (37.5) | 0.13 | 0 (0) | 0.08 |
| Absent | 35 | 5 (14.3) | 10 (42.9) | ||
| Tumor down stage | |||||
| Present | 21 | 2 (9.5) | 0.13 | 4 (19.0) | 0.52 |
| Absent | 22 | 6 (27.3) | 6 (27.3) | ||
| Dworak grade of regression | |||||
| Grade 0–2 | 28 | 7 (25.0) | 0.14 | 8 (28.4) | 0.26 |
| Grade 3,4 | 15 | 1 (6.7) | 2 (13.3) | ||
| Eosinophilic change with nuclear atypia | |||||
| Present | 22 | 6 (27.3) | 0.13 | 7 (28.6) | 0.17 |
| Absent | 21 | 2 (9.5) | 3 (14.3) | ||
| Mucous lake | |||||
| Present | 14 | 2 (14.3) | 0.61 | 3 (21.4) | 0.84 |
| Absent | 29 | 6 (20.7) | 7 (24.1) | ||
| Calcification | |||||
| Present | 12 | 2 (16.7) | 0.84 | 2 (16.7) | 0.52 |
| Absent | 31 | 6 (19.4) | 8 (25.8) | ||
| Foreign body giant cells | |||||
| Present | 8 | 1 (12.5) | 0.62 | 1 (12.5) | 0.42 |
| Absent | 35 | 7 (20.0) | 9 (25.7) | ||
*P < 0.05. cN, clinical N stage; CRT, chemoradiation therapy; cT, clinical T stage; ypN, pathological N stage; ypT, pathological T stage.
CD133 expression, CD44 expression, and patient outcome in the preoperative CRT group.
The Kaplan–Meier survival curves for the immunohistochemically CD133‐positive and ‐negative cases and CD44‐positive and ‐negative cases are shown in Figure 3. Both OS and DFS were significantly shorter in the CD133‐positive cases than in the CD133 negative cases (P < 0.01 and P = 0.01, respectively). On the other hand, OS and DFS in the CD44‐positive and ‐negative cases were similar.
Figure 3.
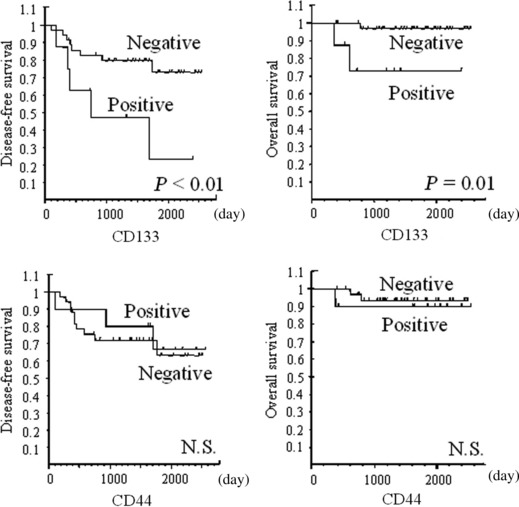
Overall survival (OS) and disease‐free survival (DFS) curves for the impact of CD133 and CD44 expressions on rectal cancer patients in the preoperative chemoradiation therapy (CRT) group. CD133 expression was a significant predictor of shorter OS (P = 0.01) and DFS (P < 0.01) in the preoperative CRT group. On the other hand, CD44 expression was not a predictor of shorter prognosis. N.S., not significant.
Clinicopathological characteristics and patients’ outcome in the preoperative CRT group.
The associations between clinicopathological features and DFS in the patients with preoperative CRT are shown in Table 5. Pathological ypN stage was significantly associated with DFS (P = 0.03). None of the other clinicopathological variables were associated with DFS. The results of a multivariate analysis that included ypN and CD133 showed that neither was an independent prognostic factor (data not shown).
Table 5.
Clinicopathological characteristics and DFS in the pre‐operative CRT group
| n | DFS | ||
|---|---|---|---|
| 5‐years free of recurrence (%) | P‐values | ||
| cT | |||
| cT1,2 | 10 | 60.0 | 0.31 |
| cT3,4 | 33 | 65.5 | |
| cN | |||
| cN0 | 26 | 70.5 | 0.17 |
| cN1,2 | 17 | 52.6 | |
| ypT | |||
| ypT0‐2 | 21 | 75.0 | 0.11 |
| ypT3 | 22 | 51.1 | |
| ypN | |||
| ypN0 | 30 | 74.8 | 0.03* |
| pN1,2 | 13 | 37.9 | |
| Lymphovascular invasion | |||
| Present | 17 | 44.6 | 0.09 |
| Absent | 26 | 80.6 | |
| Perineural invasion | |||
| Present | 8 | 50.0 | 0.16 |
| Absent | 35 | 66.2 | |
| Eosinophilic change with nuclear atypia | |||
| Present | 22 | 54.5 | 0.49 |
| Absent | 21 | 75.1 | |
| Mucous lake | |||
| Present | 14 | 64.3 | 0.93 |
| Absent | 29 | 62.9 | |
| Calcification | |||
| Present | 12 | 83.3 | 0.40 |
| Absent | 31 | 57.9 | |
| Foreign body giant cells | |||
| Present | 8 | 50.0 | 0.90 |
| Absent | 35 | 67.2 | |
| Tumor down stage | |||
| Positive | 22 | 73.2 | 0.15 |
| Negative | 21 | 53.7 | |
| Dworak grade of regression | |||
| Grade 0–2 | 28 | 59.8 | 0.30 |
| Grade 3,4 | 15 | 65.0 | |
| CD133 expression | |||
| Positive | 10 | 23.4 | 0.01* |
| Negative | 33 | 72.9 | |
| CD44 expression | |||
| Positive | 10 | 66.7 | 0.74 |
| Negative | 33 | 63.0 | |
*P < 0.05. cN, clinical N stage; CRT, chemoradiation therapy; cT, clinical T stage; DFS, disease‐free survival; ypN, pathological N stage; ypT, pathological T stage.
Discussion
CD133‐positive cells have been reported to be chemoradiation resistant and to be responsible for post‐treatment recurrence. CD133‐positive fraction of glioblastoma has been found to be enriched post radiation therapy in vitro and in vivo models. CD133‐positive glioblastoma cells from irradiated and untreated tumors exhibit the same C‐IC properties of high tumor‐initiating potential and multipotency to differentiate into astrocytes and oligodendrocytes.( 19 ) In colorectal cancer, developed chemoresistant cell lines have been reported to be enriched for CD133‐ and CD44‐positive fraction when compared with their parental cells, and the same cell lines have also shown the increased ability to form colonies under anchorage‐independent conditions, which is one of characteristics of C‐ICs.( 18 ) We and others have previously reported the finding that CD133 expression in colorectal cancer is associated with differentiation and a poorer prognosis in cases that did not receive preoperative CRT.( 32 , 34 ) Because many of the cases in our previous series received postoperative chemotherapy, the therapy‐resistant abilities of CD133‐positive cells after operation could be associated with these results. Therefore, in the present study, we immunohistochemically analyzed CD133 and CD44 expression and the distribution of their expression in human rectal cancer tissue after CRT. This is the first study to compare immunohistochemically detected CD133 expression in human rectal cancer tissue in patients who received and did not receive preoperative CRT. Although surgical specimens are inadequate to assess time‐dependent histological change before and after CRT, we believe that comparisons between patients in similar cohorts who received and did not receive preoperative CRT, as in this series, are adequate to determine whether the survival of C‐IC‐marker‐positive cells is a phenomenon that actually occurs in human cancer tissue. Immunohistochemical results in a pretherapic biopsy specimen were similar to that of the surgery‐alone group. Moreover, this fact also seemed to support the validity of this study. The results in this study of human tissue showing an increased frequency of CD133‐positive cases in the post‐CRT state are consistent with the results of previous experimental reports. We have never known whether the increase of CD133‐positive cells or the decrease of CD133‐negative cells contributes to the enrichment of CD133‐positive cells in human cancer tissue. The amount of total cancer cells is more or less decreased post CRT, even though, the CD133‐positive area was restricted in 10–20% of the tumor even in the CD133‐positive cases. Therefore, we speculate that CD133‐negative‐therapy susceptive cells were mainly decreased 4–6 weeks after CRT. Because CD133 expression is also a prognostic factor in rectal cancer cases that have received preoperative CRT, the therapy‐resistant ability of CD133 may also be associated with the poor outcome of these patients. CD133 immunostaining in a pretherapic biopsy specimen can be useful to predict CRT sensitivity and further study is required. However, the low positivity of CD133 can disturb its utility in the clinical setting. Cancer proliferation and p53 status may also be associated with sensitivity to chemoradiation therapy.( 35 , 36 ) On the other hand, our previous study revealed the lack of association between CD133 expression and Ki‐67 and p53 expression in the case without preoperative CRT. This study also revealed the lack of association in the case with preoperative CRT. Further, the Ki‐67 and p53 expression in the CD133‐positive area was not affected by preoperative CRT. CD133‐positive cells were reported to show therapy resistance through activation of the DNA damage checkpoint response.( 19 ) Proliferation or p53 status may not be associated with the therapy‐resistance ability of CD133.
The perivascular area and invasive front are candidates for cancer stem‐cell niches in colorectal cancer.( 37 , 38 ) However, in our previous study, CD133‐positive cells were found to be distributed evenly throughout the tumor. Prevailing localization of CD133‐positive cells in the invasive front or perivascular area was not found in colorectal cancer without preoperative CRT. Then, we estimated that post‐CRT status could be reasonable to detect therapy‐resistant niche formation of C‐IC. However, as in the surgery‐alone group, CD133‐positive cells were evenly distributed within the tumors in the preoperative CRT group. Therefore, the therapy‐resistant niches may be evenly distributed. Otherwise, CD133 may not be adequate to detect C‐IC niche formation in colorectal cancer.
Examination of immunohistochemically stained serial sections and flow cytometric analysis revealed that CD133 and another C‐IC marker of CD44 expression rarely co‐exist in the same colorectal carcinoma cells.( 39 ) Similarly, CD133 and CD44 expression were not associated in either the preoperative CRT or surgery‐alone groups in this study. The functional importance of CD44 as a cancer stem cell has been reported in colorectal cancer, and association with drug resistance has also been reported.( 18 , 39 ) Despite these findings, we failed to find any quantitative or locational differences in CD44‐positive cells according to whether patients received preoperative CRT. Furthermore, CD44 expression was not associated with clinical outcome in the preoperative CRT group. The prognostic significance of CD44 is controversial in the case without preoperative CRT.( 40 , 41 ) Adhesive activity of CD44 was reported to be modulated by many cofactors. Further, some C‐IC markers were reported to be better prognostic markers.( 42 ) Therefore, we speculate that CD44 alone may not be enough to affect patient prognosis, and positivity of C‐IC markers may not always associate with patients’ prognosis. Although its significance is unknown, CD133‐positive and CD44‐positive cells seemed not to be identical, and the changes in their expressions after CRT also seemed to be different.
In conclusion, CD133‐positive cases were found to be more common in the group that received preoperative CRT than in the surgery‐alone group. In addition, CD133 expression was associated with a poor outcome in the preoperative CRT group. CD133 expression is useful predictor of prognosis in rectal cancer patients who have received preoperative CRT. The anti‐chemoradiotherapy property of CD133 may be associated with poor patient outcome.
Disclosure statement
The authors have no conflict of interest.
Acknowledgments
The authors thank Ms Hiroko Hashimoto and Ms Sachiko Fukuda for excellent technical assistance. This work was supported by a Grant‐in‐Aid for Young Scientists (B) (no. 19790277) from the Ministry of Education, Culture, Sports, Science and Technology of Japan; a Cancer Research Grant from the Ministry of Health, Labour and Welfare (Ns. 19[20]) of Japan; and a Grant from the 3rd‐term Comprehensive 10‐year Strategy for Cancer Control.
References
- 1. Pardal R, Clarke MF, Morrison SJ. Applying the principles of stem‐cell biology to cancer. Nat Rev Cancer 2003; 3 (12): 895–902. [DOI] [PubMed] [Google Scholar]
- 2. Reya T, Morrison SJ, Clarke MF, Weissman IL. Stem cells, cancer, and cancer stem cells. Nature 2001; 414 (6859): 105–11. [DOI] [PubMed] [Google Scholar]
- 3. Vescovi AL, Galli R, Reynolds BA. Brain tumour stem cells. Nat Rev Cancer 2006; 6 (6): 425–36. [DOI] [PubMed] [Google Scholar]
- 4. Ishii H, Iwatsuki M, Ieta K et al. Cancer stem cells and chemoradiation resistance. Cancer Sci 2008; 99 (10): 1871–7. [DOI] [PMC free article] [PubMed] [Google Scholar]
- 5. Klonisch T, Wiechec E, Hombach‐Klonisch S et al. Cancer stem cell markers in common cancers ‐ therapeutic implications. Trends Mol Med 2008; 14 (10): 450–60. [DOI] [PubMed] [Google Scholar]
- 6. Liu JM, Mao BY, Hong S, Liu YH, Wang XJ. The postoperative brain tumour stem cell (BTSC) niche and cancer recurrence. Adv Ther 2008; 25 (5): 389–98. [DOI] [PubMed] [Google Scholar]
- 7. Bonnet D, Dick JE. Human acute myeloid leukemia is organized as a hierarchy that originates from a primitive hematopoietic cell. Nat Med 1997; 3 (7): 730–7. [DOI] [PubMed] [Google Scholar]
- 8. O’Brien CA, Pollett A, Gallinger S, Dick JE. A human colon cancer cell capable of initiating tumour growth in immunodeficient mice. Nature 2007; 445 (7123): 106–10. [DOI] [PubMed] [Google Scholar]
- 9. Ricci‐Vitiani L, Lombardi DG, Pilozzi E et al. Identification and expansion of human colon‐cancer‐initiating cells. Nature 2007; 445 (7123): 111–5. [DOI] [PubMed] [Google Scholar]
- 10. Dalerba P, Dylla SJ, Park IK et al. Phenotypic characterization of human colorectal cancer stem cells. Proc Natl Acad Sci U S A 2007; 104 (24): 10158–63. [DOI] [PMC free article] [PubMed] [Google Scholar]
- 11. Patrawala L, Calhoun T, Schneider‐Broussard R et al. Highly purified CD44+ prostate cancer cells from xenograft human tumors are enriched in tumorigenic and metastatic progenitor cells. Oncogene 2006; 25 (12): 1696–708. [DOI] [PubMed] [Google Scholar]
- 12. Al‐Hajj M, Wicha MS, Benito‐Hernandez A, Morrison SJ, Clarke MF. Prospective identification of tumorigenic breast cancer cells. Proc Natl Acad Sci U S A 2003; 100 (7): 3983–8. [DOI] [PMC free article] [PubMed] [Google Scholar]
- 13. Tang DG, Patrawala L, Calhoun T et al. Prostate cancer stem/progenitor cells: identification, characterization, and implications. Mol Carcinog 2007; 46 (1): 1–14. [DOI] [PubMed] [Google Scholar]
- 14. Miraglia S, Godfrey W, Yin AH et al. A novel five‐transmembrane hematopoietic stem cell antigen: isolation, characterization, and molecular cloning. Blood 1997; 90 (12): 5013–21. [PubMed] [Google Scholar]
- 15. Yin AH, Miraglia S, Zanjani ED et al. AC133, a novel marker for human hematopoietic stem and progenitor cells. Blood 1997; 90 (12): 5002–12. [PubMed] [Google Scholar]
- 16. Corbeil D, Roper K, Fargeas CA, Joester A, Huttner WB. Prominin: a story of cholesterol, plasma membrane protrusions and human pathology. Traffic 2001; 2 (2): 82–91. [DOI] [PubMed] [Google Scholar]
- 17. Nagano O, Saya H. Mechanism and biological significance of CD44 cleavage. Cancer Sci 2004; 95 (12): 930–5. [DOI] [PMC free article] [PubMed] [Google Scholar]
- 18. Dallas NA, Xia L, Fan F et al. Chemoresistant colorectal cancer cells, the cancer stem cell phenotype, and increased sensitivity to insulin‐like growth factor‐I receptor inhibition. Cancer Res 2009; 69 (5): 1951–7. [DOI] [PMC free article] [PubMed] [Google Scholar]
- 19. Bao S, Wu Q, McLendon RE et al. Glioma stem cells promote radioresistance by preferential activation of the DNA damage response. Nature 2006; 444 (7120): 756–60. [DOI] [PubMed] [Google Scholar]
- 20. Sagar J, Chaib B, Sales K, Winslet M, Seifalian A. Role of stem cells in cancer therapy and cancer stem cells: a review. Cancer Cell Int 2007; 7: 9. [DOI] [PMC free article] [PubMed] [Google Scholar]
- 21. Smith LM, Nesterova A, Ryan MC et al. CD133/prominin‐1 is a potential therapeutic target for antibody‐drug conjugates in hepatocellular and gastric cancers. Br J Cancer 2008; 99 (1): 100–9. [DOI] [PMC free article] [PubMed] [Google Scholar]
- 22. Kapiteijn E, Marijnen CA, Nagtegaal ID et al. Preoperative radiotherapy combined with total mesorectal excision for resectable rectal cancer. N Engl J Med 2001; 345 (9): 638–46. [DOI] [PubMed] [Google Scholar]
- 23. Swedish Rectal Cancer Trial . Improved survival with preoperative radiotherapy in resectable rectal cancer. N Engl J Med 1997; 336 (14): 980–7. [DOI] [PubMed] [Google Scholar]
- 24. Sauer R, Becker H, Hohenberger W et al. Preoperative versus postoperative chemoradiotherapy for rectal cancer. N Engl J Med 2004; 351 (17): 1731–40. [DOI] [PubMed] [Google Scholar]
- 25. Glimelius B, Sorbye H, Balteskard L et al. A randomized phase III multicenter trial comparing irinotecan in combination with the Nordic bolus 5‐FU and folinic acid schedule or the bolus/infused de Gramont schedule (Lv5FU2) in patients with metastatic colorectal cancer. Ann Oncol 2008; 19 (5): 909–14. [DOI] [PubMed] [Google Scholar]
- 26. Sobin L, Wittekind C. International Union Against Cancer (UICC). TNM Classification of Malignant Tumors, 6th edn. New York: John Wiley‐Liss, Inc., 2002. [Google Scholar]
- 27. Dworak O, Keilholz L, Hoffmann A. Pathological features of rectal cancer after preoperative radiochemotherapy. Int J Colorectal Dis 1997; 12 (1): 19–23. [DOI] [PubMed] [Google Scholar]
- 28. Wheeler JM, Warren BF, Jones AC, Mortensen NJ. Preoperative radiotherapy for rectal cancer: implications for surgeons, pathologists and radiologists. Br J Surg 1999; 86 (9): 1108–20. [DOI] [PubMed] [Google Scholar]
- 29. Shia J, Guillem JG, Moore HG et al. Patterns of morphologic alteration in residual rectal carcinoma following preoperative chemoradiation and their association with long‐term outcome. Am J Surg Pathol 2004; 28 (2): 215–23. [DOI] [PubMed] [Google Scholar]
- 30. Rullier A, Laurent C, Vendrely V, Le Bail B, Bioulac‐Sage P, Rullier E. Impact of colloid response on survival after preoperative radiotherapy in locally advanced rectal carcinoma. Am J Surg Pathol 2005; 29 (5): 602–6. [DOI] [PubMed] [Google Scholar]
- 31. Mandard AM, Dalibard F, Mandard JC et al. Pathologic assessment of tumor regression after preoperative chemoradiotherapy of esophageal carcinoma. Clinicopathologic correlations. Cancer 1994; 73 (11): 2680–6. [DOI] [PubMed] [Google Scholar]
- 32. Kojima M, Ishii G, Atsumi N, Fujii S, Saito N, Ochiai A. Immunohistochemical detection of CD133 expression in colorectal cancer: a clinicopathological study. Cancer Sci 2008; 99 (8): 1578–83. [DOI] [PMC free article] [PubMed] [Google Scholar]
- 33. Tran TA, Kallakury BV, Sheehan CE, Ross JS. Expression of CD44 standard form and variant isoforms in non‐small cell lung carcinomas. Hum Pathol 1997; 28 (7): 809–14. [DOI] [PubMed] [Google Scholar]
- 34. Horst D, Kriegl L, Engel J, Kirchner T, Jung A. CD133 expression is an independent prognostic marker for low survival in colorectal cancer. Br J Cancer 2008; 99 (8): 1285–9. [DOI] [PMC free article] [PubMed] [Google Scholar]
- 35. Itamochi H, Kigawa J, Terakawa N. Mechanisms of chemoresistance and poor prognosis in ovarian clear cell carcinoma. Cancer Sci 2008; 99 (4): 653–8. [DOI] [PMC free article] [PubMed] [Google Scholar]
- 36. Weller M. Predicting response to cancer chemotherapy: the role of p53. Cell Tissue Res 1998; 292: 435–45. [DOI] [PubMed] [Google Scholar]
- 37. Calabrese C, Poppleton H, Kocak M et al. A perivascular niche for brain tumor stem cells. Cancer Cell 2007; 11 (1): 69–82. [DOI] [PubMed] [Google Scholar]
- 38. Brabletz T, Jung A, Spaderna S, Hlubek F, Kirchner T. Opinion: migrating cancer stem cells ‐ an integrated concept of malignant tumour progression. Nat Rev Cancer 2005; 5 (9): 744–9. [DOI] [PubMed] [Google Scholar]
- 39. Du L, Wang H, He L et al. CD44 is of functional importance for colorectal cancer stem cells. Clin Cancer Res 2008; 14 (21): 6751–60. [DOI] [PubMed] [Google Scholar]
- 40. Huh Jw, Kim HR, Kim YJ et al. Expression of standard CD44 in human colorectal carcinoma: association with prognosis. Pathol Int 2009; 59: 241–6. [DOI] [PubMed] [Google Scholar]
- 41. Horst D, Kriegl L, Engel J, Kirchner T, Jung A. Prognostic significance of the cancer stem cell markers CD133, CD44, and CD166 in colorectal cancer. Cancer Invest 2009; 27: 844–50. [DOI] [PubMed] [Google Scholar]
- 42. Shimada Y, Ishii G, Nagai K et al. Expression of podoplanin, CD44, and p63 in squamous cell carcinoma of the lung. Cancer Sci 2009; 100 (11): 2054–9. [DOI] [PMC free article] [PubMed] [Google Scholar]