

Abstract
Breast cancer, a worldwide disease with increasing incidence, develops from ductal/lobular epithelium. Nipple aspirate fluid (NAF), secreted from the breast ducts and lobules, can be analyzed to assess breast metabolic activity. P‐cadherin is frequently over‐expressed in high‐grade invasive breast carcinomas and has been reported to be an enhancer of migration and invasion of breast cancer cells, being correlated with tumor aggressiveness. The present study analyzed the soluble fragment of P‐cadherin in milk, NAF and matched plasma samples of healthy subjects and in women with precancer conditions and breast cancer. Soluble P‐cadherin was detected in all plasma and milk samples, and in about 31.3% of NAF samples. The lowest levels of soluble P‐cadherin were found in plasma, with no significant difference among NoCancer, PreCancer and Cancer patients. The highest concentration of soluble P‐cadherin was detected in milk collected during the first trimester of lactation, significantly with respect to all NAF samples. There were significantly higher levels of soluble P‐cadherin in NAF from Cancer patients than those in women with NoCancer and PreCancer (P < 0.0001). Although no significant difference was found between in situ and invasive breast cancer, soluble P‐cadherin levels were found at high concentrations in c‐erbB‐2‐positive tumors, showing a positive correlation with disease stage grouping and tumor grade, and an inverse relationship with estrogen/progesterone receptor status. High levels of the soluble fragment of P‐cadherin in Cancer NAF suggest its possible release via proteolytic processing, favoring cancer cell detachment from breast duct, and suggesting that measuring soluble P‐cadherin in NAF may improve the identification of women with increased breast cancer risk. (Cancer Sci 2008; 99: 2160–2169)
Abbreviations:
- BC
breast cancer
- NAF
nipple aspirate fluid
- BBD
benign breast disease
- P‐cad
P‐cadherin
- sP‐cad
soluble form of P‐cadherin
- MMP
matrix metalloproteinase
- ADH
atypical ductal hyperplasia
- DCIS
ductal carcinoma in situ
- IBC
invasive breast cancer
- HER‐2
c‐erbB‐2 protein
- ER
estrogen receptor
- PR
progesterone receptor
- PBS
phosphate‐buffered saline
Breast cancer (BC) is the most common worldwide malignancy in women.( 1 ) The increasing incidence of BC underlies the importance of discovering the mechanism(s) involved in breast tumorigenesis,( 2 , 3 ) and the urgent need to identify early biomarkers for diagnostic/prognostic accuracy.( 2 ) The etiology of BC is multifactorial, and is manifest as inappropriate cell growth, faulty cell differentiation and improper cell–cell and cell–extracellular matrix interactions.( 4 ) All of these processes involve cadherin family members, multifunctional Ca2+‐dependent single‐pass transmembrane glycoproteins; they promote and maintain cell–cell and cell–matrix adhesion through their extracellular domain, whereas the intracellular domain interacts with cytoplasmic proteins (e.g. catenins, actin and cytoskeletal filaments).( 5 ) The result of cadherin‐dependent signaling affects such fundamental cellular processes as proliferation, survival, differentiation, shape and migration, which in turn influence tissue morphogenesis and structure, also in pathogenic events such as cancerogenesis and metastasization.( 6 , 7 )
Polarized epithelial cells lining the breast ducts and alveoli face the lumen and are contiguous with the exterior. They express epithelial cadherin (E‐cad), which is linked to both catenins and cytoskeleton.( 8 ) Basal to the lumen epithelial cell layer, there are myoepithelial cells, which arise from the differentiation of cap cells with stem behavior.( 9 ) These cells, playing a role in milk extrusion and maintaining the ductal phenotype, express only placental cadherin (P‐cad). In this manner, E‐cad knits the epithelial cells, whereas P‐cad links together the myoepithelial cells, producing two compartments in the mammary gland, one facing the lumen and the other the basement membrane.( 8 , 9 )
The gene encoding P‐cadherin (CDH3) is far less well characterized than is CDH1 (gene encoding for E‐cad), although sharing 66% homology and mapping to chromosome 16q22.1, a region that contains a cluster of several cadherin genes.( 10 ) The mature P‐cadherin glycoprotein has a molecular weight of 118 kDa, and its structure is similar to that of classical cadherins but different from those of E‐cadherin and N‐cadherin in terms of immunological specificity and molecular mass; it is comprised of three distinct domains (extracellular, transmembrane and cytoplasmic).( 11 ) Cadherin cell–cell adhesion proteins are critical for the formation of tissues from single cells and both P‐ and E‐cadherins play important roles in the architecture and functions of the normal mammary gland.( 8 ) In the mouse model, gene manipulation of P‐cad revealed precocious mammary gland development and early growth and differentiation of epithelial cells, related to abnormal cross talk between the epithelial and myoepithelial layers.( 9 ) In the normal, non‐lactating mouse mammary gland, P‐cad expression is restricted to the myoepithelium, playing a crucial role in cell adhesion.( 12 , 13 ) In human milk during lactation, an 80‐kDa protein, representing the soluble fragment of extracellular domain of P‐cad (sP‐cad) secreted by luminal epithelial cells, was found at significantly higher concentration with respect to serum.( 14 ) On the contrary, in the non‐lactating gland, P‐cad was found as an 118‐kDa protein only at sites of cell–cell contact between myoepithelial cells, while it was not present in ductal epithelial cells.( 8 , 12 , 13 ) A recent review has reported the most important findings on P‐cad expression and functions in normal mammary tissue and breast cancer cells, with particular emphasis on its localization in carcinoma with different invasive properties and its role as prognostic indicator.( 15 ) In particular, several breast cancer cell lines and a subset of human breast ductal (but not lobular) cancer strongly express P‐cad, which positively correlates with high histologic grade, lack of estrogen/progesterone receptors, increased tumor aggressiveness, high c‐erbB‐2 and proliferation rate and poor prognosis.( 16 , 17 , 18 , 19 , 20 , 21 , 22 , 23 , 24 ) Even though it has been demonstrated that serum levels of P‐cad fragments did not correlate with the presence of BC,( 25 ) the secretion of sP‐cad fragments, generated through proteolytic cleavage, in particular by matrix metalloproteinase,( 26 ) play a role in the breast microenvironment and in BC initiation/evolution, thus representing a potential early biomarker to identify women at higher BC risk.( 6 , 15 , 18 , 21 , 24 , 27 )
Currently available BC screening tools (such as mammography and breast examination) miss 10–40% of early BC. An invasive needle or surgical biopsy must be performed when an area of suspicion is identified to confirm, by cytologic or histologic evaluation, the presence of malignancy, even though 66–85% of abnormalities are benign.( 28 ) The development of non‐invasive techniques that would distinguish between women with or without BC is therefore of crucial importance and a matter of continuous efforts.( 2 )
The adult non‐pregnant, non‐lactating breast secretes fluid into the breast ductal system that can be easily and non‐invasively obtained through nipple aspiration. It is a low‐cost procedure with minimal or no discomfort providing a fluid that represents the mirror of the breast ductal microenvironment, potentially ideal to evaluate the effect of a chemopreventive or a chemotherapeutic agent.( 29 ) Nipple aspirate fluid (NAF) can be obtained in more than 90% of pre‐ and postmenopausal subjects and consists of secreted proteins and cells sloughed from ductal and lobular epithelium,( 30 ) containing several biomarkers( 31 , 32 , 33 , 34 ) and proteinases ( 35 , 36 ) that are potentially useful as epidemiological and clinical research tools.( 2 , 37 , 38 ) Because BC develops from ductal and lobular epithelium, the analysis of NAF has attracted considerable interest as a window to assess the metabolic activity within the mammary gland.( 38 , 39 , 40 ) Validation of nipple aspiration as a technique to screen for BC requires the demonstration that one or more biological markers in the fluid (such as P‐cadherin) correlate with breast tissue pathology and thus predict the breast disease. To non‐invasively assess the expression of sP‐cad in NAF and to determine its potential clinical utility, we analyzed sP‐cad levels in NAF collected from healthy subjects and patients affected by breast cancer, directly analyzing the secretion of sP‐cad fragments by breast ductal/lobular cells. Moreover, we compared the concentration of sP‐cad fragments found in NAF samples with respect to those circulating in plasma and accumulated in human milk samples collected during the first trimester of lactation. Furthermore, we have also correlated the sP‐cad levels in NAF with the breast tissue expression of P‐cad and several clinico‐pathological characteristics of BC. So, the main focus of the current study was to analyze both systemic (serum) and organ‐specific (NAF and milk) body fluids, breast cells floating in NAF and breast tissues, to determine if soluble P‐cadherin levels in the specimens were (1) concentrated in NAF compared with serum and milk, (2) influenced by menopausal status and correlated to clinico‐pathologic variables and (3) increased in the progression of disease comparing healthy women with women with precancer and to women with breast cancer.
Materials and Methods
Subjects and sample collection. Women were required to give written informed consent; the present work was carried out in accordance with the ethical standards of the Helsinki Declaration and after the approvals of the Ethics Committee of the University ‘Carlo Bo’ of Urbino (protocol 18/CE). Among all subjects recruited (313 women), we excluded 29 patients owing to pregnancy within 3 years or who were medically treated during the previous year. Of the remaining 284 subjects, NAF was successfully collected in about 92% (262 women), using a modified breast pump in calibrated capillary tubes as described elsewhere.( 30 ) The median volume of NAF collected was 25 µL (range 5–600 µL). Without pooling, samples were snap‐frozen and stored at –80°C until use. We also collected milk samples from 20 healthy women during the first trimester of lactation, and after centrifugation the clear supernatants were stored at –80°C. The median age of the lactating women did not significantly differ from that of the other control subjects recruited. Five milliliters of blood were also collected from the subjects, in citrate‐containing devices, spun for 10 min at 1000g at 4°C, and the plasma supernatant was drawn and stored at –80°C until use. On the basis of whether the subject had biopsy‐proven newly diagnosed BC, biopsy‐proven evidence of the diagnosis that increased their risk of BC, or neither of these, enrolled subjects were classified into one of three risk categories: (1) ‘Cancer’, if there was evidence of ductal carcinoma in situ (DCIS) or invasive breast cancer (IBC); (2) ‘PreCancer’, if the subject had atypical duct hyperplasia (ADH); or (3) ‘NoCancer’, if neither precancer nor cancer was present. NAF and tissue samples were analyzed from only one breast. For subjects with precancer or cancer, NAF and tissue were analyzed from the breast with known disease. NAF was successfully collected from 262 non‐lactating women (ages ranged from 29 to 82 years): 154 healthy women without evidence of precancer or cancer (NoCancer), 17 patients with ADH (PreCancer) and 91 patients with biopsy proven BC (20 DCIS and 71 IBC patients) (Cancer). NAF samples from Cancer patients were always collected before the biopsy and/or surgical treatment in the breast with disease. For subjects with PreCancer or Cancer, NAF and tissues were analyzed from the breast with known disease and routinely visualized by ecographic and mammography procedures. Cancer and PreCancer patients did not show any abnormal nipple discharge. Clinico‐pathological characteristics (e.g. disease stage, tumor size, nodal status, or distant disease spread) were determined according to the American Joint Committee on Cancer tumor–node–metastases (TNM) staging system for breast cancer.( 41 )
Immunoassay for soluble P‐cadherin. sP‐cad concentrations were measured using a DuoSet enzyme‐linked immunosorbent assay (ELISA) Development kit, according to the manufacturer's instructions (R & D Systems, Abingdon, UK). Briefly, 96‐well immunoplate was coated with 100 µL per well of the monoclonal mouse antihuman P‐cadherin (capture antibody) and incubated overnight at room temperature. The wells were washed with phosphate‐buffered saline (PBS) containing 0.05% Tween‐20 and quenched at 37°C with PBS containing 1% bovine serum albumin (BSA) for at least 1 h. After washing, 100 µL of sample or standards were added per well for at least 2 h at room temperature. All samples were eventually diluted in PBS containing 0.1% BSA; a dilution series of recombinant P‐cad/Fc chimera from 1 to 1000 ng/mL was prepared. Next, the plates were washed four times and subsequently incubated with 100 µL of diluted biotinylated goat antihuman P‐cadherin (detection antibody) for 2 h at room temperature. After accurate washing, 100 µL of streptavidin–horseradish peroxidase was added to each well of the plates and incubated at room temperature. After 20 min, gentle washing was repeatedly performed with 0.05% Tween‐20 in PBS pH 7.4, and 100 µL of substrate solution containing a mixture of hydrogen peroxide and tetramethylbenzidine (color reagents) was added to each well, incubating for 20 min at room temperature. Finally, after stopping the development reaction, the optical density of each well was determined using a microplate reader set to 450 nm with a wavelenght correction (FLUOstar Optima, BMG Labtech, Milan, Italy). In control experiments, we omitted the primary antibody. A standard curve was prepared using serial dilutions of recombinant P‐cad/Fc chimera. A linear regression equation was created from standards of known P‐cad concentrations and P‐cad levels of unknown samples were fit to the standard curve regression equation, corrected for aliquot volume and expressed as µg of P‐cad/mL of original sample. The standard curve, NAF, serum and milk samples were run in duplicate and the average of the two values was reported. The goodness of fit for all samples was 0.989. Total protein concentrations in NAF samples were determined using bicinchoninic protein assay kit (Pierce, Rockford, IL). NAF results are presented based on total protein concentrations.
Cell culture and reagents. Breast cancer cell lines (BT‐20 and T47D) were purchased from ATCC (American type culture collection, Rockville, MD, USA) and maintained in cell culture at 37°C in a humidified 10% CO2 atmosphere in accordance with the supplier's instructions (Dulbecco's modified Eagle's medium [DMEM] containing 10% heat‐inactivated FBS, 100 IU/mL penicillin, 100 µg/mL streptomycin and 2.5 µg/mL amphotericin B). Cultured cells were grown to 80% confluence in 6‐cm tissue culture dishes, washed with PBS and then lyzed as described below. All unspecified reagents were purchased from Sigma‐Aldrich (Milan, Italy). To prepare whole cell lysates, monolayer cultures of human breast cancer cells grown to confluence in 10‐cm tissue culture plates were washed twice with ice‐cold PBS and lyzed in ice‐cold buffer containing 20 mM Tris‐HCl pH 7.4, 150 mM NaCl, 10% glycerol, 5 mM ethylenediaminetetraacetic acid (EDTA), 10 mM NaF, and 1% Triton X‐100 supplemented with 1 mM Na3VO4, 1 mM phenylmethylsulfonyl fluoride (PMSF), 10 µg/mL aprotinin, and 10 µg/mL leupeptin followed by centrifugation at 13 000 × g for 20 min at 4°C.
Proteolytic digestion of P‐cadherin by Nipple Aspirate Fluid proteinases. To preliminarily test the ability of NAF to digest P‐cadherin, we determined the proteinase activity by incubating 1 µL of Cancer NAF sample with 25 µL of 1% recombinant P‐cad in 0.1 M sodium phosphate at pH 3 and 7.5. After 2 h at 37°C, aliquots of 1 µL were removed, heated for 5 min at 90°C in sodium dodecylsulfate (SDS)‐reducing sample buffer and analyzed by 10% SDS–polyacrylamide gel electrophoresis (PAGE). For inhibition assays, aliquots of 1 µL from NAF were preincubated in 5 µL of 20 mM sodium phosphate pH 7.0 with 20 mM PMSF and 0.1 M EDTA, serine proteinase and calcium‐dependent metalloproteinase inhibitors. After 1 h at room temperature, 20 µL of 1% recombinant P‐cad in 0.1 M sodium phosphate pH 7.5 were added. The reaction mixture was incubated for 2 h at 37°C and analyzed by SDS‐PAGE as above.
Electrophoretic analyses and quantitative densitometric assays. Immunoprecipitation of sP‐cad present in NAF and milk samples was performed using an IPeX column, according to the manufacturer's recommendations (GeBA, Gene Bio‐Application, Milan, Italy). Briefly, agarose beads were coupled with P‐cadherin mouse antihuman monoclonal antibody overnight at 4°C (clone NCC‐CAD‐299 against extracellular domain; Zymed Laboratories, Milan, Italy). Ten µL of a 6%‐bead slurry has an antibody‐binding capacity of 90 µg. After washing and stabilization of the covalently immobilized antibody for 30 min, the crude samples were added to the column (range 10–100 µL) and incubated for 5 h with gentle end‐over‐end mixing at 4°C. After five repeated washing and centrifugation at 3500g, the antigen was eluted from the agarose beads and mixed with Laemmli sample buffer, treated with denaturing sample buffer in both non‐reducing and reducing conditions, separated by SDS 10% polyacrylamide gels, and stained with standard Coomassie brilliant blue R‐250.
Immunoprecipitated sP‐cad, resolved on SDS‐PAGE minigels, were then subjected to Western blot analysis as previously described.( 42 ) Briefly, the minigels were transferred to a nitrocellulose sheet according to the Towbin's method, using a commercially available semidry blot apparatus (Bio‐Rad, Milan, Italy). Sheets were saturated in PBS containing 2% non‐fat dry milk and 4% bovine serum albumin (BSA) for 60 min at 37°C, and then incubated overnight at 4°C in the same buffer containing diluted monoclonal and polyclonal antipan cadherin antibodies (clone NCC‐CAD‐299 against extracellular domain, and clone ZyPC7 against pan‐cadherin protein, respectively) (Zymed Laboratories, Milan, Italy). After three washes in PBS, containing 0.1% Tween‐20, the sheet was incubated for 30 min at room temperature with 1:2000 diluted peroxidase‐conjugated goat antimouse immunoglobulin G (IgG) in PBS/Tween‐20 and washed as above. Immunoreactive bands were visualized by the horseradish peroxidase/4 CN colorimetric method, using a commercially available kit (Bio‐Rad). This method detected as little as 30 pg of soluble protein. Biotinylated low molecular mass markers (Bio‐Rad) and recombinant P‐cad (R & D Systems) were used as molecular weight calibrators and positive control for full‐length intact P‐cad, respectively. To quantitatively evaluate the soluble fraction of P‐cad (after immunoprecipitation, electrophoretic separation and Western blotting) the immunoreactive bands were submitted to computer‐assisted densitometric scan through Image Pro‐Plus software (Media Cybernetics, Silver Spring, MD, USA). Results were expressed as mean ± standard error of optical density arbitrary units, and then transformed in µg/mL after the construction of a reference curve with known amounts of recombinant P‐cad protein (1.25, 2.5, 5.0, 7.5, 10.0 µg).
Immunohistochemistry of P‐cad in breast tissues. After routine processing, the formaldehyde‐fixed, paraffin‐embedded breast tissue was immunohistochemically studied using standard methods; sections (3‐µm thickness) were cut from paraffin blocks, dewaxed and hydrated. Endogenous peroxidase was blocked with 3% hydrogen peroxide in methanol for 10 min. Sections were submitted to protein blockage with normal goat serum and incubated with a monoclonal antibody against P‐cad (clone NCC‐CAD‐299 against extracellular domain, from Zymed Laboratories, Milan, Italy). Immunostaining was performed using the avidin–biotin peroxidase complex, with an antibody dilution of 1:50 (v:v), as previously described.( 17 , 21 ) Antigen retrieval was carried out by a 100°C treatment in 10 mMol citrate buffer, pH 6.0 for 30 min. Subsequently, the section were counterstained with Mayer's hematoxylin, dehydrated, cleared and mounted. Positive and negative controls were always included with each batch of staining to ensure consistency between consecutive runs. Paraffin sections of normal breast tissue were used as a positive control for P‐cad because myoepithelial cells are always positive for this protein.( 21 )
Immunocytochemical localization of sP‐cad in breast cells floating in NAFs. For electron microscopy analysis, NAF samples (immediately after collection) were prepared for immunocytochemical studies as previously described.( 33 , 37 , 42 ) Briefly, the specimens were mixed 1:1 (v:v) with the fixative solution (0.1 M Sorensen phosphate‐buffered 8% paraformaldehyde and 1% glutaraldehyde, pH 7.4) for 1 h at 4°C, after which the cell suspensions were centrifuged at 340 × g at 4°C for 15 min. The cell pellets were washed in 0.1 M Sorensen buffer pH 7.4 and embedded in 1.5% agar‐agar. After washing in PBS, free aldehydes were blocked in 0.5 M ammonium chloride in PBS at 4°C for 45 min. Following washing in PBS, the specimens were dehydrated through graded concentrations of ethanol and embedded in LRWhite resin that was polymerized with UV light. Ultra‐thin sections were placed on nickel grids coated with a Formvar–carbon layer and then processed according to the following protocol for immunocytochemistry: the sections were floated for 3 min on normal goat serum diluted 1:100 (v:v) in PBS and then incubated for 18 h at 4°C with mouse antihuman monoclonal and polyclonal anticadherin antibodies (clone NCC‐CAD‐299 against extracellular domain, and clone ZyPC7 against pan‐cadherin protein, respectively) (Zymed Laboratories, Milan, Italy), diluted 1:10 (v:v) with a solution containing 0.1% BSA and 0.05% Tween‐20 in PBS. After rinsing, sections were floated on normal goat serum and then reacted for 30 min at room temperature with the secondary gold‐conjugated antibody (Jackson ImmunoRes Laboratories, West Grove, PA, USA) diluted 1:100 (v:v) in PBS. Following the last incubation, the sections were rinsed, air‐dried and stained with lead citrate. Control grids were treated with the incubation mixture without the primary antibody, then processed as described above. The specimens were observed in a Zeiss EM 902 electron microscope operating at 80 kV. Gold grains present over cytoplasmic areas were analyzed on 15 randomly selected electron micrographs (final magnification ×42 000).
Statistical analyzes. For sP‐cad levels in NAF, serum and milk samples, median values (range, minimum and maximum) of continuous variables were computed for the various groups of subjects. Because of the potential non‐normality of the data, ranking procedures were used for all analyses with continuous variables. The Wilcoxon Rank Sum test was used to compare independent groups (e.g. pre versus postmenopausal women, Cancer versus Benign group, etc.); the Wilcoxon Signed Ranks test was used for within group comparison. When three or more groups were compared, the Kruskal–Wallis test was used. Spearman test was used for correlation analyses. The age‐adjustment was based on the gamma distribution.( 43 ) In all instances, significance was set at P < 0.05. Data were analyzed using Prism software (Graph‐Pad, San Diego, CA, USA).
Results
Subjects. From two hundred and eighty‐four women studied, in 262 subjects (aged 29–82) we were able to collect NAF samples (about 92% of successful collection). Median age of the subjects ranged from 42 years in the NoCancer to 56 in the Cancer group. In both groups, most subjects were in postmenopausal status; among the clinical/demographic variables compared, only age was related to Cancer status. In fact, women with biopsy‐proven BC (Cancer patients) tended to be older than healthy counterparts (NoCancer subjects) (Table 1). Although the age was different between cases and controls, no statistically significant correlation between sP‐cad levels and women age was found; the age‐adjustment did not affect sP‐cad concentrations (data not shown).
Table 1.
Demographic data for women analyzed in the present study (n = 262)
| No cancer † | Pre‐cancer ‡ | Cancer § | |
|---|---|---|---|
| Samples (%) | 154 (58.8) | 17 (6.5) | 91 (34.7) |
| Age, median years (range) | 42 (29–51) | 46 (30–69) | 56 (48–82) |
| Premenopausal (%) | 71 (46.1) | 6 (35.3) | 30 (32.9) |
| Race (%) | |||
| Caucasian | 91 (59.1) | 13 (76.5) | 49 (53.8) |
| African American | 63 (40.9) | 4 (23.5) | 42 (46.2) |
| Use of birth control pills (%) | 56 | 58 | 45 |
Subjects in which neither precancer nor cancer was present.
Patients with atypical duct hyperplasia.
Patients with evidence of ductal carcinoma in situ or invasive breast cancer.
Consistency of the assays. After dilutions (ranging from 8‐ to 80‐fold) of NAF containing high sP‐cad levels, a significant linearity of dilution, and a correlation with sP‐cad was found (Y = –0.14 + 72.12x, r 2 = 0.989). The mean (±SEM) of analytical recovery percentage of recombinant P‐cad added to the samples was 97(5)%. Intra‐ and interassay CV with NAF samples were 4% and 7%, respectively. The curve generated using spiked samples paralleled the standard curve (data not shown). These data suggest that the milk and NAF ‘matrix’ (i.e. proteins, hormones, and lipids present in breast secretions) did not affect the P‐cad immunoassay performance, originally developed for plasma/serum specimens.
Isolation of soluble P‐cad in milk and full‐length P‐cad in breast cancer cell lines. The IPeX agarose bead columns allowed us to isolate free soluble P‐cadherin fragments from both milk and NAF samples. In milk samples from 20 healthy women during the first trimester of lactation, immunoprecipitation with mouse antihuman P‐cadherin monoclonal antibody (against the extracellular domain) yielded a single band with molecular weight of 80 kDa, the known size of sP‐cad. Full‐length P‐cadherin with size of 118 kDa was not detected in human milk, but was found in cell lysates derived from BT‐20 and T47D breast cancer cell lines using the antihuman pan‐cadherin polyclonal antibody. So, while the mouse antihuman P‐cadherin mAb against the extracellular domain detected the 80‐kDa protein, the antihuman pan‐cadherin (polyclonal antibody directed to the intracellular domain of all cadherin family members) did not, suggesting that in milk only the extracellular domain fragment was present (Fig. 1a).
Figure 1.
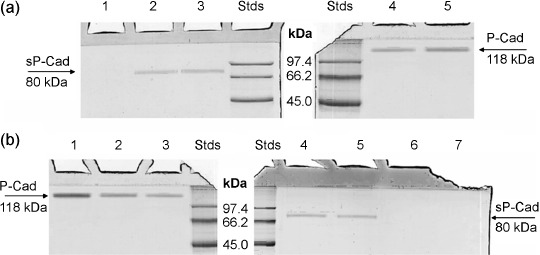
Soluble fragment of P‐cadherin and P‐cadherin protein in milk, nipple aspirate fluid (NAF) samples and in lysates of BT‐20 and T47D breast cancer cell lines. (a) Immunoprecipitated proteins of milk samples collected 20 days after delivery were loaded in lanes 1–3. When using the pan P‐cad antibody (against intracellular domain of full‐length P‐cad) no band was found in milk (lane 1), whereas the monoclonal antibody against P‐cad extracellular domain revealed in the same milk sample only the soluble fragment of P‐cad (lane 2); this data was also confirmed in milk sample collected 10 days after delivery (lane 3). Cell lysates of BT‐20 and T47D breast cancer cells were also loaded in lane 4 and 5, respectively. In lanes Stds, the standard proteins with their molecular masses expressed in kDa are visualized. The arrows indicate the position of soluble fragment and full‐length P‐cadherin, at molecular mass of 80 and 118 kDa, respectively. (b) Recombinant full‐length P‐cadherin protein was loaded in lane 1, whereas P‐cadherin protein obtained from BT‐20 and T47D breast cancer cell lines was visualized in lane 2 and 3, respectively. The two same NAF samples with high levels of sP‐cad were immunoprecipitated using monoclonal antibody against P‐cad extracellular domain (lanes 4 and 5) and with the pan P‐cad antibody against intracellular domain of full‐length P‐cad (lanes 6 and 7). The standard proteins with their molecular masses expressed in kDa are visualized in lanes Stds. The arrows indicate the position of soluble fragment and full‐length P‐cadherin, at molecular mass of 80 and 118 kDa, respectively.
Using recombinant human P‐cadherin as standard and analyzing the linearity of reference curve, we estimated by both computer‐assisted densitometry and ELISA quantitative assay that the sP‐cadherin median concentration in milk collected during the first trimester of lactation is 12.40 µg/mg protein (n = 20, range 10.1–14.7 µg/mg protein). Our results are within the range of the known levels of human milk soluble P‐cadherin,( 14 ) which are one to four thousand‐fold higher than those found in female serum.( 25 )
sP‐cad is present in NAF and significantly increased in breast cancer patients. The sP‐cad fragment with a molecular mass of 80 kDa was detected through immunoprecipitation and subsequent Western blot (using monoclonal antibody against P‐cad extracellular domain) in 31.3% of NAF samples examined (82 out of 262). On the contrary, using the pan P‐cadherin antibody (detecting intracellular domain of full‐length P‐cadherin) no P‐cad was isolated and immunologically recognized in NAF, suggesting that the soluble fragment of P‐cad was present in NAF (Fig. 1b); occasionally, a faint band of about 40 kDa was detected only in Cancer NAF (data not shown). The pan P‐cad antibody recognizes in both BT‐20 and T47D human breast cancer cell lines a characteristic full‐length P‐cadherin with size of 118 kDa.
To evaluate if sP‐cad was actively concentrated in breast fluids, we compared levels of sP‐cad in milk and NAF with those in matched plasma (Table 2). Except for plasma samples (in which sP‐cad was expressed in ng/mg protein), all the results of sP‐cad in breast fluids were expressed in µg/mg of total protein, because total protein concentration can vary from sample to sample, expecially in NAF.( 30 , 32 , 38 ) sP‐cad was detectable in all milk and plasma samples, and only 31.3% of all NAF collected were found to be sP‐cad positive (82 out 262) (Table 2). In particular, sP‐cad showed appreciable levels in 20.1% of NoCancer (31 out of 154), 52.9% of PreCancer (9 out of 17) and 46.2% of Cancer (42 out of 91) NAF samples examined. Median concentration of sP‐cad in milk was 1.46‐fold higher (12.4 µg/mg, n = 20) than in all NAF samples (8.50 µg/mg, n = 82) (P < 0.0001). Moreover, sP‐cad levels in milk were always significantly higher with respect to NAF samples collected from NoCancer, PreCancer and Cancer patients (P < 0.0001; Table 2, Fig. 2a). sP‐cad in NAF from healthy subjects (NoCancer) showed the lowest median concentration (3.1 µg/mg, n = 31), significantly lower than women with PreCancer (5.8 µg/mg, n = 9; P < 0.0001) and women with Cancer (10.55 µg/mg, n = 42; P < 0.0001). In NAF samples collected from patients diagnosed with atypical duct hyperplasia (PreCancer patients), sP‐cad was detectable in about 52.9%, with a median concentration significantly higher with respect to that found in NAF from NoCancer women and significantly lower than in Cancer NAF (P < 0.0001; Table 2). Among BC patients, 42 out of 91 women (46.2%) showed detectable levels of sP‐cad, with significantly higher median levels with respect to both NoCancer and PreCancer women (Fig. 2a). No statistically significant differences between NAF collected from DCIS and IBC were found (P = 0.405) (Table 2). Among 42 BC patients that were sP‐cad positive, 22 had tumor confined to the breast, 16 had spread to axillary lymph nodes and four had distant disease spread; in these patients, a positive correlation between sP‐cad levels in NAF and disease stage was found (r 2 = 0.574, P = 0.0485) (Fig. 2b). Among 82 women with sP‐cad positive NAF, 28 women were in premenopause (median 5.85 µg/mg, range 2.6–11.1) and 54 in postmenopause (median 9.0 µg/mg, range 2.1–12.8); no significant difference of sP‐cad levels between menopausal groups was found (P = 0.302) (data not shown). In NoCancer and PreCancer subjects, no difference in sP‐cad levels was found between pre‐ and postmenopause (P = 0.839 and P = 0.277, respectively) (data not shown); whereas in the 42 Cancer patients we found that sP‐cad levels were significantly higher in postmenopausal women (n = 30, median 10.95 µg/mg, range 8.9–12.8) compared with premenopausal patients (n = 12, median 9.5 µg/mg, range 8.3–11.1) (P = 0.0002) (Fig. 2c).
Table 2.
Median levels of soluble fragment of P‐cadherin in milk, plasma and nipple aspirate fluid (NAF) samples based on cancer presence
| Soluble P‐cadherin, median (range) | |||
|---|---|---|---|
| Milk (N = 20; µg/mg) | NAF (N = 82; µg/mg) | Plasma (N = 65; ng/mg) | |
| Healthy (N = 20) | 12.40 (10.1–14.7) a , b , c , d | 1.36 (1.20–1.66) n | |
| Total (N = 82) | 8.50 (2.10–12.80) e , f , g | 1.30 (1.19–1.73) | |
| NoCancer (N = 31) | 3.10 (2.10–3.60) h , i | 1.31 (1.20–1.67) | |
| PreCancer (N = 9) | 5.80 (4.95–6.40),( 1 ) | 1.40 (1.20–1.71) | |
| Cancer (N = 42) | 10.55 (8.30–12.80) | 1.47 (1.19–1.70) | |
| Ductal carcinoma in situ (DCIS, N = 8) | 10.55 (8.30–11.00) m | 1.45 (1.24–1.69) | |
| Invasive breast cancer (IBC, N = 34) | 10.60 (8.70–12.80) | 1.44 (1.29–1.73) | |
Milk versus Total NAF: P < 0.0001.
Milk versus NoCancer NAF: P < 0.0001.
Milk versus PreCancer NAF: P < 0.0001.
Milk versus Cancer NAF: P < 0.0001.
Total NAF versus NoCancer NAF: P < 0.0001.
Total NAF versus PreCancer NAF: Not Significant (P = 0.515).
Total NAF versus Cancer NAF: P < 0.0001.
NoCancer NAF versus PreCancer NAF: P < 0.0001.
NoCancer NAF versus Cancer NAF: P < 0.0001.
PreCancer NAF versus Cancer NAF: P < 0.0001.
Cancer NAF–DCIS versus Cancer NAF–IBC: not significant (P = 0.405).
Not significant differences among all plasma samples.
Figure 2.
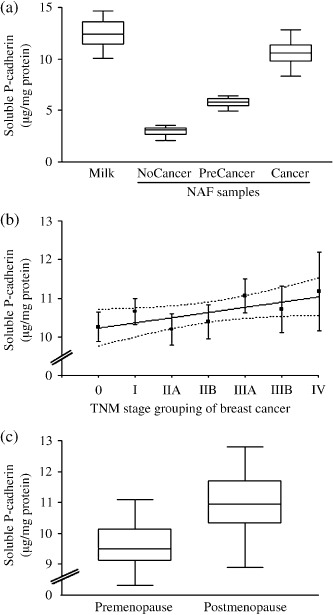
Levels of soluble fragment of P‐cadherin (expressed as µg/mg of total protein) detected in breast secretions. (a) sP‐cad concentrations were significantly higher in milk (n = 20) than in nipple aspirate fluid (NAF) samples collected from ‘NoCancer’ women (n = 31, P < 0.0001), subjects affected by ‘PreCancer’ (n = 9, P < 0.0001) and patients with breast ‘Cancer’ (n = 42, P < 0.0001). (b) Linear regression analysis (plus confidence interval of the curve) of soluble fragment of P‐cadherin levels (expressed as µg/mg of total protein) detected in cancer NAF samples based on tumor stage grouping, according to tumor–node–metastases (TNM) classification (n = 42, r 2 = 0.574, P = 0.0485). (c) Median levels of soluble P‐cadherin (sP‐cadherin) detected in NAF collected from ‘Cancer’ patients (n = 42) in pre‐ and postmenopausal status (n = 12 and n = 30, respectively) (*P = 0.0002).
For the comparison between NAF and breast tissue expression of P‐cadherin, we analyzed breast tissue specimens from all BC patients to evaluate the correlation between P‐cad expression and clinico‐pathologic characteristics. As shown in Table 3, there was a greater proportion of patients in the positive P‐cad group of tumors with negative estrogen/progesterone receptor status compared with the negative P‐cad group; in fact, estrogen or progesterone receptor negative status was found in 55% of the P‐cad‐positive tumors, whereas only 17% of the P‐cad‐negative tumors were estrogen/progesterone receptor negative (P < 0.0001). Moreover, when the frequency of P‐cad expression in BC was divided according to the histologic tumor grade, poorly differentiated BC (Grade 3) was more frequently P‐cad positive than negative (28.6%versus 14.3%, respectively; P = 0.002). In contrast, well differentiated tumors (Grade 1) were more frequently P‐cad negative than positive (26.6%versus 7.1%, respectively; P = 0.0006); no difference in the distribution of P‐cad‐positive and negative tumors in moderately differentiated tumors (Grade 2) was found. Finally, the majority of P‐cad‐positive cases was significantly related to c‐erbB‐2 expression (30.9%), whereas only 10.2% of P‐cad‐negative tumors expressed HER‐2 protein (P < 0.001).
Table 3.
Correlation between histochemical P‐cadherin expression and clinico‐pathologic variables of breast cancer tissue specimens (N = 91)
| Status | P‐cadherin positive (n = 42) | P‐cadherin negative (n = 49) |
|---|---|---|
| ER/PR negative † | 23 | 8 |
| ER/PR positive ‡ | 19 | 41 |
| Grade 1 | 3 | 13 |
| Grade 2 | 27 | 29 |
| Grade 3 | 12 | 7 |
| c‐erbB‐2 positive | 13 | 5 |
| c‐erbB‐2 negative | 29 | 44 |
ER: estrogen receptor; PR: progesterone receptor.
These include tumors negative for both receptor and tumors negative for either ER or PR.
These include tumors positive for both receptors.
Among the BC specimen tissues positive for P‐cad (n = 42) and characterized for some clinico‐pathologic characteristics (Table 3), we have analyzed in the corresponding NAF samples (always collected before the biopsy and/or surgical treatment in the breast with disease) the concentrations of the soluble form of P‐cad. As shown in Figure 3, NAF from Grade 2 tumors contained the highest sP‐cad levels (median 11.2 µg/mg, range 8.7–12.8 µg/mg), significantly higher with respect to Grade 1 and Grade 3 tumors (median 8.9 versus 9.8 µg/mg, respectively; P = 0.0086 and P = 0.0045, respectively). No significant difference was found for sP‐cad levels between NAF from BC of Grade 1 and 3 (P = 0.083). Moreover, in the higher proportion of BC tissues positive for P‐cad and ER/PR‐negative (23 out of 42) NAF samples contained significantly higher concentrations of sP‐cad with respect to BC P‐cad‐positive but ER/PR‐positive tumors (median 11.2 versus 9.7 µg/mg, respectively; P < 0.0001) (Fig. 3). Finally, the small proportion of BC tissue specimens positive for c‐erbB‐2 and P‐cad (13 out of 42) showed in the related NAF samples a significantly higher content of sP‐cad with respect to those negative for HER2 (median 11.7 versus 10.15 µg/mg, respectively; P < 0.0001).
Figure 3.
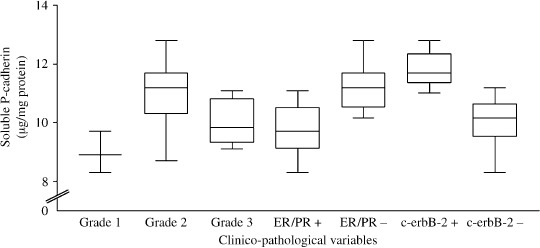
Levels of soluble fragment of P‐cadherin (sP‐cad, expressed as µg/mg of total protein) detected in breast secretions from breast cancer (BC) patients before surgery and/or biopsy, according to some clinico‐pathologic variables. Median levels of sP‐cad concentrations were significantly higher in nipple aspirate fluid (NAF) collected from Grade 2 tumors (n = 27) than in NAF samples collected from BC patients with Grade 1 and 3 tumors (n = 3 and n = 12, respectively; P = 0.0086 and P = 0.0045). NAF collected from ER/PR negative tumors contained significantly higher levels of sP‐cad respect to estrogen receptor (ER)/progesterone receptor (PR)‐positive tumors (n = 23 versus n = 19, P < 0.0001). Median levels of sP‐cadherin detected in NAF collected from ‘Cancer’ patients with c‐erbB‐2‐positive tissues (n = 13) were significantly higher compared with NAF collected from HER2‐negative tumors (n = 29, P < 0.0001).
In our series of plasma samples, no significant difference of sP‐cad content between women with and without BC was found; our range of sP‐cad levels in plasma (1.19–1.73 ng/mg protein) corresponds to a range of approximately 85–125 ng/mL, which falls within the range of 60–300 ng/mL of sP‐cad previously detected in serum from both healthy and BC women.( 25 ) So, our results, in accordance with previous studies,( 14 , 25 ) confirm that plasma sP‐cad concentrations were 1000/7000‐fold lower with respect to those commonly found in human milk during the first month of lactation; moreover, for the first time, we found that sP‐cad is 6000‐fold concentrated in NAF with respect to plasma and only 1.4‐fold lower than in milk, suggesting its accumulation in breast fluids through a shedding mechanism by the cells lining breast ductal tree.
Proteolytic digestion of P‐cadherin by NAF proteinases. From previous reports,( 31 , 35 , 36 ) it seemed reasonable to assume that a wide range of several proteinases may be present in NAF from women at high risk and bearing BC. To preliminarily identify the ability of NAF to digest full‐length P‐cadherin, we performed an incubation of protein substrate with NAF aliquots, at different pH and in the presence of some proteolytic inhibitors. The first attempts revealed that Cancer NAF did not show any proteolytic activity against P‐cad at acidic pH (only full‐length 118‐kDa P‐cad was detected, with no band at lower molecular mass). However, when activity was tested at neutral pH, NAF displayed strong proteolytic activity on recombinant P‐cad, showing the absence of full length P‐cad at 118 kDa concomitantly with the presence of its soluble forms at 80 kDa (Fig. 4). During the proteolysis, we also detected a protein fragment of 40 kDa, never found up to now. Inhibition studies showed that this proteolytic activity could be completely abolished by EDTA, a strong inhibitor of calcium/zinc‐dependent metalloproteinases; by contrast, PMSF (a serine proteinase inhibitor) did not show any effect (Fig. 4). These results suggest that the soluble fragment of P‐cadherin found in Cancer NAF may be the result of a specific proteolytic digestion by EDTA‐sensible neutral proteinase (e.g. Ca/Zn‐dependent matrix metalloproteinases).( 35 ) More studies are in progress to identify the subclasses of proteinases able to cleave soluble fragments from full length P‐cad and to characterize all the soluble fragments that may be obtained through proteolytic processing of P‐cad.
Figure 4.
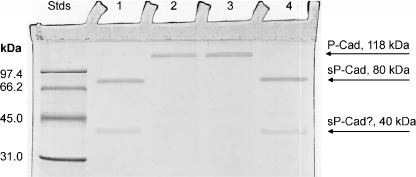
Digestion of recombinant full length P‐cadherin by nipple aspirate fluid (NAF) proteinases. 25 µL of 1% recombinant P‐cad in 0.2 M sodium phosphate pH 7.5 and 3.0 were incubated with 1 µL of NAF (lanes 1 and 2, respectively), and 1 µL of NAF previously incubated with 0.1 M ethylenediaminetetraacetic acid (EDTA) and 20 mM phenylmethylsulfonyl fluoride (PMSF) (lanes 3 and 4, respectively). After 2 h at 37°C, aliquots of 1 µL were analyzed using sodium dodecylsulfate–polyacrylamide gel electrophoresis (SDS‐PAGE) according to the Laemmli standard method. In Std lane, proteins of standard molecular masses were loaded; the protein molecular weight is expressed in kDa.
Immunolocalization of soluble P‐cadherin in human breast cells floating in NAF. Ultrastructural observations of immunolabeled samples revealed that the breast cells floating in NAF collected from Cancer localized sP‐cad mainly along the cell surface, displayed a cytoplasmic signal, whereas Golgi complexes were rarely labeled; cell nuclei, secretory vacuoles, free ribosomes and mitochondria never showed any labeling (Fig. 5a). Control samples showed only a negligible signal (data not shown).
Figure 5.
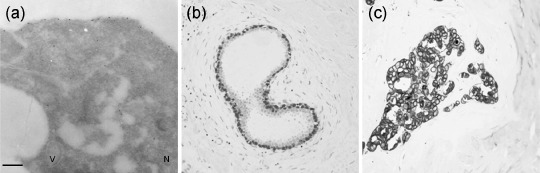
Immunolabeling of P‐cadherin in breast cells. (a) In breast cells floating in ‘Cancer’ nipple aspirate fluid (NAF) the labeling occurs along the cell surface and dispersed in the cytosol, whereas the cell nucleus (N), secretory vacuole (V), mitochondria and free ribosomes are devoid of gold grains. (b) Immunohistochemistry of P‐cadherin in human normal breast tissues, showing an intense immunostain of P‐cad in myoepithelial cells and not by luminal epithelial cells (10×). (c) Tissue P‐cad labeling with high‐power view of invasive ductal carcinoma, demonstrating membrane‐bound staining of breast cancer cells (100×). Bar 0.5 µm.
Immunohistochemistry of P‐cadherin in human breast tissues. All BC specimens were analyzed for P‐cad expression in tissue (Fig. 5b,c). These specimens were collected and processed from the enrolled subjects who had undergone breast surgery and/or biopsy after NAF and plasma collection. P‐cad was expressed in 42 out of 91 specimens (about 46.2%) of Cancer breast tissue specimens. The staining was predominantly localized on the plasma membrane, even though some cases demonstrated cytoplasmic staining. Neither staining intensity nor distribution was influenced by disease diagnosis, without significant differences among ADH, DCIS and IBC patients (data not shown).
Discussion
Many reports of serum and tissue‐soluble fragment and full‐length P‐cadherin and their association with BC have focused on later‐stage disease and prognosis.( 15 ) High levels of this protein were found in women with basal‐like, medullar, metaplastic and high‐grade invasive ductal BC (who had a poor prognosis and patient survival),( 16 , 17 , 18 , 19 , 20 , 21 ) while not detected in lobular and low‐grade invasive BC.( 15 , 19 ) The percentage of BC tissues that aberrantly expressed P‐cadherin ranged from 4% to 71%, with an average of 36% of positive breast tumor, showing moderate to intense membrane immunostaining, usually associated with cytoplasmic expression and sometimes focally distributed.( 19 ) The probabilities of disease‐free and overall survival were significantly lower for patients with P‐cadherin‐positive tumors, even though P‐cadherin expression was not significantly correlated with tumor size, lymph node metastases and angiogenesis.( 18 ) In the present study, we found that 46.2% of BC tissue expressed P‐cad, of which 54.8% was ER/PR negative, 64.3% was of Grade 2 and 30.9% was c‐erbB‐2 positive: our immunohistochemical data about P‐cad expression on high‐grade BC tissue specimens and the related expression of ER/PR receptor status and the HER2 expression are in full agreement with previous studies,( 15 , 17 , 18 , 19 , 20 , 21 , 22 , 23 ) confirming that P‐cad expression in BC tissues is inversely correlated with ER/PR status, positively correlated with a high histologic grade and suggesting that P‐cad expression may be a marker of aggressiveness.( 15 , 18 ) It is well known that P‐cad‐expressing tumors are highly aggressive and may originate from cap cells with stem cell behavior,( 44 ) which do not express estrogen receptor, a common characteristic of tumors expressing P‐cad. Moreover, several paracrine growth factors that are known to stimulate the growth of cap cells are also associated with the up‐regulation of matrix metalloproteinases,( 18 ) a class of proteinases that is known to degrade full‐length P‐cad shedding its extracellular soluble fragment.( 26 )
Soluble fragments of the extracellular domain of classic cadherins have been reported previously in several biological fluids (e.g. serum, urine, spermatozoa, milk and prostate secretion) and in conditioned medium from cultured cells,( 8 , 45 , 46 , 47 ) suggesting that shedding of soluble fragments of cadherins occurs under normal and diseased conditions, and accompanies several crucial processes (e.g. tissue remodelling, apoptosis, invasion).( 5 , 7 , 48 , 49 , 50 , 51 , 52 ) Altered P‐cad expression (at mRNA and protein levels) was found in human rare autosomal‐recessive disorder and in several mouse organs, differentially expressed in embryonic and adult tissues.( 9 ) Based on several lines of evidence, P‐cadherin expression is considered a good indicator of poor prognosis in BC patients.( 18 , 20 ) Although there is not yet any validated explanation for the increased expression of P‐cadherin in BC cells, its aberrant expression in certain BC tissues has been hypothesized linked either to the proliferative ability acquired by tumor cells with high mitotic index or to its peculiar onco‐fetal property.( 17 , 18 , 19 )
Proteolysis can contribute to the impairment of the cadherin functions. Several proteolytic enzymes have been shown to be responsible for the shedding of the extracellular domain of different cadherins. For example, matrilysin, stromelysin‐1, plasmin, disintegrin and matrix metalloproteinase can cleave the extracellular portion of the E‐ and N‐ full‐length cadherins (shedding in biological fluids the soluble fragments of 80 and 90 kDa, respectively).( 45 , 46 , 47 ) Based on the evidence that cancer cells (including breast cancer) almost invariably show diminished cadherin‐mediated intercellular adhesion and cadherin ectodomain shedding, a recent review highlighted the importance of soluble cadherin fragments that may retain specific biological activity during cancer cell invasion and angiogenesis, suggesting their role as cancer biomarkers.( 52 )
Soluble fragments of P‐cadherin (sP‐cad) were found in serum of healthy subjects as well as in BC patients, but no significant difference was found between these two populations.( 25 ) Remarkably, the sP‐cad levels are 20‐fold lower than the sE‐cad levels in serum,( 25 ) in addition, sP‐cad of 80 kDa was also detected in milk, demonstrating that in canine and human lactating mammary gland tissues, P‐cadherin is a protein secreted by epithelial cells, rather than an adhesion protein.( 14 , 53 ) Further studies through the degradome analysis are in progress to determine the (common?) sites of proteolysis of the sP‐cad‐secreted protein in different bodily fluids during physio‐pathologic conditions (such as milk, NAF, semen, breast cyst fluid and amniotic fluid).
Our immunocytochemical evidence that breast cells floating in NAF contains appreciable amounts of the soluble fragment of the extracellular domain of full‐length P‐cadherin molecule is in agreement with the immunohistochemical data of sP‐cad immunolabeling in lactating gland tissue at increased levels respect to the non‐lactating breast tissue.( 14 , 53 ) Up to now, no alternative spliced forms of P‐cadherin mRNA have been described.( 15 , 54 , 55 ) Moreover, the finding that sP‐cad may be shed in milk via proteolysis,( 52 ) strengthens our hypothesis that high levels of sP‐cad accumulated in Cancer NAF may be derived from its shedding after proteolytic cleavage of the extracellular domain of the full‐length P‐cadherin. To add more consistency to our hypothesis, we have performed preliminar evaluation of the ability of NAF proteinases,( 31 , 35 , 36 ) to degrade in vitro full‐length P‐cad. Our observations pointed to the suggestion that neutral proteinase(s) may be responsible for the shedding of P‐cad soluble fragments (pH‐dependent and EDTA‐inhibited activity). Further studies are required to identify the proteinase families that possess the ability to cleave and shed soluble fragments of P‐cad.
Comparing sP‐cad content in NAF collected from the PreCancer and Cancer patients with NAF from NoCancer healthy subjects, we found that the higher soluble fragment concentrations may better represent a local process of higher biosynthetic activity rather than a passive accumulation mechanism or plasma filtration. Although the cellular source and formation mechanism(s) of NAF sP‐cad is unknown, we suggest that its accumulation in subgroups of Cancer NAF and in NAF from patients at higher BC risk may derive from the highly metabolizing cells lining the ductal tree.( 30 , 37 ) In the present study, we have evaluated the relationship between P‐cad expression in BC tissue and the presence of sP‐cad in NAF collected before surgery from the same women; our results on P‐cad demonstrate that the analysis of NAF is the mirror of BC tissue microenvironment, and that several proteinases found in NAF at high concentrations (e.g. matrix metalloproteinases),( 35 ) may be in part responsible for the degradation of full‐length P‐cad and the release of extracellular soluble P‐cad fragment. Although the shedding mechanism of the extracellular domain fragment of P‐cad from the cell surface is not known, it has been proposed that it involves the activity of matrix metalloproteinases.( 52 , 56 , 57 ) In this respect, the production by breast cells and the secretion/accumulation of several matrix metalloproteinases in NAF (in particular at higher levels in patients at high BC risk),( 35 ) may represent a potential mechanism for the release of sP‐cad from the breast ductal cell surface, suggesting the intact transmembrane P‐cadherin as a biologically active target for matrix metalloproteinases activity.( 52 , 58 ) However, it has also been hypothesized that the transmembrane P‐cadherin is proteolytically processed in the cytoplasm of epithelial cells, rather than at the cell surface, and then secreted into the lumen of the breast duct.( 14 , 53 )
The cleavage of several cadherins by matrix metalloproteinases (and probably by other proteinases found in NAF, such as urokinase‐type plasminogen activator),( 35 , 36 ) may play a critical role in promoting the proliferation and invasiveness of tumor cells through abnormal functioning of the cadherin–catenin signaling pathway and shedding soluble fragment of cadherins that are involved in cancer proliferation (pro‐invasive activity of sP‐cad).( 5 , 52 , 54 , 55 , 59 ) On the other hand, the release of soluble cadherin fragments may up‐regulate the matrix metalloproteinase activity in human cancers (contributing to expression of an invasive phenotype by tumor cells by regulating their metalloproteinase production/secretion).( 56 , 57 , 59 , 60 , 61 )
In summary, the soluble fragment of P‐cadherin, but not full‐length P‐cadherin, is detectable in human NAF. In particular, NAF levels of sP‐cad are significantly higher in women with BC, and in women at increased BC risk, with respect to healthy subjects. Moreover, increased levels of sP‐cad are found in NAF collected from BC patients with high‐grade tumors, with c‐erbB‐2 positivity and ER/PR‐negative receptor status, indicative of more aggressive BC phenotype. The reason for the increased expression of sP‐cad in a subset of BC NAF is actually unknown, it may be due to enhanced activity of proteinases (in particular matrix metalloproteinases and urokinase‐type plasminogen activator, proteolytic enzymes found at high levels in NAF),( 35 , 36 ) supporting the concept that sP‐cad is more than a sticky molecule and may play multiple functional roles in addition to its contribution to breast cell adhesion.( 6 , 52 , 61 ) The higher concentrations in NAF from postmenopausal women and the significantly higher levels of sP‐cad in NAF collected from PreCancer and Cancer women when compared with NoCancer subjects (apparently healthy women), confirm that NAF may have more value in BC risk assessment than as a diagnostic or screening tool,( 38 ) suggesting also that measuring sP‐cad in NAF from larger cohort/population may prove useful in BC risk stratification and improve the identification of women with more aggressive BC with poor prognosis and survival.
Acknowledgments
We would like to thank Dr M. Sebastiani (Center of Senology, AUSL 1, Pesaro, Italy) and Mrs L. Schlatter (Department of Surgery, University of Missouri, Columbia, MO, USA) for their assistance in the patient recruitment, and collecting both NAF samples and patients’ clinical data. We would also like to thank Mrs Eleonor Cencherle for assisting in English revision. This study was supported by the Research Grant Award 2007 (to FM) from Susan Love Research Foundation (Pacific Palisades, CA).
References
- 1. Jemal A, Murray T, Ward E et al . Cancer statistics 2005. CA Cancer J 2005; 55: 10–30. [DOI] [PubMed] [Google Scholar]
- 2. Fabian CJ, Kimler BF, Mayo MS, Khan SA. Breast‐tissue sampling for risk assessment and prevention. Endocr Relat Cancer 2005; 12: 185–213. [DOI] [PubMed] [Google Scholar]
- 3. Mielnicki LM, Asch HL, Asch BB. Genes, chromatin, and breast cancer: an epigenetic tale. J Mammary Gland Biol Neoplasia 2001; 6: 169–82. [DOI] [PubMed] [Google Scholar]
- 4. Taddei I, Faraldo MM, Teuliere J, Deugnier MA, Thiery JP, Glukhova MA. Integrins in the mammary gland development and differentiation of mammary epithelium. J Mammary Gland Biol Neoplasia 2003; 8: 383–94. [DOI] [PubMed] [Google Scholar]
- 5. Conacci‐Sorrell M, Zhurinsky J, Ben‐Ze’ev A. The cadherin‐catenin adhesion system in signaling and cancer. J Clin Invest 2002; 109: 987–91. [DOI] [PMC free article] [PubMed] [Google Scholar]
- 6. Cavallaro U, Schaffhauser B, Christofori G. Cadherins and the tumor progression: is it all in a switch? Cancer Lett 2002; 176: 123–8. [DOI] [PubMed] [Google Scholar]
- 7. Wheelock MJ, Johnson KR. Cadherins as modulators of cellular phenotype. Ann Rev Cell Dev Biol 2003; 19: 207–35. [DOI] [PubMed] [Google Scholar]
- 8. Knudsen KA, Wheelock MJ. Cadherins and the mammary gland. J Cell Biochem 2005; 95: 488–96. [DOI] [PubMed] [Google Scholar]
- 9. Cowin P, Rowlands TM, Hatsell SJ. Cadherins and catenins in breast cancer. Curr Opin Cell Biol 2005; 17: 499–508. [DOI] [PubMed] [Google Scholar]
- 10. Bussemakers MJBA, Voller M, Smith FP, Schalken JA. The genes for the calcium‐dependent cell adhesion molecules P‐ and E‐cadherin are tandemly arranged in the human genome. Biochem Biophys Res Commun 1994; 203: 1291–4. [DOI] [PubMed] [Google Scholar]
- 11. Nollet F, van Kools P, RF. Phylogenetic analysis of the cadherin superfamily allows identification of six major subfamilies besides several solitary members. J Mol Biol 2000; 299: 551–72. [DOI] [PubMed] [Google Scholar]
- 12. Daniel C, Strickland P, Friedman Y. Expression and functional role of E‐ and P‐cadherins in mouse mammary ductal morphogenesis and growth. Dev Biol 1995; 169: 511–51. [DOI] [PubMed] [Google Scholar]
- 13. Radice GL, Sauer CL, Kostetskii I, Peralta SA, Knudsen KA. Inappropriate P‐cadherin expression in the mouse mammary epithelium is compatible with normal mammary gland function. Differentiation 2003; 71: 361–73. [DOI] [PubMed] [Google Scholar]
- 14. Soler AP, Russo J, Russo IH, Knudsen KA. Soluble fragment of P‐cadherin adhesion protein found in human milk. J Cell Biochem 2002; 85: 180–4. [PubMed] [Google Scholar]
- 15. Paredes J, Correia AL, Ribeiro AS, Albergaria A, Milanezi F, Schmitt FC. P‐cadherin expression in breast cancer: a review. Breast Cancer Res 2007; 9: 214 (in press doi: 10.1186/bcr1744). [DOI] [PMC free article] [PubMed] [Google Scholar]
- 16. Rasbridge SA, Gillet CE, Sampson SA, Walsh FS, Millis RR. Epithelial (E‐) and placental (P‐) cadherin cell adhesion molecule expression in breast carcinoma. J Pathol 1993; 169: 245–50. [DOI] [PubMed] [Google Scholar]
- 17. Palacios J, Benito N, Pizarro A, Suarez A, Espada J, Cano A, Gamallo C. Anomalous expression of P‐cadherin in breast carcinoma. Correlation with E‐cadherin expression and pathological features. Am J Pathol 1995; 147: 605–12. [PMC free article] [PubMed] [Google Scholar]
- 18. Soler AP, Knudsen KA, Salazar H, Han AC, Keshgegian AA. P‐cadherin expression in breast carcinoma indicates poor survival. Cancer 1999; 86: 1263–72. [DOI] [PubMed] [Google Scholar]
- 19. Gamallo C, Moreno‐Bueno G, Sarrio D, Calero F, Hardisson D, Palacios J. The prognostic significance of P‐cadherin in infiltrating ductal breast carcinoma. Mod Pathol 2001; 14: 650–4. [DOI] [PubMed] [Google Scholar]
- 20. Kovacs A, Dhillon J, Walker RA. Expression of P‐cadherin, but not E‐ or N‐cadherin, relates to pathological and functional differentiation of breast carcinomas. J Clin Pathol Mol Pathol 2003; 56: 318–22. [DOI] [PMC free article] [PubMed] [Google Scholar]
- 21. Kovacs A, Walker RA. P‐cadherin as a marker in the differential diagnosis of breast lesions. J Clin Pathol 2003; 56: 139–41. [DOI] [PMC free article] [PubMed] [Google Scholar]
- 22. Paredes J, Milanezi F, Reis‐Filho JS, Leitao D, Athanazio D, Schmitt F. Aberrant P‐cadherin expression: is it associated with estrogen‐independent growth in breast cancer? Pathol Res Pract 2002; 198: 795–801. [DOI] [PubMed] [Google Scholar]
- 23. Paredes J, Milanezi F, Viegas L, Amendoeira I, Schmitt F. P‐cadherin expression is associated with high‐grade ductal carcinoma in situ of the breast. Virchows Arch 2002; 440: 16–21. [DOI] [PubMed] [Google Scholar]
- 24. Fanelli MA, Montt‐Guevara M, Diblasi AM et al . P‐cadherin and beta‐catenin are useful prognostic markers in breast cancer patients; beta‐catenin interacts with heat‐shock protein Hsp27. Cell Stress Chaperones 2008; 13: 207–20. [DOI] [PMC free article] [PubMed] [Google Scholar]
- 25. Knudsen KA, Lin CY, Johnson KR, Wheelock MJ, Keshgegian AA, Peralta Soler A. Lack of correlation between serum levels and E‐ and P‐cadherin fragments and the presence of breast cancer. Hum Pathol 2000; 31: 961–5. [DOI] [PubMed] [Google Scholar]
- 26. Munshi HG, Stack MS. Reciprocal interactions between adhesion receptor signaling and MMP regulation. Cancer Metastasis Rev 2006; 25: 45–56. [DOI] [PubMed] [Google Scholar]
- 27. Potemski P, Kusinska R, Kubiak R et al . Relationship of P‐cadherin expression to basal phenotype of breast carcinoma. Pol J Pathol 2007; 58: 183–8. [PubMed] [Google Scholar]
- 28. Fahy BN, Bold RJ, Schneider PD, Khatri V, Goodnight JE Jr. Cost‐benefit analysis of biopsy methods for suspicious mammographic lesions. Arch Surg 2001; 136: 990–4. [DOI] [PubMed] [Google Scholar]
- 29. Sauter ER, Ross E, Daly M, Klein‐Szano A, Engstrom PF, Sorling A. Nipple aspirate fluid: a promising non‐invasive method to identify cellular markers of breast cancer risk. Br J Cancer 1997; 76: 494–501. [DOI] [PMC free article] [PubMed] [Google Scholar]
- 30. Mannello F, Tonti GA, Qin W, Zhu W, Sauter ER. Do nipple aspirate fluid epithelial cells and their morphology predict breast cancer development? Breast Cancer Res Treat 2007; 102: 125–7. [DOI] [PubMed] [Google Scholar]
- 31. Petrakis NL. Physiologic, biochemical, and cytologic aspects of nipple aspirate fluid. Breast Cancer Res Treat 1986; 8: 7–19. [DOI] [PubMed] [Google Scholar]
- 32. Petrakis NL. Studies on the epidemiology and natural history of benign breast disease and breast cancer using nipple aspirate fluid. Cancer Epidemiol Biomarkers Prev 1993; 2: 3–10. [PubMed] [Google Scholar]
- 33. Mannello F, Fabbri L, Ciandrini E, Tonti GA. Increased levels of erythropoietin in nipple aspirate fluid and in ductal cells from breast cancer patients. Cell Oncol 2008; 30: 51–61. [DOI] [PMC free article] [PubMed] [Google Scholar]
- 34. Mannello F, Tonti GA, Canestrari F. Nutrients and nipple aspirate fluid composition: the breast microenvironment regulates protein expression and cancer aetiology. Genes Nutr 2008. (DOI: 10.1007/s12263-008-0087-0). [DOI] [PMC free article] [PubMed] [Google Scholar]
- 35. Mannello F, Sebastiani M. Zymographic analyses and measurement of matrix metalloproteinase‐2 and ‐9 in nipple aspirate fluids. Clin Chem 2003; 49: 1546–50. [DOI] [PubMed] [Google Scholar]
- 36. Qin W, Zhu W, Wagner‐Mann C, Sauter ER. Nipple aspirate fluid expression of urokinase‐type plasminogen activator, plasminogen activator inhibitor‐1, and urokinase‐type plasminogen activator receptor predicts breast cancer diagnosis and advanced disease. Ann Surg Oncol 2003; 10: 948–53. [DOI] [PubMed] [Google Scholar]
- 37. Malatesta M, Mannello F, Bianchi G, Sebastiani M, Gazzanelli G. Biochemical and ultrastructural features of human milk and nipple aspirate fluids. J Clin Lab Anal 2000; 14: 330–5. [DOI] [PMC free article] [PubMed] [Google Scholar]
- 38. Dua RS, Isacke CM, Gui JP. The intraductal approach to breast cancer biomarker discovery. J Clin Oncol 2006; 24: 1209–16. [DOI] [PubMed] [Google Scholar]
- 39. Li J, Zhao J, Yu X et al . Identification of biomarkers for breast cancer in nipple aspirations and ductal lavage fluid. Clin Cancer Res 2005; 11: 8312–20. [DOI] [PubMed] [Google Scholar]
- 40. King BL, Love SM. The intraductal approach to breast cancer: raison d’etre. Breast Cancer Res 2006; 8: 206. [DOI] [PMC free article] [PubMed] [Google Scholar]
- 41. Singletary SE, Connolly JL. Breast cancer staging: working with the sixth edition of the AJCC cancer staging manual. CA Cancer J Clin 2006; 56: 37–47. [DOI] [PubMed] [Google Scholar]
- 42. Mannello F, Malatesta M, Luchetti F, Papa S, Battistelli S, Gazzanelli G. Immunoreactivity, ultrastructural localization, and transcript expression of prostate‐specific antigen in human neuroblastoma cell lines. Clin Chem 1999; 45: 78–84. [PubMed] [Google Scholar]
- 43. Fay MP, Feuer EJ. Confidence intervals for directly standardised rates: a method based on the gamma distribution. Statistics Med 1998; 16: 791–801. [DOI] [PubMed] [Google Scholar]
- 44. Wicha MS. Cancer stem cell heterogeneity in hereditary breast cancer. Breast Cancer Res 2008; 10: (DOI: 10.1186/bcr1990). [DOI] [PMC free article] [PubMed] [Google Scholar]
- 45. Katayama M, Hirai S, Kamihagi K, Nakagawa K, Yasumoto M, Kato I. Soluble E‐cadherin fragments increased in circulation of cancer patients. Br J Cancer 1994; 69: 580–5. [DOI] [PMC free article] [PubMed] [Google Scholar]
- 46. Banks RE, Porter WH, Whelan P, Smith PH, Selby PJ. Soluble forms of the adhesion molecule E‐cadherin in urine. J Clin Pathol 1995; 48: 179–80. [DOI] [PMC free article] [PubMed] [Google Scholar]
- 47. Derycke L, de Wever O, Stove V et al . Soluble N‐cadherin in human biological fluids. Int J Cancer 2006; 119: 2895–900. [DOI] [PubMed] [Google Scholar]
- 48. Takeichi M. Cadherin cell adhesion receptors as a morphogenetic regulator. Science 1991; 251: 1451–5. [DOI] [PubMed] [Google Scholar]
- 49. Takeichi M. Cadherins in cancer: implications for invasion and metastasis. Curr Opin Cell Biol 1993; 5: 806–11. [DOI] [PubMed] [Google Scholar]
- 50. Rufas O, Fisch B, Ziv S, Shalgi R. Expression of cadherin adhesion molecules on human gametes. Mol Hum Reprod 2000; 6: 163–9. [DOI] [PubMed] [Google Scholar]
- 51. Steinhusen U, Weiske J, Badock V, Tauber R, Bommert K, Huber O. Cleavage and shedding of E‐cadherin after induction of apoptosis. J Biol Chem 2001; 276: 4972–80. [DOI] [PubMed] [Google Scholar]
- 52. De Wever O, Derycke L, Hendrix A et al . Soluble cadherins as cancer biomarkers. Clin Exp Metastasis 2007; 24: 685–97. [DOI] [PubMed] [Google Scholar]
- 53. Gama A, Paredes J, Milanezi MF, Reis‐Filho JS, Gartner F, Schmitt FC. P‐cadherin expression in canine lactating mammary gland. J Cell Biochem 2002; 86: 420–1. [DOI] [PubMed] [Google Scholar]
- 54. Hazan RB, Qiao R, Keren R, Badano I, Suyama K. Cadherin switch in tumor progression. Ann NY Acad Sci 2004; 1014: 155–63. [DOI] [PubMed] [Google Scholar]
- 55. Zhang YGJ, Tian XX, Zhong YF, Fang WG. Expression of E‐cadherin, beta‐catenin, cathepsin D, gelatinases and their inhibitors in invasive ductal breast carcinomas. Chin Med J 2007; 220: 1597–605. [PubMed] [Google Scholar]
- 56. Saad S, Bendall LJ, James A, Gottlieb DJ, Bradstock KF. Induction of matrix metalloproteinase MMP‐1 and MMP‐2 by co‐culture of breast cancer cells and bone marrow fibroblast. Breast Cancer Res Treat 2000; 63: 105–15. [DOI] [PubMed] [Google Scholar]
- 57. George SJ, Dwivedi A. MMPs, cadherins and cell proliferation. Trends Cardiovasc Med 2004; 14: 100–5. [DOI] [PubMed] [Google Scholar]
- 58. Takahashi M, Tsunoda T, Seiki M, Nakamura Y, Furukawa Y. Identification of membrane type matrix metalloproteinase‐1 as a target of the â‐catenin/Tcf4 complex in human colorectal cancers. Oncogene 2002; 21: 5861–7. [DOI] [PubMed] [Google Scholar]
- 59. Hazan RB, Phillips GR, Qiao RF, Norton L, Aaronson SA. Exogenous expression of N‐cadherin in breast cancer cells induces cell migration, invasion and metastases. J Cell Biol 2000; 148: 779–90. [DOI] [PMC free article] [PubMed] [Google Scholar]
- 60. Nawrocki‐Raby B, Gilles C, Pollette M et al . Up‐regulation of MMPs by soluble E‐cadherin in human lung tumour cells. Int J Cancer 2003; 105: 790–5. [DOI] [PubMed] [Google Scholar]
- 61. Arnes JB, Brunet JS, Stefansson I et al . Placental cadherin and the basal epithelial phenotype of BRCA1‐related breast cancer. Clin Cancer Res 2005; 11: 4003–11. [DOI] [PubMed] [Google Scholar]